Democrats Riding a Wave?
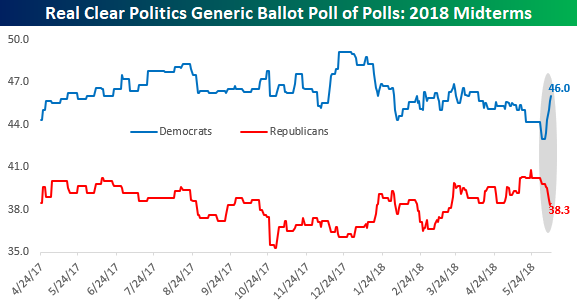
As is usually the case during mid-term election years under a new President, the polling data for the upcoming mid-term elections has shown a consistent lead for the Democratic party in this November’s elections, which are now less than 150 days from now. While the lead has been steady, towards the end of May, the lead for the Democratic party began to really narrow such that by the end of the month the lead was the narrowest it had been since the polling data began in early 2017. Had the GOP managed to close the gap entirely, it would have put serious pressure on the Democrats ahead of the elections. While the narrowing gap in polling data may have provided quite a scare, Democrats can start to breathe a little bit easier based on the trends we have seen since the start of June.
The chart below shows the Real Clear Politics Generic Ballot Poll for the 2018 Midterms. While the gap really started to narrow in late May, we have seen a resurgence on the popularity of Democrats since the start of June, rising from 43% up to 46.0%, while the popularity of the GOP has started to fade. At current levels, the spread for the Democrats has widened back out to its highest level since late March!
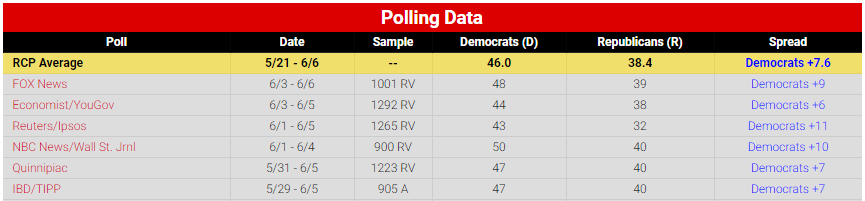
While the reversal in favor of Democrats has been swift, the chart above may not even do it justice. That’s because of all the latest polls that have at least partly taken place in June, Democrats are trouncing the GOP. The graphic below is from Real Clear Politics and shows each of the six national polls for the generic ballot that ended in the month of June. Of the six, the smallest margin lead for Democrats is 6%, while two have the lead in double-digit percentages. On average, the lead is 8.3%.
If the trend of polls for November continues, look for the word gridlock to start trending. The big question is, how do the shifting dynamics in polling impact market prospects? It’s been often argued that political gridlock is good for stock prices, but then again, the last year and a half of full GOP control have also been pretty impressive.
To help answer the question of what to expect in the November mid-terms, both in terms of how the elections and markets may shake out, we recently published a report for clients looking at historical trends in midterm years. We strongly suggest you check it out.
B.I.G. Tips – Cramming for Midterms
The “Go-Go Years” for Plastic Surgeons
Bespoke’s Consumer Pulse Report is an analysis of a huge consumer survey that we run each month. Our goal with this survey is to track trends across the economic and financial landscape in the US. Using the results from our proprietary monthly survey, we dissect and analyze all of the data and publish the Consumer Pulse Report, which we sell access to on a subscription basis. To see what the report is all about, sign up for a 30-day free trial to our Bespoke Consumer Pulse subscription service. With a trial, you’ll get coverage of consumer electronics, social media, streaming media, retail, autos, and much more. The report also has numerous proprietary US economic data points that are extremely timely and useful for investors.
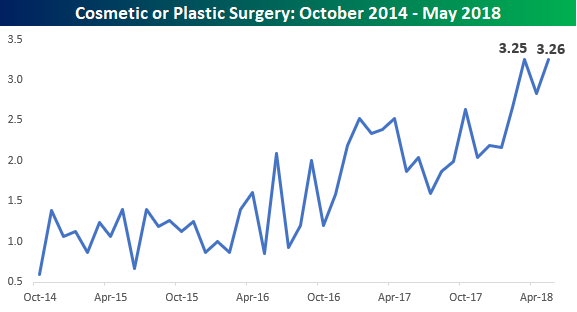
One question we ask respondents each month is whether or not they have had any of a number of various necessary or elective medical procedures. In terms of elective procedures, because the costs associated with these are less likely to be covered by insurance, consumers are less likely to have them done when their finances are tight. Conversely, they’re more likely to ‘splurge’ when they have a positive view of their personal finances. In the case of Cosmetic or Plastic surgery procedures, our latest Consumer Pulse Report saw a new high in the number of respondents who have recently “had work done” at 3.26%.
As shown in the chart below, early on in the history of our survey from late 2014 through early 2016, the percentage of consumers who had recently had a cosmetic surgery procedure was in a range of 1.0% to 1.5%. In early 2016, that percentage started to trend higher and surged to 2.5% in late 2016 right after the election. For the next year, the percentage moved within a (higher) range between 2.0% and 2.5%. Then, earlier this year it broke out above 3%, hitting a record of 3.25% in March and then another new marginal high of 3.26% in May.
Stick To Soccer This Summer: World Cup Returns Lag Other Periods
With the World Cup set to kick off this week, investors should probably keep their eyes on the pitch rather than the market if they’re looking for joy.
For our “just for fun” file, we decided to take a look at the performance of the US equity market during the international soccer tournament. During the span of the World Cup, the US equity market has averaged a decline of 1% when measured from the day before the first game to the day after the final game. Median returns are less negative, a decline of 12 bps. Half the tournaments have resulted in gains, while the other half have seen losses. Those declines aren’t the end of the world, of course, but the average period of similar length throughout World Cup years has seen a gain of 43 bps on average and 1.03% median, with gains 57% of the time. We show returns by year of the World Cup below.
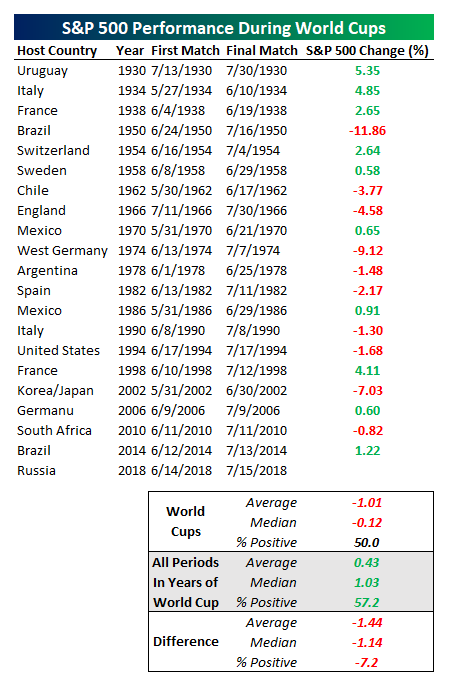
As shown in the chart below, the 2018 equity market is starting out from a much more advantageous position than the historical average. On average when the World Cup has started historically, the US equity market has already been in a significant drawdown.
We want to emphasize that this analysis isn’t meant as a way to beat (or lag) the market; while historical analyses are often very helpful, World Cup underperformance are almost certainly a function of random noise.
Bespoke Brunch Reads: 6/10/18
Welcome to Bespoke Brunch Reads — a linkfest of the favorite things we read over the past week. The links are mostly market related, but there are some other interesting subjects covered as well. We hope you enjoy the food for thought as a supplement to the research we provide you during the week.
Science
These Physicists Watched A Clock Tick For 14 Years Straight by Sophia Chen (Wired)
Long-term, highly monotonous experiments have a place in physics, just like every other type of science. In this case, it’s a question of proving that the laws of physics are in fact constant. [Link]
Your Next Glass of Wine Might Be A Fake – And You’ll Love It by Bruce Schoenfeld (Wired)
Precise chemical analyses of some of the best wines available yields a wealth of information about what makes them taste the way they do. In some cases, that flavor can be replicated. [Link]
Economics
The Missing Profits of Nations by Gabriel Zucman (NBER Working Papers)
Using a unique data set, the authors estimate roughly 40% of multinational corporate profits are shifted to tax havens in an effort to avoid national taxation. [Link; 44 page PDF]
The Most Successful Ethnic Group In The U.S. May Surprise You by Molly Fosco (Ozy)
We’ll save you the click, but you should really read through this analysis of why Nigerian-Americans are consistently the best-educated around. [Link]
The world’s biggest hedge fund warns: ‘2019 is setting up to be a dangerous period for the economy’ by Graham Rapier (Business Insider)
The world’s largest hedge fund sees significant economic risk next year, driven mostly by the fact that central banks are tightening policy. [Link]
Labor Markets
U.S. economy can’t keep on truckin’ without more drivers to ease flat-bed shortage by Jeffry Bartash (MarketWatch)
Truck drivers are apparently going extinct – at least relative to demand. The paucity of drivers is pushing up costs across the economy. [Link]
America’s gig economy is smaller now than before Uber existed, official data show by Danielle Paquette and Heather Long (WaPo)
While the consensus has been that the “gig” economy has been growing rapidly, recent data updated by the BLS suggest quite the opposite. [Link; soft paywall]
Shale Country Is Out of Workers and Dangling 100% Pay Hikes by David Wethe (Bloomberg)
Seeking any help they can, companies in West Texas are facing a scorching hot regional economy featuring surging home prices, huge wages, and no hired help to be found. [Link; auto-playing video, soft paywall]
Tech Tales
Adobe Photoshop Source Code by Len Shustek (Computer History Museum)
If ancient (by the standards of code, anyways) programs are your cup of tea, this story includes a link to the original source code of Photoshop, first rolled out in 1990. [Link]
Driverless Cars Still Handled by Humans—From Afar by Tim Higgins (WSJ)
One solution to driverless car testing is to pilot the vehicles remotely, rather than with a human in the car and directly behind the wheel. [Link; paywall]
This baby’s first word was ‘Alexa’ by Christian Gollayan (NYP)
A British baby’s first word was mimicked from his parents’ use of the Amazon voice-enabled assistant, which will at the very least make for a good wedding toast some day. [Link]
This Former Tesla Staffer Became an Internet Millionaire in His Spare Time by Zeke Faux (Bloomberg)
A Tesla product manager is trying to bring ubiquitous Korean hangover cures to the American market, and his start-up is now valued at more than $33mm. [Link; soft paywall]
Loss
CNN’s Anthony Bourdain dead at 61 by Brian Stelter (CNN)
After spending a career exposing his viewers to some of the most unique and untested experiences and cultures related to food around the world, Anthony Bourdain took his on life on Friday. The National Suicide Prevention Lifeline can be reached at 1-800-273-8255; please consider calling it if you or anyone you know is suffering from depression or thinking about self-harm. [Link]
Trade History
Exclusive: Trump invokes War of 1812 in testy call with Trudeau over tariffs by Jim Acosta and Paul Newton (CNN)
An inventive bit of justification for levying new tariffs against one’s closest ally: 200+ years ago there was a war that ended with the nation’s capital in a smoldering ruin, retaliation for the burning of York (modern Toronto). [Link; auto-playing video]
Manure
Lottery Winner Arrested For Dumping $200,000 of Manure On Ex-Boss’ Lawn (World News Daily Report)
After winning $125mm in a lottery draw, Brian Morris of Illinois delivered 20,000 tons of manure to his former boss’ front yard. [Link]
Data Driven
Is your collected data useless after GDPR? by understand.ai (Medium)
New EU regulations mean that faces and license plates captured in data collected by self-driving car testing could be considered personal data collected without consent, posing a huge problem. [Link]
Plain Text vs. HTML Emails: Which Is Better? [New Data] by Niti Shah (HubSpot)
An analysis of the tradeoffs facing email marketers when considering whether to use pleasantly-formatted and feature-rich HTML or quick and simple plain text. [Link]
Read Bespoke’s most actionable market research by starting a two-week free trial today! Get started here.
Have a great Sunday!
The Bespoke Report – Three Dunces and a Step Higher
We’ve just published our weekly Bespoke Report newsletter, which is available to subscribers across all three of our membership levels. You can read it now by choosing a membership option and starting a two-week free trial at this page. Below is a quick look at what could be a shifting pattern for the S&P 500.

To get out thoughts on this and everything else impacting the market this week, make sure to check out the entire report, choose any membership option and access this week’s full Bespoke Report newsletter after signing up! You won’t be disappointed. Some of the other topics discussed in this week’s report include:
- Every major US index overbought for the first time in months.
- What’s the ‘Smart Money’ indicator telling us about the market?
- Strong Starts to June: Rest of June, rest of Summer.
- Thursday’s divergence between the Nasdaq and Dow. A turning point?
- Apple production cuts. We’ve seen this movie before.
- Doctor Copper.
- Highlights from this month’s Bespoke Consumer Pulse report.
- Carnage in Emerging Markets. Where are we looking?
- Big FOMC meeting next week.
- Factors driving Technology.
- Bespoke 50 update.
- Where we are in the correction script.
- Should companies stop giving quarterly guidance?
The Closer: End of Week Charts — 6/8/18
Looking for deeper insight on global markets and economics? In tonight’s Closer sent to Bespoke clients, we recap weekly price action in major asset classes, update economic surprise index data for major economies, chart the weekly Commitment of Traders report from the CFTC, and provide our normal nightly update on ETF performance, volume and price movers, and the Bespoke Market Timing Model. We also take a look at the trend in various developed market FX markets.
Below is a snapshot from today’s Closer highlighting weekly intraday price charts for major equity indices and other asset classes. If you’d like to see more, start a free trial below.

The Closer is one of our most popular reports, and you can sign up for a free trial below to see it!
See tonight’s Closer by starting a two-week free trial to Bespoke Institutional now!
Casino Stocks Not Benefiting Much From Sports Betting Ruling So Far
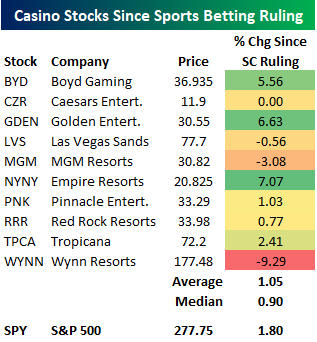
Back on May 14th when the US Supreme Court ruled that a nationwide ban on sports betting was unconstitutional, many pundits (both in finance and sports) immediately argued that the casino stocks would be big beneficiaries.
Since the Supreme Court ruling, though, the average and median performance of publicly traded casino stocks has actually been weaker than the S&P 500’s 1.8% gain.
As shown below, the winners in the casino space since the SC ruling have been Boyd Gaming (BYD), Golden Entertainment (GDEN), and Empire Resorts (NYNY). Las Vegas Sands (LVS), MGM Resorts (MGM), and Wynn Resorts (WYNN) have all seen declines.
Become a Bespoke Premium member today with a two-week free trial. You’ll start by getting access to our Bespoke Model Portfolio and our Bespoke Report newsletter due out later today.
Massive Market Breadth
Here’s one you don’t see often. While the S&P 500 is still more than 3.5% off of its record closing high, breadth has been very strong. The chart below shows the cumulative A/D line of the S&P 500 over the last twelve months. Leading up to the peak in January, breadth and price tracked each other closely. Since that high in January, though, breadth has held up extremely well. In fact, back in March when the S&P 500 made its first attempt at a recovery, the cumulative A/D line actually made a new high. Since then, the trend has remained the same. With each market pullback, breadth has seen smaller declines. As a result, since the S&P 500’s record high in January, its cumulative A/D line has made ten new record highs. Furthermore, if breadth finishes the day positive (as it is now), Friday will mark the fifth straight day where the S&P 500’s cumulative A/D line made a new high. Five record highs in the same week? You don’t see that very often!

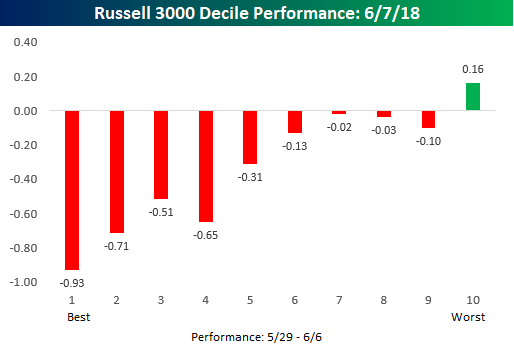
Here’s A Chart Showing Rotation Out of Winners Yesterday
Yesterday was all about rotation for equity markets, and the chart below puts it all into perspective. In the chart, we have broken the Russell 3,000 into deciles (10 groups of 300 stocks each) based on each individual stock’s performance from the recent market low on 5/29 through the close on Wednesday (6/6). The top-performing stocks from 5/29-6/6 are in decile one (on the left side of the chart), while the worst performers from 5/29-6/6 are in decile 10 (on the right side of the chart). The decile of top performing stocks from 5/29 through 6/6 (which were up an average of 15% during that time) were down an average of 0.93% on Thursday. The only decile of stocks that averaged a gain yesterday was the one made up of the stocks that had performed the worst recently leading up to yesterday. You can’t get a clearer example of investors selling their winners and buying their losers than this!
In the last year alone, there have been five other days similar to Thursday where 1) the DJIA was up on the day and the Nasdaq was down, and 2) the performance spread between the two indices was more than a full percentage point. Following these five similar days, there was no clear trend of outperformance by either index over the following week or month, so as far as yesterday’s trading goes, we wouldn’t read anything more into it than investors re-balancing and lightening up on some winners that had seen monster gains over the prior week.
Want more analysis like this? Become a Bespoke Premium member today with a two-week free trial. You’ll start by getting access to our Bespoke Model Portfolio and our Bespoke Report newsletter due out later today.
The Closer — Flash Rallies, Reversals, & Fund Flows — 6/7/18
Log-in here if you’re a member with access to the Closer.
Looking for deeper insight on markets? In tonight’s Closer sent to Bespoke Institutional clients, we take a look at the flash rally and massive volumes in bonds today. We also take a look at EMFX woes, some significant price patterns in US equity indices and copper, and the Q1 flow of funds report from the Federal Reserve.

See today’s post-market Closer and everything else Bespoke publishes by starting a 14-day free trial to Bespoke Institutional today!