The Closer — Quits Surge, Curves Flatten — 7/10/18
Log-in here if you’re a member with access to the Closer.
Looking for deeper insight on markets? In tonight’s Closer sent to Bespoke Institutional clients, we review a very constructive JOLTS report from the BLS, including implications for wage growth. We also take a look at yield curves, which in some cases have already inverted.

See today’s post-market Closer and everything else Bespoke publishes by starting a 14-day free trial to Bespoke Institutional today!
Small Businesses Still Giddy
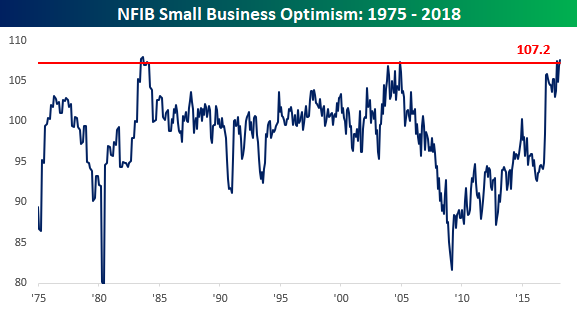
Optimism on the part of small businesses declined slightly this month, but current levels of confidence remain right near record highs. In this month’s survey, the index of Small Business Optimism dropped from 107.8 down to 107.2. Not only was that ahead of consensus expectations, but it was also the 7th highest monthly reading in the history of the report. A period spanning 480 months dating back to the start of 1975. The opening sentence of the commentary section of the report pretty much sums things up with the statement that “Small business owners continue to report astounding optimism as they celebrate strong sales, the creation of jobs, and more profits.”
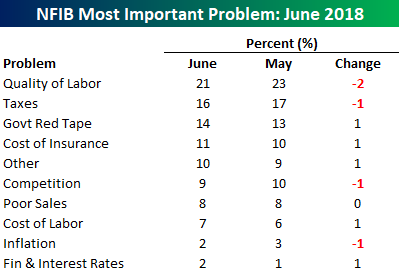
While small business owners are just about as confident as they’ve ever been, there are always issues that businesses face in the day to day to operation of their business. In the table below, we summarize which issues businesses rank as their biggest problems. Topping the list once again this month was “Quality of Labor” which was cited by 21% of all respondents. That’s actually down from last month’s reading of 23%, but it’s still high nonetheless and suggests that wage pressures begin to build underneath the surface. One surprising aspect of this list is the issues that aren’t problems. As shown at the bottom of the table, the three smallest problems for businesses are Finance & Interest Rates (2%), Inflation (2%), and Cost of Labor (%). With the Unemployment Rate right near multi-decade lows, the FOMC hiking rates, and inflation trending higher, one would think that the combined total of these three problems would at least be greater than 11%, but that hasn’t been the case yet.
Franco-Belgian Ballgames & Bourses
As we type this, the second half is underway in the FIFA World Cup semi-final between Belgium and France. The game is an entertaining 1-0 (France ahead) thriller filled with history: the two countries share an official language, a border, and a long history featuring episodes like twin summer revolutions in 1830 or mutual invasion by Germany in both World Wars. Today, however, the two are opposed on the pitch. What about in financial markets? It turns out the result is actually instructive about the difference between short- and long-term relative performance.
We have USD total returns for each country’s MSCI index dating back to the start of 1999. Since then, Belgium has outperformed France in 11 of 20 years, including a streak of seven straight wins from 2009 to 2015. As shown in the last chart below, though, France has been the winner the last three years including 2018 YTD. So does that mean Belgium has been a better bet for investors? No. Since our data starts, France has outperformed Belgium dramatically, returning 138% to investors versus 58% for Belgium. In other words, while Belgium has won more “matches” over the last couple of decades, France has a truly massive leg up when it comes to the “goal” differential between the two countries.
Update on S&P 500 Domestics vs Internationals
Bespoke Stock Scores — 7/10/18
The Closer — Trade Recap, Consumer Credit, Relative Performance — 7/9/18
Log-in here if you’re a member with access to the Closer.
Looking for deeper insight on markets? In tonight’s Closer sent to Bespoke Institutional clients, we review trade balance data updated by the Census last Friday, consumer credit growth reported by the Fed today, and relative performance of equities versus underlying drivers.
See today’s post-market Closer and everything else Bespoke publishes by starting a 14-day free trial to Bespoke Institutional today!
Chart of the Day: Sector Breadth In Good Shape
Bespoke Market Calendar — July 2018
Please click the image below to view our July 2018 market calendar. This calendar includes the S&P 500’s average percentage change and average intraday chart pattern for each trading day during the upcoming month. It also includes market holidays and options expiration dates plus the dates of key economic indicator releases.

Cleaning Up Tariff Impacts
There’s a lot of discussion currently about how much impact new US tariffs on a variety of imports will have on the overall economy. For instance, many businesses in the ISM Manufacturing survey cited tariffs as a negative or cause for concern (link). The FOMC also noted “many District contacts expressed concern about the possible adverse effects of tariffs and other proposed trade restrictions” in its most recent meeting minutes. While overall tariff barriers are still very low versus much of history, the imposition of these new taxes (tariffs are a tax on a specific product) is already having effects.
At the end of January, the administration raised tariffs on both solar cells and washing machines sold to consumers (link). As a result, businesses ramped up imports ahead of the tariff’s introduction. Since 2008, no month had seen more than $185.4mm in washing machine imports. The average month was more like $129mm. In November, however, that number spiked to $223mm with over $310mm imported in December. The introduction of the tariffs in January led to a slower $188.4mm in imports before bottoming out at an anemic $66.1mm in March. We show these numbers (note: we’ve adjusted for seasonality) below.

The key takeaway from this data is that taxes change behavior. In some cases, changes in behavior can be small. In others, they can be large and temporary. Washing machines are a good example. From January to September of 2017, washing machine imports averaged $142.4mm/month. Since, they’ve averaged $155.6mm…but they’ve been extremely lumpy as businesses sought to avoid the tax. That sort of shift in the data is a good example of the effects on data that policy changes can have.
Of course, there are other impacts as well. After seeing 5 years of consistently declining prices, the CPI index for washing machines has surged 17.7% in the last two months as tariffs are passed on to consumers. As new tariffs continue to take effect, remember that they’re a tax hike, and that they can have complicated impacts on economic data which are sometimes hard to predict.
Bespoke’s Most Volatile Stocks on Earnings Ahead of Q2 Earnings Season
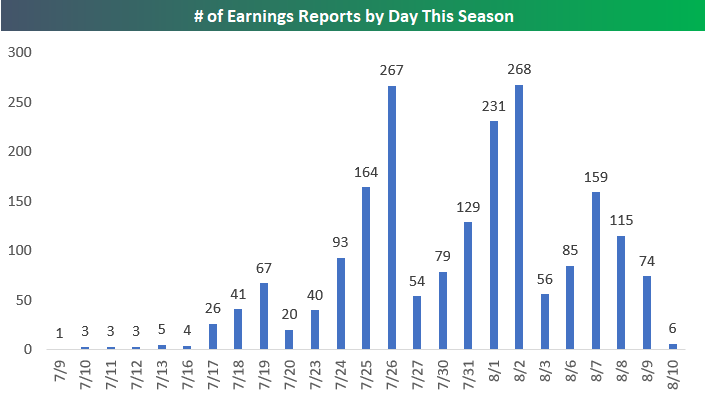
The 2nd quarter earnings reporting period is set to begin in earnest next week. Over the next month, roughly 2,000 public companies will release their Q2 results. While the calendar is relatively empty this week, things start to kick into gear next week as shown in the chart below. Starting with the week of July 23rd, investors will be deluged with dozens (and sometimes hundreds) of reports on a daily basis. The peak week for earnings season comes from July 30th through August 3rd when we hear from 763 companies. The peak day for earnings is Thursday, August 2nd when 268 companies will report.
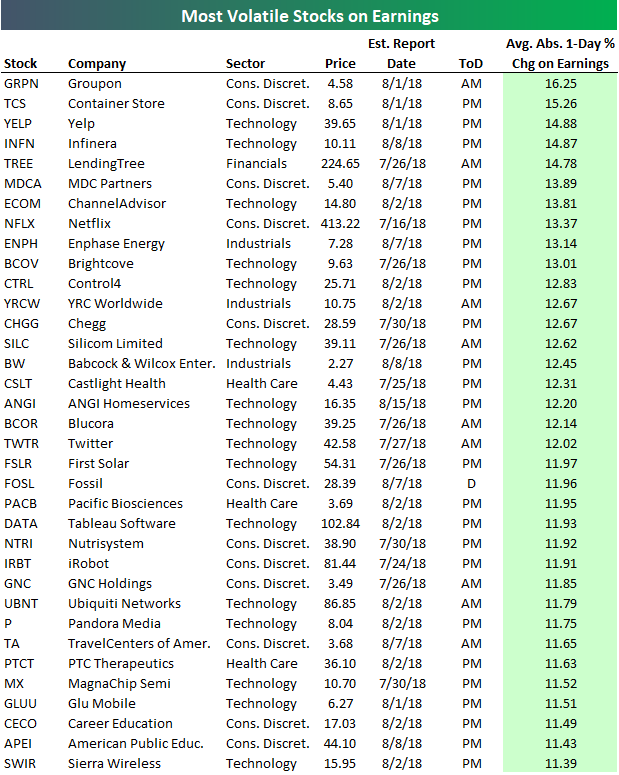
As we do ahead of each earnings season, below is our updated list of the most volatile stocks on earnings. These are the stocks that have historically experienced the biggest one-day stock price reactions (to the upside or downside) to their quarterly earnings reports. For a stock that reports earnings before the open of trading, we look at its change the next trading day. For a stock that reports earnings before the open, we look at that trading day’s change.
To make the list below, a stock must have at least 4 years worth of quarterly earnings reports (16 reports). It also must be set to report earnings between now and mid-August.
As shown, Groupon (GRPN) is the most volatile stock on earnings with an average absolute one-day price change of +/-16.25%. The Container Store (TCS) ranks as the second most volatile with an average one-day move of +/-15.26%. GRPN is set to report on the morning of August 1st, while TCS is set to report after the close on the same day.
Rounding out the top five are Yelp (YELP), Infinera (INFN), and LendingTree (TREE). Each of these stocks have historically moved at least 14% on their earnings reaction days. Other notables on the list include Netflix (NFLX) — which is by far the largest stock on the list — with an average one-day change of +/-13.37% on earnings, Twitter (TWTR), First Solar (FSLR), Nutrisystem (NTRI), iRobot (IRBT), Pandora (P), and Tableau Software (DATA).
For our most actionable earnings analysis, sign up for a Bespoke Institutional two-week free trial today.