Fixed Income Weekly – 8/22/18
Searching for ways to better understand the fixed income space or looking for actionable ideals in this asset class? Bespoke’s Fixed Income Weekly provides an update on rates and credit every Wednesday. We start off with a fresh piece of analysis driven by what’s in the headlines or driving the market in a given week. We then provide charts of how US Treasury futures and rates are trading, before moving on to a summary of recent fixed income ETF performance, short-term interest rates including money market funds, and a trade idea. We summarize changes and recent developments for a variety of yield curves (UST, bund, Eurodollar, US breakeven inflation and Bespoke’s Global Yield Curve) before finishing with a review of recent UST yield curve changes, spread changes for major credit products and international bonds, and 1 year return profiles for a cross section of the fixed income world.
We assess which emerging market economies have the most risky profiles based on external debt growth and reserve adequacy.

Our Fixed Income Weekly helps investors stay on top of fixed income markets and gain new perspective on the developments in interest rates. You can sign up for a Bespoke research trial below to see this week’s report and everything else Bespoke publishes free for the next two weeks!
Click here and start a 14-day free trial to Bespoke Institutional to see our newest Fixed Income Weekly now!
Bespoke’s Global Macro Dashboard — 8/22/18
Bespoke’s Global Macro Dashboard is a high-level summary of 22 major economies from around the world. For each country, we provide charts of local equity market prices, relative performance versus global equities, price to earnings ratios, dividend yields, economic growth, unemployment, retail sales and industrial production growth, inflation, money supply, spot FX performance versus the dollar, policy rate, and ten year local government bond yield interest rates. The report is intended as a tool for both reference and idea generation. It’s clients’ first stop for basic background info on how a given economy is performing, and what issues are driving the narrative for that economy. The dashboard helps you get up to speed on and keep track of the basics for the most important economies around the world, informing starting points for further research and risk management. It’s published weekly every Wednesday at the Bespoke Institutional membership level.
You can access our Global Macro Dashboard by starting a 14-day free trial to Bespoke Institutional now!

The Closer — Banks Cheap, Going Fishing In Europe — 8/21/18
Log-in here if you’re a member with access to the Closer.
Looking for deeper insight on markets? In tonight’s Closer sent to Bespoke Institutional clients, we make the case that bank stocks are cheap relative to the broader market based on macro factors. We also identify specific banks that have attractive chart patterns. We follow that analysis up with a look at index earnings growth versus valuation, and identify European stocks with strong growth but low valuation.

See today’s post-market Closer and everything else Bespoke publishes by starting a 14-day free trial to Bespoke Institutional today!
Best and Worst S&P 500 Stocks on the Road to Nowhere
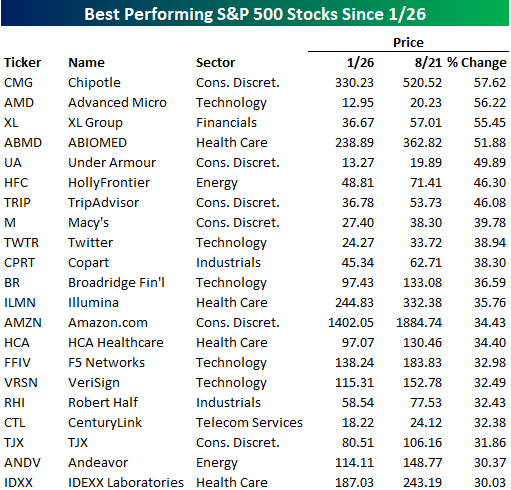
Many are out making a big deal about the fact that the S&P 500 traded back to a new all-time high today, but the reality is that the S&P 500 has been ‘dead money’ for nearly seven months now. Along with the index itself being unchanged since late January, a very slight majority of stocks (256) in the S&P are lower now than they were on 1/26, and overall, the average change of the 500 individual stocks in the index since then is a decline of 0.35%. At the extremes, though, there have been some big winners and losers. We’ll start with the good news.
The table below lists the 21 stocks in the S&P 500 that have gained more than 30% since the S&P 500’s 1/26 closing high. Topping the list of biggest winners is Chipotle (CMG), which has been on quite a run, gaining more than 57% even after taking a skid last week on reports of further health issues with customers eating their food. Right behind Chipotle, although it may not want to get too close, is AMD, which is up 56%. Behind these two leaders, two other stocks (XL Group and ABIOMED) are up over 50%. Other notable names on the list of biggest winners include Under Armour (UA) and Twitter (TWTR). Also worth pointing out is that besides Amazon.com (AMZN), none of the other FAANG stocks made the list. So much for the argument that FAANG stocks are the only ones going up.
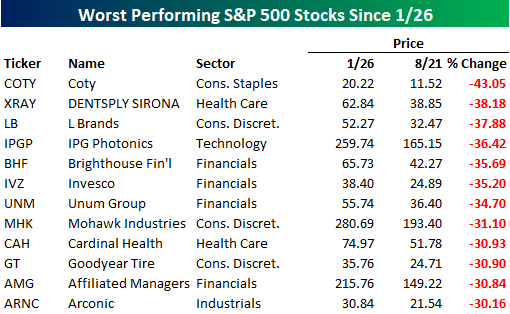
While there have been 21 S&P 500 stocks that have rallied 30% or more since 1/26, 12 stocks in the S&P 500 have lost more than 30% during that span. The biggest loser of them all has been Coty (COTY), which is down over 43%, including a drop of 7% today. L Brands (LB) is another big loser as it has seen its stock fall more than 37% since 1/26. Thankfully for most investors, there are not a lot of high-profile names on this list, but if you’re a holder of any of these names, it has definitely been a frustrating six months.
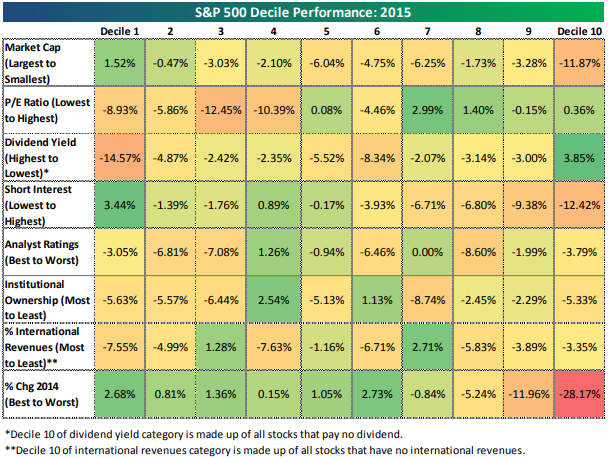
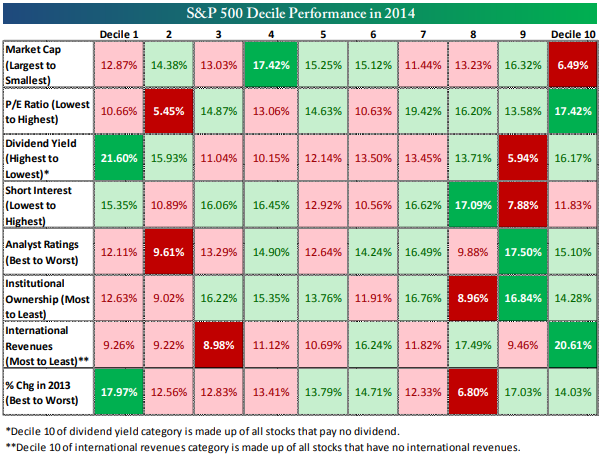
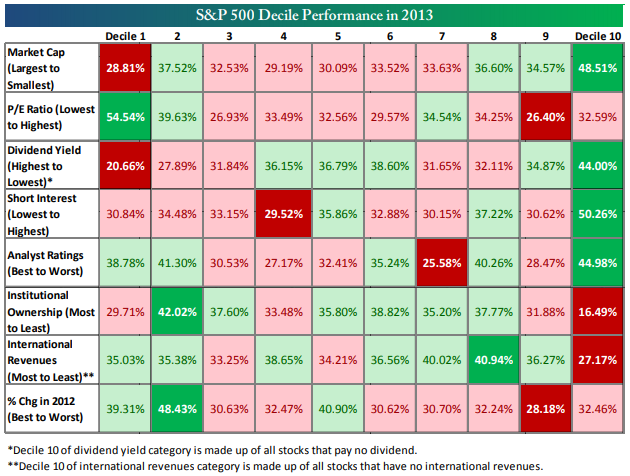
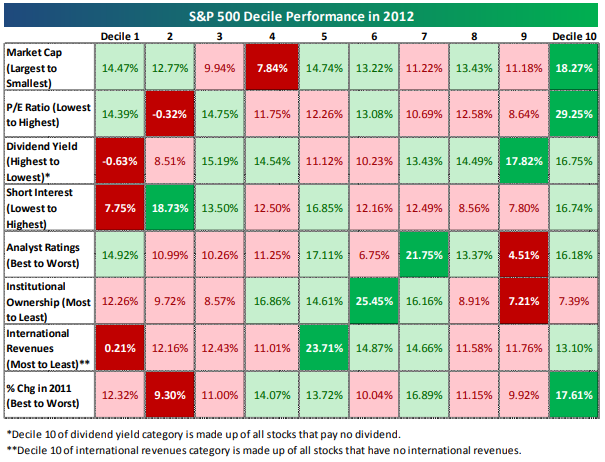
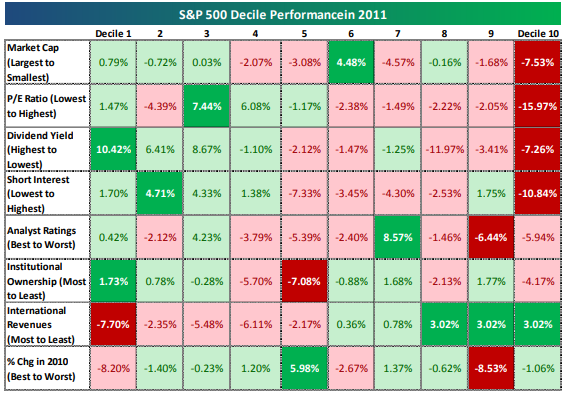
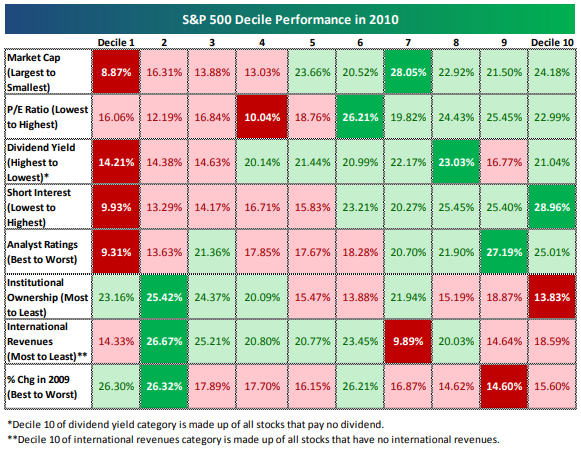
S&P 500 Annual Decile Analysis
2017

2016

2015
2014
2013
2012
2011
2010
2009

COTD: Hurricane-Force Seasonal Tailwinds
Bespoke Stock Scores — 8/21/18
The Closer — Spooz Steady Intraday, Turkish Trade Math — 8/17/18
Log-in here if you’re a member with access to the Closer.
Looking for deeper insight on markets? In tonight’s Closer sent to Bespoke Institutional clients, we take a look at the change in intraday trading patterns since the stock market began to rally consistently off Q1 lows. We also review Turkey’s current account and what it could take to close its enormous deficit.
See today’s post-market Closer and everything else Bespoke publishes by starting a 14-day free trial to Bespoke Institutional today!
Consumer Staples Leading
The Consumer Staples sector has been on fire lately. As shown in the snapshot from our Trend Analyzer tool below, Staples is up more than any other sector over the last week (+3.29%), and it’s now trading in extreme overbought territory at two standard deviations above its 50-day moving average.

Back in early May, the Consumer Staples sector was down more than 14% year-to-date, but it has gained back nearly all of its losses. As shown below, Staples is now down just 3.9% year-to-date. Unfortunately, Staples is still well behind its counterpart — Consumer Discretionary — which is up 14.7% on the year.

As you can see in the chart above, the first four months of the year were horrific for Consumer Staples. But since the sector hit its low for the year at the start of May, it’s been a different story.
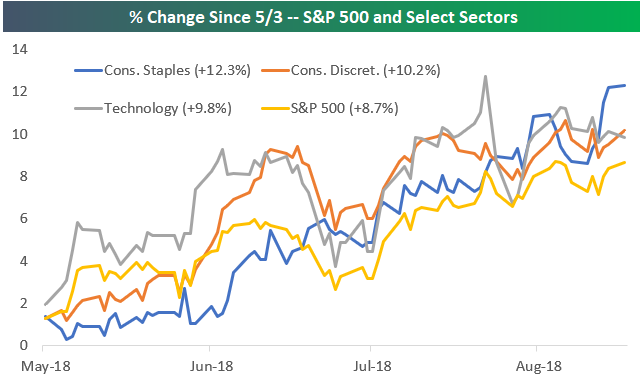
Since May 3rd, Consumer Staples is actually outperforming the S&P 500, Consumer Discretionary, and even Technology:
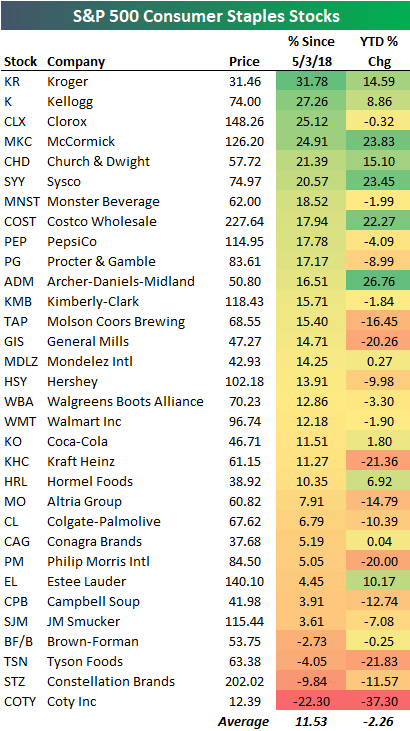
Below is a table showing the performance of S&P 500 Consumer Staples stocks on a year-to-date basis and since the sector’s May 3rd low. As shown, all but four stocks in the sector are up since May 3rd, while six are up more than 20%. Grocery store chain Kroger (KR) is up the most since May 3rd with a gain of 31.78%, followed by Kellogg (K), Clorox (CLX), and McCormick (MKC) all with gains of more than 24%.
The Real Longest Bull Market Ever
We’ve read or heard a number of erroneous reports lately claiming that we’re about to set the record for the longest S&P 500 bull market on record. Since the S&P 500 made its last bull market closing high on January 26th, the bull market actually stopped aging on that date, and we’ve essentially been in limbo since. (You can read more on this topic in this post we published late last week.)
But while the bull market for the S&P 500 really isn’t the longest on record, another major US index just set the record for its longest bull market ever.
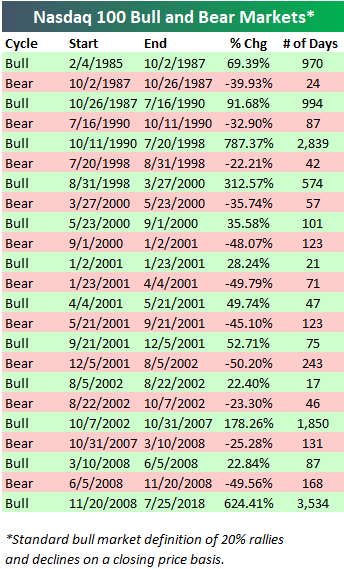
The Nasdaq 100’s current bull market has lasted 3,534 calendar days (from 11/20/08 through its most recent high on 7/25/18). As shown in the chart below, that’s easily its longest on record since the index began in 1985.
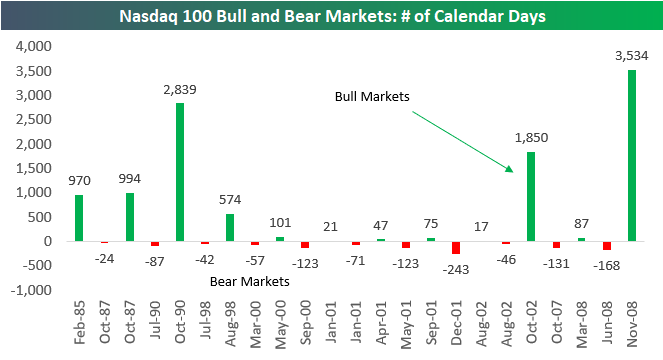
While the current Nasdaq 100 bull is easily the longest on record, it’s still not the strongest. The 1990s bull that ran from October 1990 through July 1998 saw the index gain 787.37% before it eventually fell into a short bear market in July/August ’98. The current bull for the Nasdaq has only seen a gain of 624.41%.
In addition to being in its longest bull market ever, the Nasdaq 100 is also in the midst of another record streak.
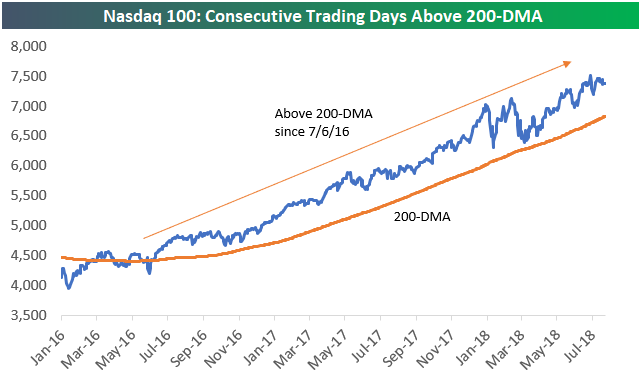
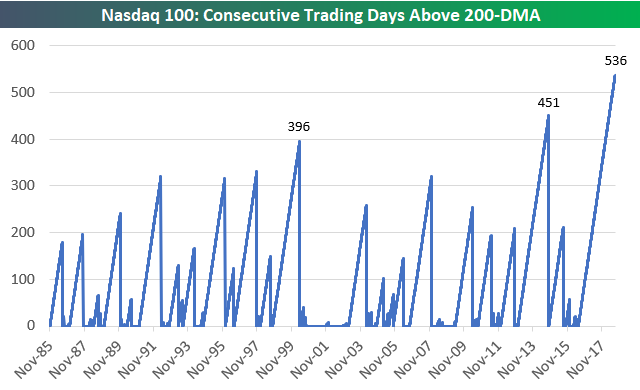
As shown below, the index has now closed above its 200-day moving average for a record 536 trading days dating back to July 6th, 2016. That’s well above the 396-trading day streak that ended in May 2000 and the 451-trading day streak that ended in October 2014.
See Bespoke’s most actionable stock market research with a Bespoke Premium free trial.