3-Month Seasonal Headwind for S&P 500
Our Stock Seasonality Tool is one of many interactive features that are part of our premium membership services. The tool allows users to perform a limitless amount of searches for seasonality trends surrounding US and global indices, ETFs, and individual stocks.
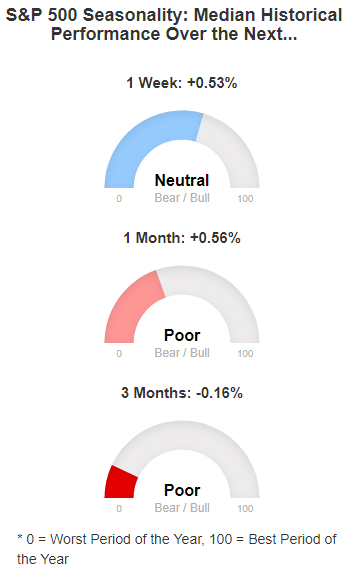
One part of the tool simply shows how the S&P 500 has historically performed over the next week, month, and three months from whatever the date is when you open the tool. When we opened the tool today, we noticed that seasonality trends for the next month and three months are pretty dreadful.
Below is a snapshot of the tool from today showing the S&P 500’s median performance over the next week, month, and three months using the last 10 years as our data set (with July 17th close as the starting point).
As shown, the S&P has seen a median gain of 0.56% over the next month, which is actually relatively weak compared to all other one-month periods throughout the calendar year.
The three-month median change is where things look really weak for the stock market. Over the last 10 years, the S&P 500 has seen a median decline of 0.16% during the three-month period from July 17th through October 17th.
Seasonals are definitely not working in the market’s favor in the near term.
Start a two-week free trial to Bespoke Premium to unlock access to our popular Stock Seasonality Tool.
Gas Prices Following the Seasonal Trend
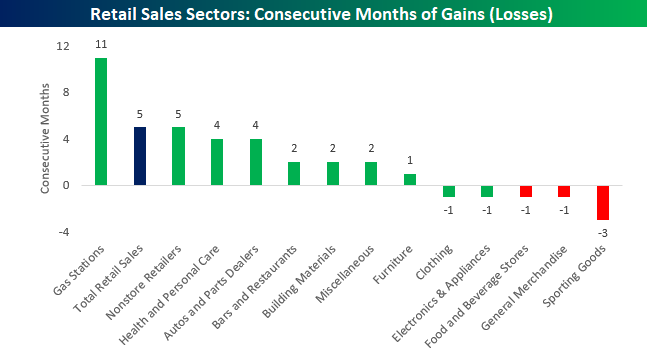
With prices in many areas of the country well over $3 per gallon, gas prices are a topic we’ve heard a lot of complaining about recently. There’s absolutely no denying the fact that prices have been on the rise. One has to look no further than Monday’s Retail Sales report for June which showed that sales at gas stations rose for their record 11th straight month. While sales at Gas Stations have risen for nearly a year straight, no other category, not even online, has seen more than five consecutive months of sales gains.
So will sales at Gas Stations see the current streak of sales gains reach a full year? Based on seasonal trends, it’s going to be tough. The chart below compares the changes in gas prices so far this year to the average “intra-year” pattern going back to 2005. So far in 2018, the pattern of prices has been tracking the average pretty closely, and if that continues to be the case, it would suggest that prices would continue to drift lower or in a sideways range for the rest of the summer, and then steadily slump from Labor Day through year-end.

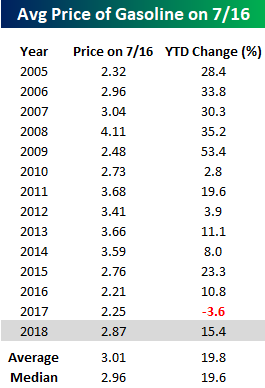
Another way to look at gas prices this year is to compare current levels and the YTD change to where prices were in prior years. As of Monday, the national average price of a gallon of gas was $2.87. While that is higher than where prices were on 7/16 in 2015, 2016, and 2017, the average price of a gallon of gas on 7/16 since 2005 is just over $3, and the median is $2.96. Finally, in terms of the YTD change, this year’s increase of 15.4% is more than four percentage points below the average and median change for all years since 2005.
Little Change in Homebuilder Sentiment
The NAHB Homebuilder Sentiment index was just released earlier and was unchanged from last month, coming in at a level of 68 compared to expectations of 69.
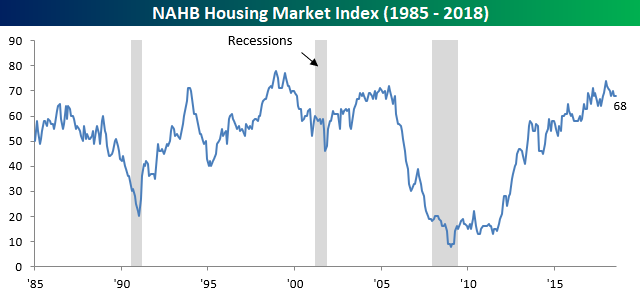
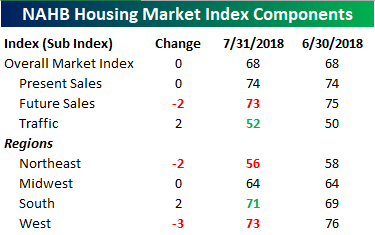
Looking at the break down of this month’s report, there wasn’t much in the way of major moves. The biggest swing was a three-point decline in sentiment for homebuilders in the West.
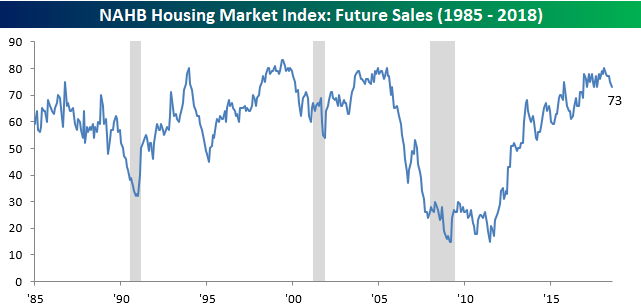
One chart we wanted to highlight was Future Sales, which fell two points. A two-point m/m move is not really anything to get excited about, but it is now back down to its lowest level since the 2016 election.
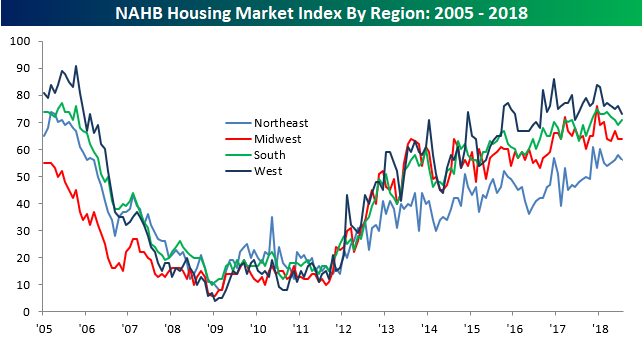
On a regional basis, sentiment is basically following the national trend where sentiment peaked towards the end of 2017 and has been drifting lower ever since.
Bespoke Stock Scores — 7/17/18
The Closer — Empire Wobbles, Brazil Stumbles, Small Cap Losses — 7/16/18
Log-in here if you’re a member with access to the Closer.
Looking for deeper insight on markets? In tonight’s Closer sent to Bespoke Institutional clients, we take a look at today’s Empire Manufacturing data, Brazilian growth, and the current distribution of loss-making firms in the small cap universe.

See today’s post-market Closer and everything else Bespoke publishes by starting a 14-day free trial to Bespoke Institutional today!
Chart of the Day: Netflix (NFLX) Earnings After the Close
Retail Shining
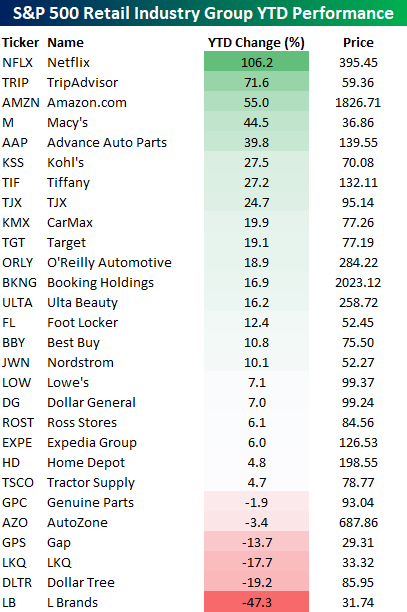
On a day where we saw a relatively strong Retail Sales report for the month of June, it shouldn’t come as too much of a surprise that Retailing is the best-performing Industry Group YTD and also trading the most above its 200-DMA. Given the recent strength, we wanted to quickly look into which stocks in the group have been doing the best this year. As regular readers are aware, non-traditional stocks like Amazon.com (AMZN) and Netflix (NFLX) have been among the group’s strongest performers over the last year or more, and while that is still the case now, we are beginning to see more traditional retailers show up near the top of the list.
YTD, all three of the group’s top performing stocks – NFLX, TRIP, and AMZN- are up over 50%. Right behind those three stocks, though, the next seven top-performers are all traditional retailers. In addition to the top ten performing stocks in the group, another six stocks are up over 10% YTD. The fact that more than half of the group’s components are up over 10% when the S&P 500 is up less than 5% on the year is pretty impressive. While many traditional retailers have seen improved performance this year, the laggards in the group are also traditional retailers, including L Brands (LB), Dollar Tree (DLTR) LKQ (LKQ), and Gap (GPS).
Retail Sales Inline, But Big Upside Revisions
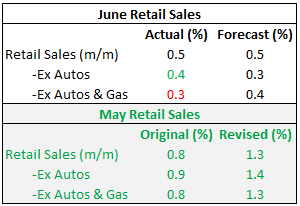
When it comes to the June Retail Sales report, it has historically been pretty weak relative to expectations. Since the expansion began in 2009, there have only been three better than expected June reports out of nine. Even worse, heading into today’s report, five out of the last six June Retail Sales reports were weaker than expected. Based on that record, the fact that today’s report for June was inline with expectations at the headline level is almost considered a win! Ex Autos, the report was even stronger than expected, while Ex Autos & Gas, it was weaker. So there was a little of everything. What was really impressive about the June report was the half percentage point upside revisions to May (see table to right). The last time the report had a larger upside revision to the initial report was almost a year ago last August.
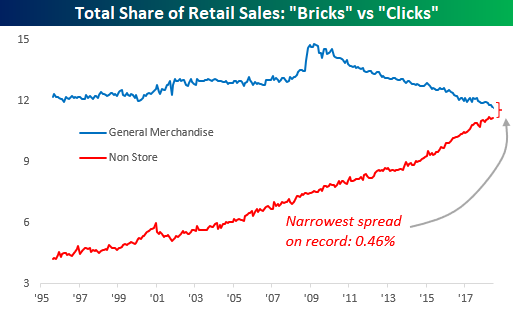
Another interesting trend involving this month’s report was the ongoing shift from “Bricks to Clicks” and “Death By Amazon” which we have been highlighting for years now. Following June’s report, we are increasingly reaching the point where Online’s share of total sales will overtake the General Merchandise category, as the spread of less than 0.5% between the two sector’s shares was the narrowest on record. That’s quite a difference from 20 years ago when General Merchandise was at 12% and Online was under 5%.
In a just-published report for Premium and Institutional clients, we provided a complete analysis of this month’s Retail Sales reports and how recent shifts have impacted overall trends. To unlock this report, sign up for a Bespoke Premium trial membership now!
Trend Analysis of the Dow Jones Industrial Average
Below is a snapshot of where the 30 Dow Jones Industrial Average stocks stand ahead of today’s open. Using our Trend Analyzer, we’ve sorted the stocks by distance from 50-day moving average. Microsoft (MSFT) is currently the farthest above its 50-day at +6.01%, followed by Walt Disney (DIS), Nike (NKE), Verizon (VZ), and Visa (V).
Two-thirds of stocks in the Dow are above their 50-DMAs, while a third are below them. Caterpillar (CAT) is currently the farthest below its 50-day at -4.93%, while Cisco (CSCO) is not far behind at -4.49%. Goldman Sachs (GS), JP Morgan (JPM), McDonald’s (MCD), and Intel (INTC) are all more than 2% below their 50-DMAs.
Looking at the “trading range” section of our Trend Analyzer, MSFT, DIS, V, and WMT are the most overbought relative to their normal trading ranges. Even though WMT is down 11.19% YTD, it has seen a big move higher within its downtrend channel over the past week, leaving it more than two standard deviations above its 50-day moving average. When a stock in a long-term downtrend gets this overbought, we give it a “bad” timing score. (Read more about our proprietary Trend and Timing scores at the bottom of our Trend Analyzer page.)
In terms of year-to-date performance, three stocks in the Dow are up more than 20% YTD — Microsoft (MSFT), Nike (NKE), and Visa (V). Notably, there are six Dow stocks that are down more than 10% YTD as well — Procter & Gamble (PG), Wal-Mart (WMT), 3M (MMM), General Electric (GE), Goldman Sachs (GS), and Caterpillar (CAT). GE is down the most YTD at -20.40%.
You can build your own portfolios of stocks and ETFs to monitor with our Trend Analyzer tool. For access, start a two-week free trial to Bespoke Premium or Bespoke Institutional.

Number of Groups Above 200-DMA on the Rise
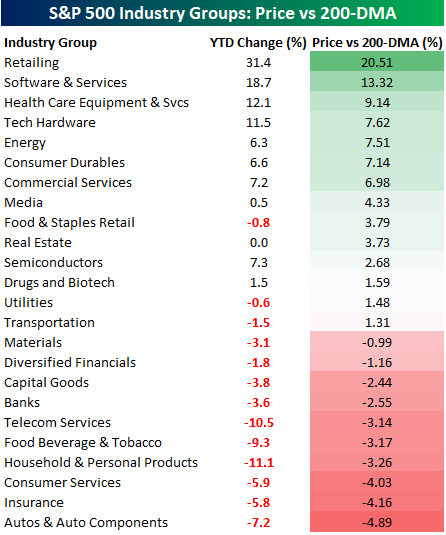
When it comes to measuring long-term directional trends, one often-used method is to see whether price is trading above or below the 200-day moving average. The chart below tracks the percentage of S&P 500 Industry Groups trading above their 200-DMAs over the last few years. After a relatively sharp decline off of highs earlier this year, we’ve seen a strong rebound in this reading. In fact, just Friday, the percentage topped 80% for the first time since late February.
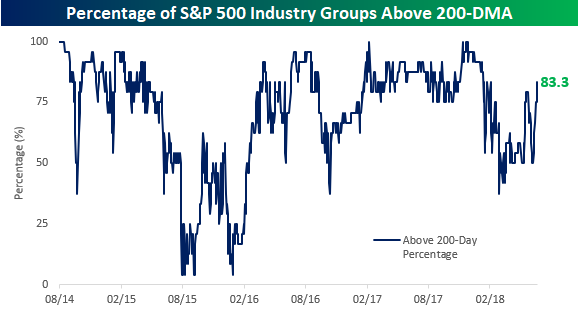
The table below lists each of the 24 S&P 500 Industry groups along with their YTD percent change as well as where each one is trading relative to its 200-DMA. Topping the list as of Friday’s close is Retailing, which is up over 30% on the year and is now more than 20% above its 200-DMA. Besides Retailing, the only other Industry Group more than 10% above its 200-DMA is Software & Services (13.32%), and the only other Industry Groups up over 10% on the year are Software & Services, Health Care Equipment & Svcs, and Tech Hardware. To the downside, not a single Industry Group is currently trading more than 5% below its 200-DMA, and only two are down more than 10% YTD (Household & Personal Products and Telecom Services). That compares to seven Industry Groups that are trading above their 200-DMAs.