Tariffs, Tariffs, Tariffs!
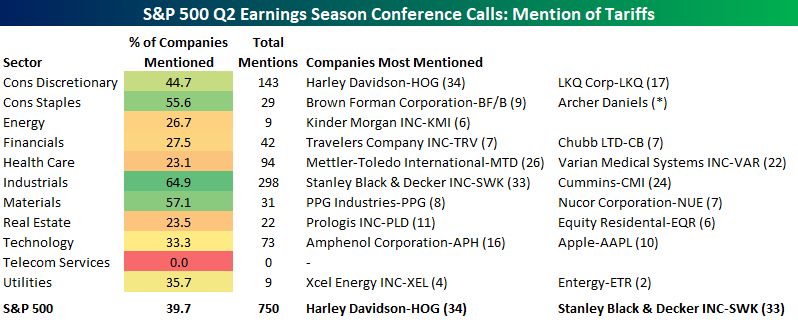
As mentioned earlier in a tweet about the ISM Manufacturing report for July, talk and concern about tariffs is just about everywhere in the manufacturing sector. In addition to the ISM Manufacturing report, we’ve also seen a major uptick in tariff conversation during the latest round of Q2 earnings conference calls. We’ve been tracking all of the conference call transcripts of companies in the S&P 500 that have reported earnings so far and with just about half of all companies reporting, the percentage of conference calls where tariffs have been brought up has more than doubled relative to Q1 (39.8% vs 16.6%). For the entire Q1 earnings season, the word “tariff” came up 290 different times in S&P 500 conference calls (in some calls, the word came up more than once), while during this earnings season, the term has already come up 609 different times. Remember, we’re only halfway through this earnings season.
The table below breaks down the percentage of companies that have mentioned tariffs in their Q2 conference calls by sector. For each sector, we have also included the conference calls where the term has come up the most frequently. Three sectors have seen “tariff” mentioned in half of the conference calls (Industrials, Materials, and Consumer Staples), and all three sectors have lagged the market considerably this year. Sectors where tariffs have been least mentioned are Telecom Services, Health Care, and Real Estate. In terms of individual companies, given all the headlines Harley Davidson (HOG) created when it was targeted by the President for saying it would move production outside of the US in response to tariffs, the fact that tariffs were mentioned the most on its conference call isn’t much of a surprise. Right behind HOG, Stanley Black & Decker (SWK), and Mettler-Toledo (MTD) round out the top three.
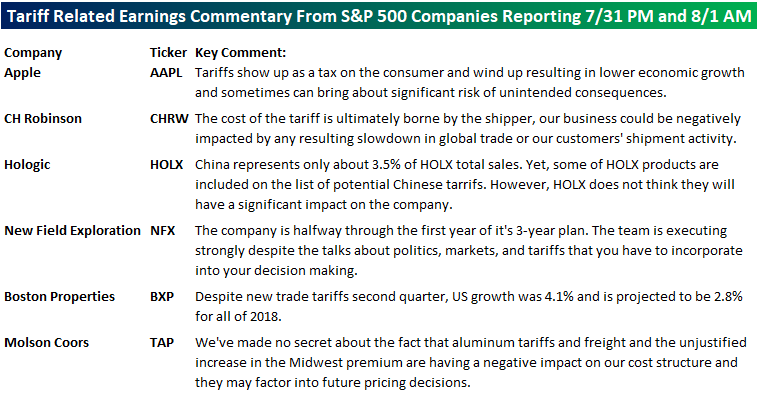
Finally, we also wanted to highlight a few excerpts from conference calls that have taken place between the close on Tuesday and the open Wednesday. Apple (AAPL) is the most notable of the six companies mentioned and gets right down to the bottom line with its statement that “Tariffs show up as a tax on the consumer…and sometimes can bring about significant risk of unintended consequences.” We couldn’t have said it better ourselves!
ISM Manufacturing Drifts Lower
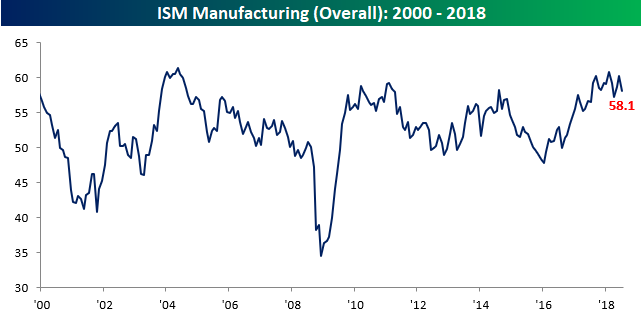
Activity in the Manufacturing sector was slightly weaker than expected in July but still remained at strong levels. According to ISM, the Manufacturing PMI index fell from 60.2 down to 58.1 compared to expectations for a reading of 59.4. Putting this level into perspective, the Manufacturing PMI index is less than three points from its multi-year high of 60.8 from February.
Breadth in this month’s report wasn’t particularly strong as the vast majority of components showed declines relative to June with the biggest drops coming in Supplier Deliveries, Backlog Orders, and Imports, while Business Inventories and Employment were the only two categories that increased on a m/m basis. On a y/y basis, breadth was better as the number of components rising and falling was equally split at five.

One component we wanted to highlight specifically is New Orders. Looking at the chart below, this category is definitely trending lower from its high of 67.4 in December. At the same time, though, this component has been at or above 60 for 15 straight months now, so it can’t stay there forever. Going back to 1948, there have only been two other periods where this component was at 60 or above for 15 or more months. The first spanned the period from September 1954 through January 1956 (17 months), while the second period spanned 19 months from December 1971 through June 1973.

Fixed Income Weekly – 8/1/18
Searching for ways to better understand the fixed income space or looking for actionable ideals in this asset class? Bespoke’s Fixed Income Weekly provides an update on rates and credit every Wednesday. We start off with a fresh piece of analysis driven by what’s in the headlines or driving the market in a given week. We then provide charts of how US Treasury futures and rates are trading, before moving on to a summary of recent fixed income ETF performance, short-term interest rates including money market funds, and a trade idea. We summarize changes and recent developments for a variety of yield curves (UST, bund, Eurodollar, US breakeven inflation and Bespoke’s Global Yield Curve) before finishing with a review of recent UST yield curve changes, spread changes for major credit products and international bonds, and 1 year return profiles for a cross section of the fixed income world.
The Eurodollar futures curve (linked to LIBOR) is pancake flat and even partially inverted in some out-years. We review the even more skeptical views of the Eurodollar options market.

Our Fixed Income Weekly helps investors stay on top of fixed income markets and gain new perspective on the developments in interest rates. You can sign up for a Bespoke research trial below to see this week’s report and everything else Bespoke publishes free for the next two weeks!
Click here and start a 14-day free trial to Bespoke Institutional to see our newest Fixed Income Weekly now!
Best Year in Over a Decade For Ford F-Series Trucks
Ford released July sales figures earlier today and while the overall results were a bit weaker than expected, sales trends for its F-Series trucks remained healthy. Sales of pickup trucks (specifically at Ford) are often a sign of strength or weakness in the small business and construction sectors, and based on these numbers from Ford, the small business sector still looks strong. Ford reported sales of 70,949 F-Series trucks, which marks the strongest July sales total since 2005 and the fourth strongest July since 1996. Another thing to keep in mind regarding July’s sales totals is that the company mentioned in its call that a fire at one of its supplier plants actually hampered sales.
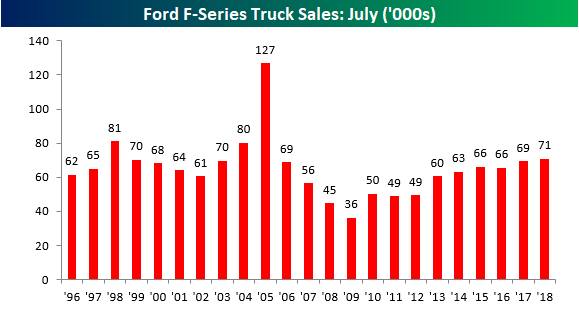
Keep in mind that the above sales totals are unadjusted so they don’t take the number of selling days, which are generally auto industry parlance for days in a month that aren’t Sundays or a national holiday, into account. So while selling days can vary from month to month (in July 2017 there were 25 compared to 24 this year), looking at YTD sales totals provides a more apples to apples comparison. To that end, the chart below shows YTD sales totals for F-Series trucks through July for every year since 1996. Through 7/31 of this year, total sales of F-Series trucks were 522,087. That’s the highest YTD sales total since 2005 (535K) and the third highest sales total since 1996.

Bespoke’s Global Macro Dashboard — 8/1/18
Bespoke’s Global Macro Dashboard is a high-level summary of 22 major economies from around the world. For each country, we provide charts of local equity market prices, relative performance versus global equities, price to earnings ratios, dividend yields, economic growth, unemployment, retail sales and industrial production growth, inflation, money supply, spot FX performance versus the dollar, policy rate, and ten year local government bond yield interest rates. The report is intended as a tool for both reference and idea generation. It’s clients’ first stop for basic background info on how a given economy is performing, and what issues are driving the narrative for that economy. The dashboard helps you get up to speed on and keep track of the basics for the most important economies around the world, informing starting points for further research and risk management. It’s published weekly every Wednesday at the Bespoke Institutional membership level.
You can access our Global Macro Dashboard by starting a 14-day free trial to Bespoke Institutional now!

The Closer — Credit Rally, STIRs Soar, Wages Accelerate, Inflation Expectations Up — 7/31/18
Log-in here if you’re a member with access to the Closer.
Looking for deeper insight on markets? In tonight’s Closer sent to Bespoke Institutional clients, we review a credit rally, energy equity outperformance versus crude, and the historically long stretch without an oversold reading for 2 year yields. We also dive into economic data: personal income & spending numbers, wages, and a few specific indicators from today’s Conference Board Consumer Confidence index.

See today’s post-market Closer and everything else Bespoke publishes by starting a 14-day free trial to Bespoke Institutional today!
New High For High Yield Debt
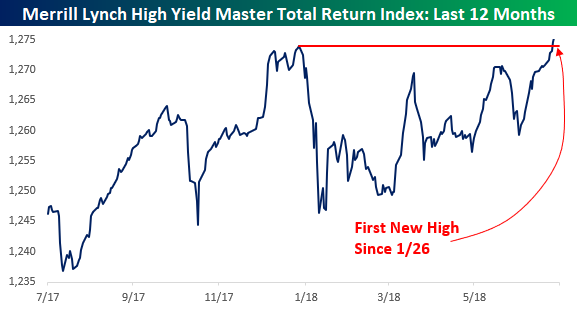
As we’ve seen some of the highest flying stocks in the market pull back in the last couple of days, we haven’t seen much of an uptick in other market measures of risk. Since last Wednesday’s close (which was the day Facebook reported), the VIX has only risen one point from 12.29 to 13.29. That hardly signals a white-knuckle feeling on the part of investors. Similarly, the high yield market has seen virtually no reaction. Since last Wednesday, high yield spreads have actually declined slightly. Granted, most of these stocks getting hit so hard have no debt, so they don’t have much of a direct impact on the debt markets, but if investors are becoming more risk averse by lightening up on high fliers, one would think that there would at least be some sort of indirect impact.
Not only has high yield been relatively unscathed, but the sector has made a new high on a total return basis over the last few days, and that’s something we haven’t been able to say since 1/26, which was also the last time the S&P 500 closed at a new high. High yield debt is just one of many internal indicators we track to gauge the underlying trend and health of the market. In our newest Bespoke Report, we discussed a variety of other indicators and what kind of signals they were giving. To read our analysis, you can start a two-week free trial to Bespoke Premium today!
Bespoke Market Calendar — August 2018
Please click the image below to view our August 2018 market calendar. This calendar includes the S&P 500’s average percentage change and average intraday chart pattern for each trading day during the upcoming month. It also includes market holidays and options expiration dates plus the dates of key economic indicator releases.

B.I.G. Tips – August 2018 Seasonality
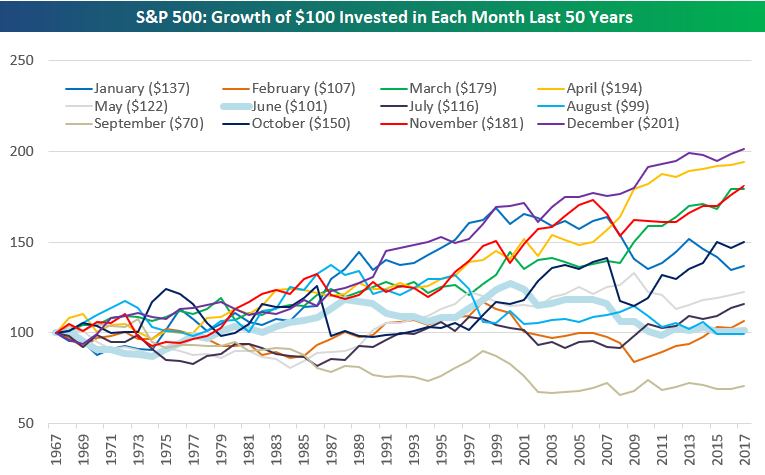
The chart below highlights the growth of $100 invested in the S&P 500 by month starting 50 years ago.
Had you only owned the S&P 500 during the month of August over the last 50 years, your $100 would now be $99 (for a decline of 1%). That’s not very good over a 50-year period! Historically, December has been the strongest month using this strategy, while the weakest month has been September, where $100 would now be worth just $70. Unfortunately, we have the two weakest months on the calendar coming up now that July is ending.
At the start of each month, we publish an in-depth report that analyzes seasonality trends for the US stock market, international markets, sectors, and individual stocks. To see which areas of the equity universe typically do the best and worst in the month of August, check out our just-published August Seasonality report.
This one is a must-read. To see it, sign up for a Bespoke Premium membership now!
B.I.G. Tips – Fed Days August 2018
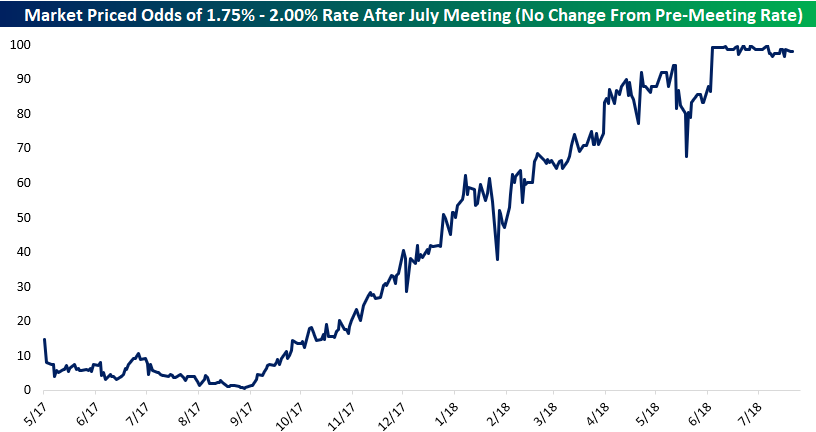
There have been four Fed Days so far this year (1/31, 3/21, 5/2, 6/13), and the Fed held the Fed Funds Rate steady on two of them (1/31 and 5/2) and hiked on two (3/21 and 6/13).
The Fed Funds Rate currently stands at 1.75%-2.00% (roughly 1.91% effective), and as shown below, the odds that the Fed makes no change with tomorrow’s policy release stand at roughly 98%. Earlier this year, odds for this outcome (driven mostly by lower odds of a June hike) fell as low as 68%, driven by concerns over Italian debt selling off, but that was temporary.
Ahead of every Fed Day, we publish a report that looks at the odds of future Fed rate hikes (or cuts), and we also analyze how the US stock market typically performs in response to Fed policy changes. We’ve just published our newest report ahead of tomorrow’s policy announcement.
This one is a must-read. To see it, sign up for a Bespoke Premium membership now!