Dissecting the Trading Day
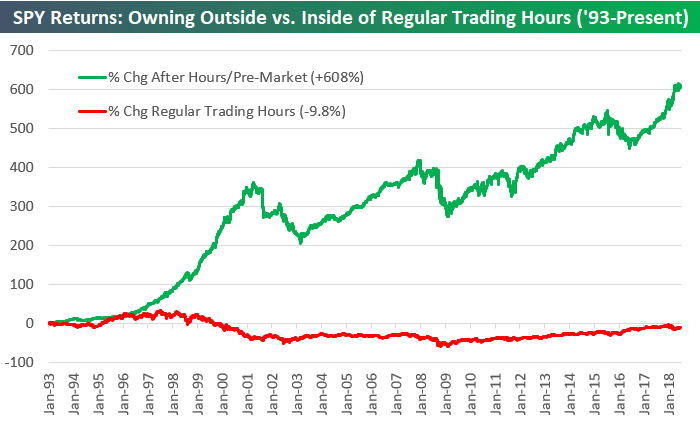
Back in January, we published a Chart of the Day (you can read it here) for Bespoke members that raised quite a few eyebrows. Investors just couldn’t get over one of our findings. What was it? It was that since 1993 when the S&P 500 tracking SPY ETF began trading, ALL of its share price gain has come from moves outside of regular trading hours. That’s right. Had you bought SPY at the open of every trading day since 1993 and sold it at the close that same trading day, your cumulative return over the entire period would be negative (-9.8% through the end of this July). On the other hand, had you bought SPY at the close of every trading day and sold it at the open the next morning, your cumulative return would be +608%. Keep in mind that this doesn’t take dividends into account — it’s only looking at price change — but adding in dividends would actually boost the performance of the “after hours” strategy.
Below is a chart highlighting the strategy’s performance over the years. You can see that the returns diverged significantly in the late 1990s towards the end of the Dot Com bubble. From 1997 through the peak in 2000, investors were consistently bidding up the S&P after hours only to see gains wiped out during the trading day. Then during the bear market that followed the Dot Com peak, the “regular trading hours” strategy plummeted to -50%, and since then it still hasn’t been able to work its way back into positive territory.
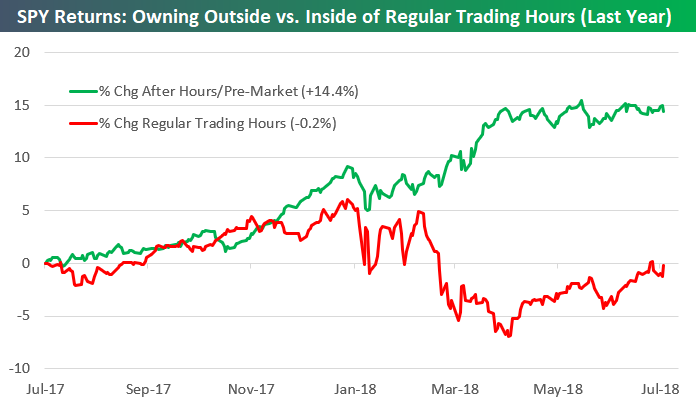
Looking at the strategy over a shorter time frame tells you a lot about the current market environment. Below is a chart showing the performance of the “after hours” versus “regular hours” strategy over the last year.
As shown, had you bought SPY at the close every trading day and sold it at the open the next trading day, you’d be up 14.4% over the last year. Had you bought at the open every trading day and sold at the close, you’d be down 0.2%. This means that over the last year as well, all of SPY’s gains have come outside of regular trading hours.
From last July through the January highs, both strategies were positive, but during the correction from January through April, we saw investors unload SPY during regular trading hours, while the after-hours strategy remained relatively stable. Since the April lows for SPY, we’ve seen a different pattern emerge. We’ve actually seen SPY trade flat outside of regular trading hours, but it has been bid up during regular trading hours. This is much more bullish than if the reverse were true. We’d prefer to see a market where investors are actively buying throughout the trading day versus a market that is opening higher and then getting sold off during the day.
For more analysis like this, become a Bespoke Premium member today.
Earnings and Guidance Trends This Season
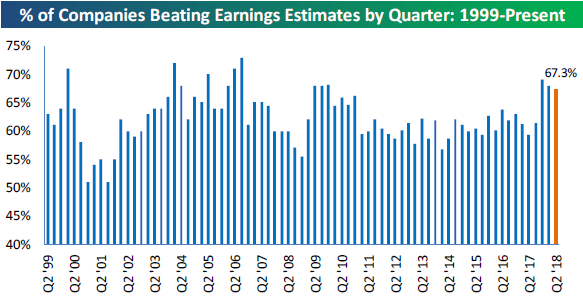
More than 1,500 stocks have now reported Q2 earnings, and as shown below, the percentage of them that have beaten consensus EPS estimates is down slightly this quarter versus the last two quarters.
Forward guidance numbers have been more positive than negative thus far. The chart below shows the spread between the percentage of companies raising guidance minus lowering guidance each quarter going back to 2001. After years of companies generally guiding more negative than positive from 2011 through 2016, sentiment has shifted to being more optimistic since the start of 2017.
While still positive this season, the guidance spread has dipped quite a bit versus the past two quarters, and we will be watching this reading closely over the final two weeks of earnings season to make sure it stays positive.

Triple Plays
An earnings “triple play” is a term we created back in the mid-2000s for a company that beats earnings estimates, beats revenue estimates, and raises guidance on its quarterly earnings report. We consider “triple plays” to be the cream of the crop during earnings season, and we track them closely day in and day out to look for new long ideas.
This earnings season there have been nearly 100 “triple plays” so far, and Bespoke members can see a regularly updated list of them at our Triple Plays page.
On Friday, we identified the triple plays from this season that also have the most attractive chart patterns at the moment. Twenty-three stocks made the cut, and we think this list is a good starting point for investors on the prowl for new ideas!
If you want to see the list of 23 triple plays that we think have the most attractive chart patterns, gain access by taking advantage of our new member special below!
Bespoke Brunch Reads: 8/5/18
Welcome to Bespoke Brunch Reads — a linkfest of the favorite things we read over the past week. The links are mostly market related, but there are some other interesting subjects covered as well. We hope you enjoy the food for thought as a supplement to the research we provide you during the week.
Real Estate
Hamptons property sales slow as caution spreads to the wealthy by Ben Foldy (CNBC/FT)
Given state and local tax deduction changes and extremely high valuations for high-end real estate, the Tristate Area’s highest price getaway is under pressure. [Link]
The End of the Global Housing Boom (Bloomberg)
Megacity housing around the world is taking a pause after years of torrid price gains that have pushed valuations and debt levels to extremes. [Link; soft paywall]
Social Media Madness
4,925 Tweets: Elon Musk’s Twitter Habit, Dissected (WSJ)
A quantitative review of the Twitter feed of the most controversial CEO in the country. [Link; paywall]
For Tesla’s Elon Musk, Twitter Is Sword Against Short Sellers by Susan Pulliam and Samarth Bansal (WSJ)
A qualitative review of the Twitter feed of the most controversial CEO in the country. [Link; paywall]
Inside the Always Nasty, Frequently Sexist, and Often Litigious World of Financial Twitter by Michelle Celarier (Institutional Investor)
A skeptical look at the world of Finance Twitter, the rough-and-tumble online world that is replacing trading floors. [Link]
Removing Bad Actors on Facebook (Facebook)
Part of Facebook’s evolving approach to self-regulation, the social network is bringing down the hammer on accounts that are misrepresenting themselves. [Link]
Drinking
America’s Long Love Affair With Beer Is on the Rocks by Saabira Chaudhuri and Annie Gasparro (WSJ)
Last year was the first time that volumes in the alcohol market saw beer become less popular than the duo of wine and cocktails. [Link; paywall]
Driving
DUI arrests in South Florida plummet. Uber, Lyft, millennials among the reasons why by Charles Rabin (Miami Herald)
Thanks to a combination of factors, including most importantly ride sharing, DUI arrests are plunging in South Florida. [Link]
This is the deadliest day of the year for car wrecks in America (LATimes/Bloomberg)
August 2nd is the most deadly day of the calendar for car accidents, even though it isn’t a major holiday or a period of the year with bad weather. [Link]
Investing
Fidelity to launch zero-cost index funds (Reuters)
It was inevitable, we suppose, but officially hit the wires this week: it’s now possible to own an equity index fund that does not have fees of any kind. [Link]
Podcasts
Forget Photo Shoots. Why GQ and Gucci are Betting on Culty Podcasts by Jacob Gallagher (WSJ)
As podcast volumes soar and the medium becomes further-engrained in the daily routines of millions of Americans, advertisers are developing new strategies to capitalize on the audio format. [Link; paywall]
American Environments
A Toxic Tide Is Killing Florida Wildlife by Tryggvi Adalbjornsson and Melissa Gomez (NYT)
Algae blooms in both the oceans and freshwater lakes of Florida are wreaking havoc on sea life and tourist industry on Florida beaches alike. [Link; soft paywall]
Here’s How America Uses Its Land by Dave Merrill and Lauren Leatherby (Bloomberg)
A comprehensive graphical review of how the US uses its land. Some surprises: nearly as much maple syrup producing land as golf courses, similar land use for railroads and airports, and the massive slug of lands dedicated to cows. [Link; soft paywall]
Inequality
Income and Wealth Inequality in America, 1949-2016 by Moritz Kuhn, Moritz Schularick, and Ulrike I. Steins (Minneapolis Fed)
New data using the Survey of Consumer Finances dating back to 1949 reveals striking new data on the shockingly lopsided distribution of wealth in the United States. [Link]
Youth
LeBron James opened a public school in Akron for at-risk kids by James Dator (SBNation)
The truly incredible school Lebron James is funding in his home town, part of his commitment to philanthropy that has spanned a career. [Link]
Summer Camp for the Ultra-Wealthy Teaches Kids How to Stay Rich by Suzanne Woolley (Bloomberg)
A series of events styled as a summer camp is being run by the likes of UBS, Citi, and Credit Suisse in an effort to attract and keep the business of a generation of heirs. [Link; soft paywall]
Read Bespoke’s most actionable market research by starting a two-week free trial today! Get started here.
Have a great Sunday!
The Bespoke Report — Apple Breaks a Trillion, Propels S&P Higher
The Closer: End of Week Charts — 8/3/18
Looking for deeper insight on global markets and economics? In tonight’s Closer sent to Bespoke clients, we recap weekly price action in major asset classes, update economic surprise index data for major economies, chart the weekly Commitment of Traders report from the CFTC, and provide our normal nightly update on ETF performance, volume and price movers, and the Bespoke Market Timing Model. We also take a look at the trend in various developed market FX markets.
Below is a snapshot from today’s Closer highlighting weekly intraday price charts for major equity indices and other asset classes. If you’d like to see more, start a free trial below.

The Closer is one of our most popular reports, and you can sign up for a free trial below to see it!
See tonight’s Closer by starting a two-week free trial to Bespoke Institutional now!
July 2018 Headlines
Biggest Winners on Earnings this Season
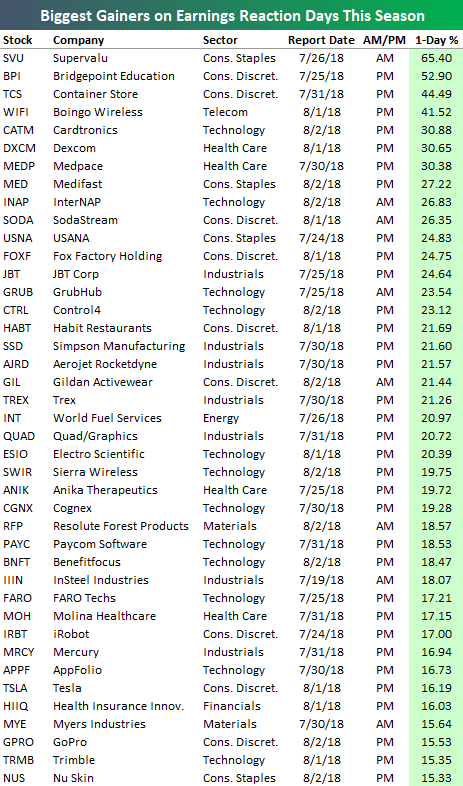
Of the 1,516 stocks that have reported their Q2 numbers so far this earnings season, 41 have gained more than 15% on their earnings reaction days (the first trading day following the earnings report). If you owned any of these names heading into their earnings reports, your portfolio certainly got a nice boost!
At the top of the list is Supervalu (SVU) with a one-day gain of 65.40% on its earnings reaction day. It just so happens that along with the release of its earnings on 7/26, United Natural Foods (UNFI) announced that it was buying SVU for $32.50. The stock closed at $19.45 on the day prior to the announcement.
While SVU’s gain of 65.4% was due to a buyout announcement, Bridgepoint Education’s (BPI) one-day move of 52.90% was all earnings related. It’s nice when your stock moves 50%+ in a day, right?
Rounding out the list of the five biggest winners this earnings season are the Container Store (TCS), Boingo Wireless (WIFI), and Cardtronics (CATM). All three of these stocks had one-day gains of more than 30% on their earnings reaction days.
As you scroll down the list of winners, you’ll see a few names that you recognize — SodaStream (yes, it’s still around), GoPro (yes, it’s still around too), iRobot (IRBT).
Given the negativity surrounding the company heading into its report this season, Tesla (TSLA) is probably the stock whose 16.19% gain surprised the most people. With 27% of its float sold short, TSLA’s gain also put a hurting on Elon Musk non-believers.
Keep a constant eye on earnings season winners and losers with a Bespoke Premium membership. Our earnings coverage is off the charts!
ISM Services Report Lays an Egg
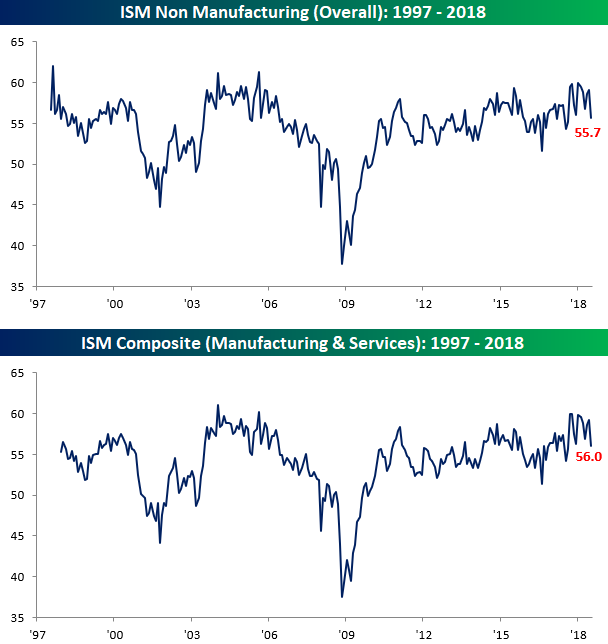
The ISM Services report for July came in lower than expected on Friday and missed expectations by a pretty decent amount, falling from 59.1 down to 55.7 compared to expectations for a reading of 58.6. With the actual reported number missing expectations by 2.9 points, it was the largest miss relative to expectations in exactly one year (8/3/17). On a combined basis and accounting for each sector’s share of the overall economy, the July ISM report came in at 56.0 compared to last month’s reading of 59.2. In the cases of both the ISM Services report and the combined ISM, July’s readings were the worst headline levels since last August.
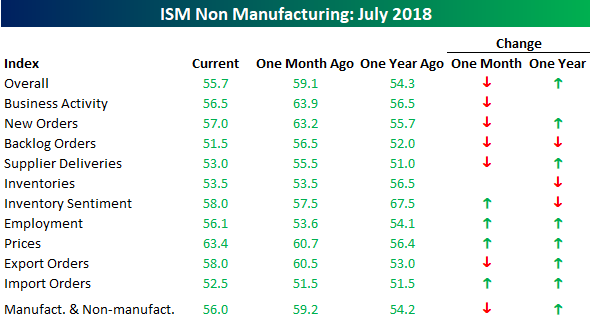
The table below breaks down the breadth of this month’s ISM report by showing each component’s m/m and y/y change. On a m/m basis, breadth in the July report was skewed just slightly negative, but we saw large declines in Business Activity, New Orders, and Backlog Orders. Conversely, both Prices Paid and Employment saw the largest increases. On a y/y basis, however, breadth remains positive and despite the large drops in Business Activity and New Orders, both indices are either flat to slightly higher relative to a year ago.
One interesting fact regarding the components of the ISM Services report is that this month was only the second time since 1997 (when data begins) that Business Activity, New Orders, and Backlog Orders all fell 5 points or more on a m/m basis. The only other time they fell that much or more was in October 2001, right after 9/11. One key difference between now and then, though, is that even after July’s declines, all three of these components are still well above 50 (dividing line between growth and contraction). Back in October 2001, these three components were only slightly above 40. In our newest Bespoke Report, we will have a full discussion of this week’s economic data slate as well as the latest earnings and market news. To read it, start a two-week free trial to Bespoke Premium!
Combined ISM Commodities Survey Near Multi-Year Highs
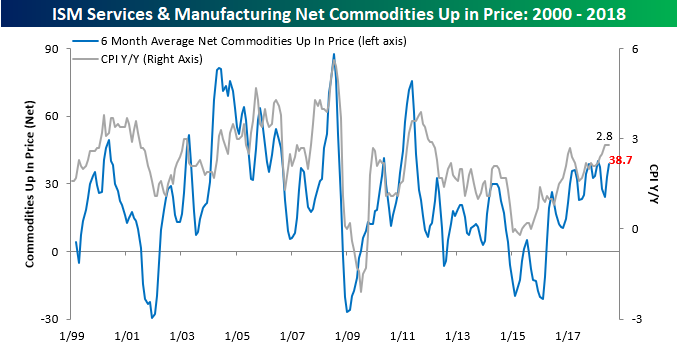
Earlier this week we noted that our Commodities Survey index for the ISM Manufacturing report reached the highest level since 2011. With this morning’s release of the ISM Services report, we just updated our combined Commodities Survey index to include data from both the Manufacturing and Services sector. The chart below shows the three-month moving average of the net number of commodities rising in price on a monthly basis since 1999. In the month of July, ISM reported that a total of 38 commodities were up in price and just one was down. July’s net reading of +37 brought the three-month moving average for this index to 38.7, which is up from 33 last month but still below the recent high of 40.0 from February. So while inflation signals in the manufacturing sector ticked up to their highest levels in seven years, the combined reading is close, but not quite at a new high.
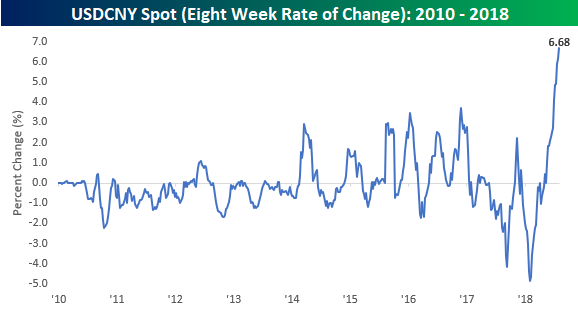
Eight Week Losing Streak for the Chinese Yuan
It has been a summer to forget for the Chinese yuan. Although the currency reversed earlier losses against the dollar today after the PBOC raised the reserve requirement on FX forwards from 0% to 20%, it is still on pace to finish lower against the dollar for the eighth straight week. Looking at a long-term chart of spot USDCNY shows how even after the dollar’s big rally this summer, it still remains below the levels it traded at relative to the yuan back in late 2016 when it peaked at just under 7.0. As of this writing, USDCNY is trading at 6.8348 but is down from earlier highs at 6.8972.

While the dollar has not quite reached new highs against the yuan in this most recent leg higher, the speed of the move is noteworthy. Over the last eight weeks of gains for the dollar relative to the yuan, it has rallied 6.68%, which is by far the largest eight week gain in USDCNY since at least 2010. What’s also worth pointing out is that this extreme eight-week rally in USDCNY immediately followed what was an extreme eight-week decline! If nothing else, the currency pair has become a lot more volatile in 2018. We’ve been discussing the recent moves in China’s currency and how it relates to trade in detail on a daily basis in our various reports. In our newest Bespoke Report, we will be dedicating an entire section to it. To read the analysis, start a two-week free trial to Bespoke Premium!