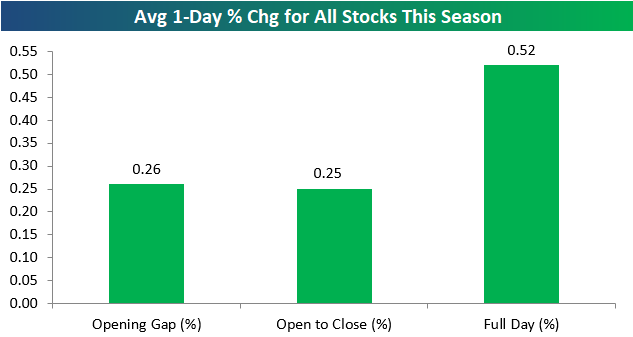
Stocks Reacting Positively to Earnings
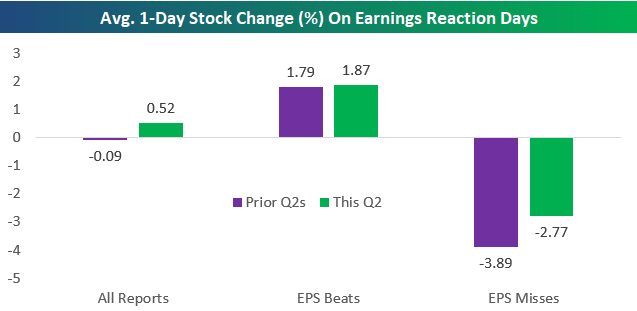
The second quarter earnings reporting period has actually been the most bearish for stock price reactions throughout history. It’s the only quarter of the year where stocks have historically averaged a decline (-0.09%) on their earnings reaction days going back to 2001. As shown below, though, this Q2 is shaping up very positively. The average stock that has reported this season has gained 0.52% on its earnings reaction day. (For a stock that reports after the close, its earnings reaction day is the next trading day. For a stock that reports before the open, its earnings reaction day is that trading day.)
Notably, investors have bid up stocks in after-hours and pre-market trading after they’ve reported, and they’ve bid them up more during regular trading hours. Also shown in the chart below, the average stock that has reported this season has opened higher at the start of the trading day by +0.26%, and then it has averaged a further gain of 0.25% from the open of trading to the close. (The combination of the opening gap of 0.26% and the open to close move of 0.25% results in a full day change of +0.52%).
During prior Q2 reporting periods, the average stock that has reported has fallen 0.09% on its earnings reaction day. In addition, the average stock that has beaten EPS estimates has gained 1.79% on its Q2 earnings reaction day, while the average stock that has missed EPS estimates has fallen 3.89% on its Q2 earnings reaction day.
This season, earnings beats are performing slightly better than they normally do, while earnings misses are falling less. As shown in the chart below, the average EPS beat this season has risen 1.87% on its earnings reaction day, while the average EPS miss has only fallen 2.77%. Compared to prior Q2s, smaller declines for EPS misses this season is the big story.
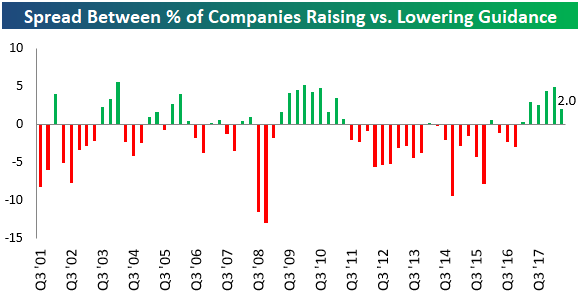
Guidance Readings Down But Still Positive
Just as earnings and revenue beat rates have dipped a bit this quarter, our guidance spread has also dipped. Below is a chart showing the spread between the percentage of companies raising guidance minus lowering guidance each quarter going back to 2001. This season, the guidance spread stands at +2 percentage points, so more companies are raising guidance than lowering guidance. As you can see in the chart, though, the spread is lower this season than it has been in the prior four quarters, indicating that companies aren’t quite as optimistic now as they’ve been at prior points over the last year.
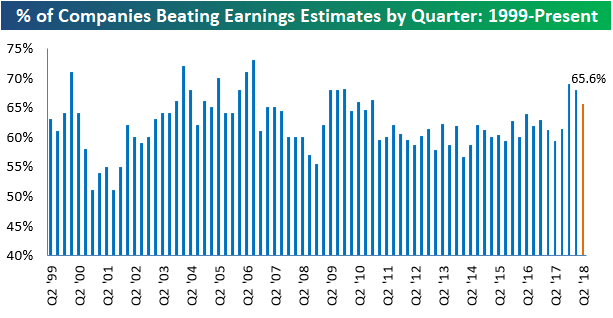
Top and Bottom Line Beat Rates Strong But Down a Bit From Prior Quarters
More than 2,000 companies have now reported their Q2 earnings results, and as we show below, 65.6% of companies have beaten bottom-line consensus analyst EPS estimates. The 65.6% EPS beat rate this season is above the average of just over 60% that we’ve seen going back to 1999, but it’s definitely down from the stronger readings seen over the prior two quarters.
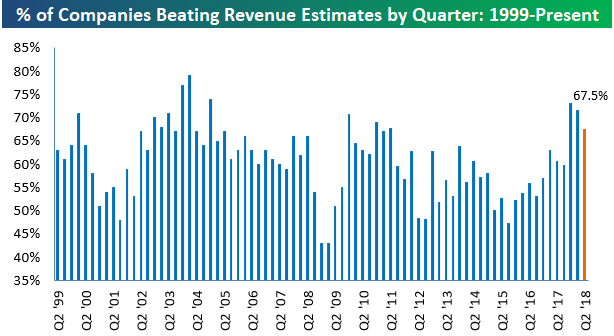
The top-line revenue beat rate is also down versus the prior two quarters. As shown below, this season we’ve seen 67.5% of companies beat top-line consensus revenue estimates.
Even though the top and bottom line beat rates are above their long-term averages, we have seen a slowdown from the extremely high readings seen over the prior two quarters.
The Closer — False Alarm?
Log-in here if you’re a member with access to the Closer.
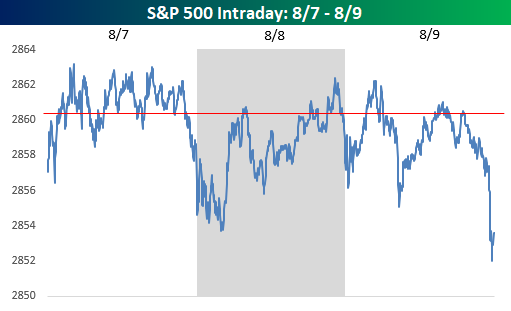
What is it with 2,860 this week. After a strong day on Monday, it seemed as though getting back to the January highs would be a mere formality for the S&P 500, but in the last three days, it hasn’t even been able to trade and close above 2,860.
In tonight’s Closer sent to Bespoke Institutional clients, we look at how equities perform after the VIX closes at a six-month low for the first time in at least six months. We also look at prior periods where the S&P 500 went at least six months between new highs to see how common it was for the index to make a run for new highs, only for it to end up being a false alarm.
See today’s post-market Closer and everything else Bespoke publishes by starting a 14-day free trial to Bespoke Institutional today!
Bespoke’s Sector Snapshot — 8/9/18
Chart of the Day: Analysts More Bullish Across the Board
the Bespoke 50 — 8/9/18
Every Thursday, Bespoke publishes its “Bespoke 50” list of top growth stocks in the Russell 3,000. Our “Bespoke 50” portfolio is made up of the 50 stocks that fit a proprietary growth screen that we created a number of years ago. Since inception in early 2012, the “Bespoke 50” has beaten the S&P 500 by 93.0 percentage points. Through today, the “Bespoke 50” is up 201.2% since inception versus the S&P 500’s gain of 108.2%. Always remember, though, that past performance is no guarantee of future returns.
To view our “Bespoke 50” list of top growth stocks, click the button below and start a trial to either Bespoke Premium or Bespoke Institutional.

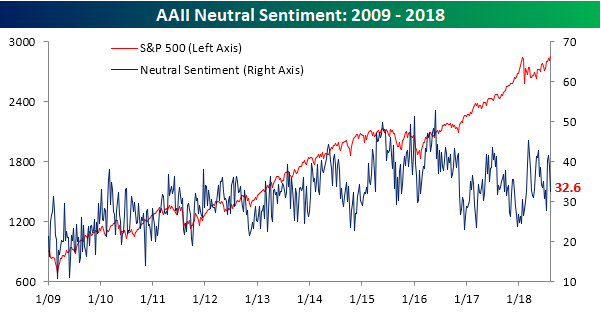
Investors Jump Off the Fence
When it comes to individual investor sentiment, three weeks ago, we noted that many investors had suddenly become indecisive as both bullish and bearish sentiment declined while neutral sentiment surged. This week, we saw a bit of a reversal in that trend as a number of investors hopped off the fence and moved into the bullish camp. According to this week’s survey results from AAII, bullish sentiment increased from 29.1% up to 36.4%. That’s a healthy uptick in sentiment but is still below long-term averages.
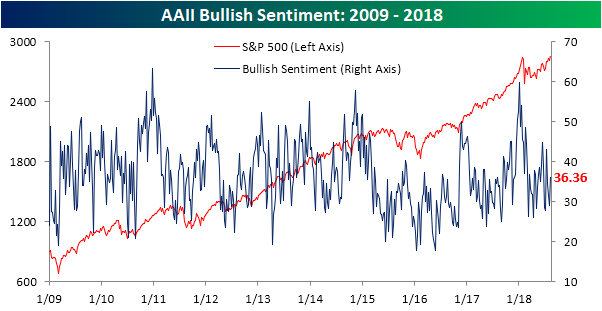
Negative sentiment barely budged this week as the percentage of individual investors in the bearish camp fell from 32.1% down to 31.0%.
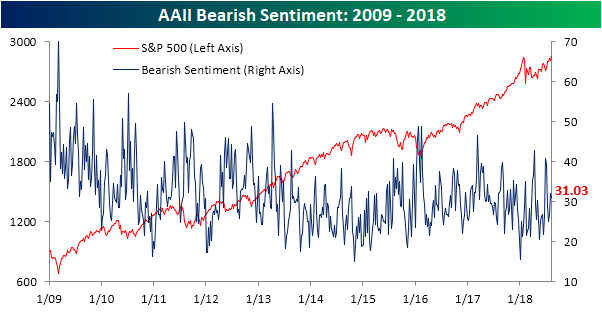
Last week, nearly 40% of individual investors were neutral. This week, that reading dropped to less than a third.
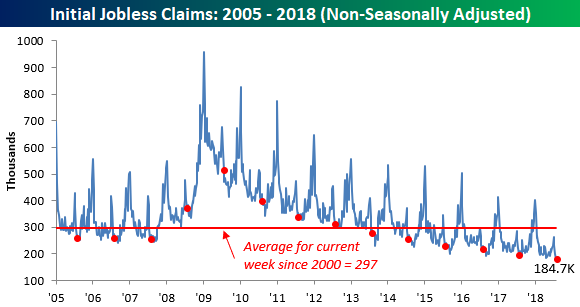
More Generational Lows in Jobless Claims
This week’s Jobless Claims report came in lower than expected as first-time claims dropped to 213K compared to expectations of 220K and last week’s reading of 219K. While 208K remains the lowest weekly print of the cycle, this week’s reading is only 5K above that, which is practically a rounding error when it comes to claims. Updating our weekly look at notable streaks for the headline seasonally-adjusted number, this week’s report is the record 179th straight week of sub 300K readings, the 44th straight week of readings at 250K or below (the longest streak since 1970), and the 5th straight week of readings at or below 220K (longest streak since 1969).

In spite of the lower than expected print, the four-week moving average for claims barely budged this week, falling from 214.5K down to 214.25K. For now, the cycle low of 213.5K remains intact, and with a reading of 208K scheduled to roll off next week, it’s unlikely we’ll see a new low next week.
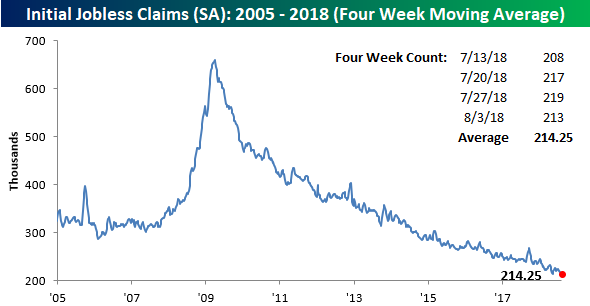
On a non-seasonally adjusted (NSA) basis, jobless claims rose from 179.9K up to 184.7K, but that’s still more than 100K below the average of 297.5K for the current week of the year dating back to 2000. In fact, going back to the beginning of the data series, there has never been a reading lower than this week’s NSA reading for the current week of the year.