Biggest Market Cap Gainers Since the 2016 Election
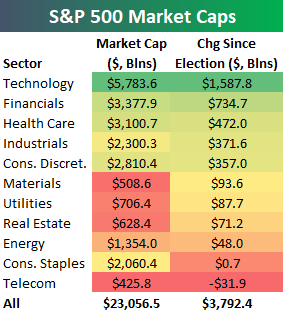
Yesterday we published an in-depth recap of asset class performance since the 2016 Presidential Election. You can view the full report here if you’re interested. One of the stats included in the report was the change in market cap experienced by the S&P 500 and its eleven sectors since last November’s election. As shown below, the S&P 500 has seen its market cap grow by $3.792 trillion since 11/8/16, leaving it with a total market cap of more than $23 trillion as of today.
In terms of sectors, Technology has grown by far the most with an increase in market cap of more than $1.5 trillion. The Financial sector has grown the second-most at only half that amount.
In terms of individual stocks, below is a list of the 35 S&P 500 stocks that have seen the biggest increases in market cap since last November’s Election. Six companies have seen growth of more than $100 billion! Apple (AAPL) has grown the most at $310 billion, followed by Microsoft (MSFT), Alphabet (GOOGL), Amazon (AMZN), Facebook (FB), and Bank of America (BAC).
Claims Have Shaken Off Hurricane Impact
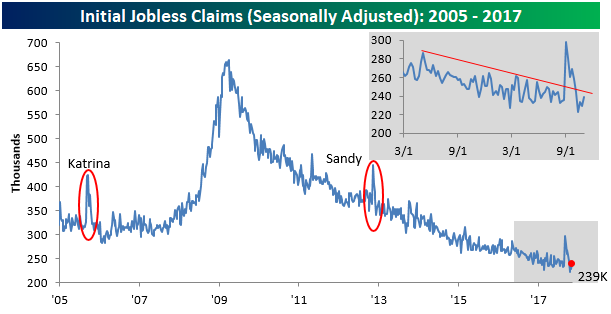
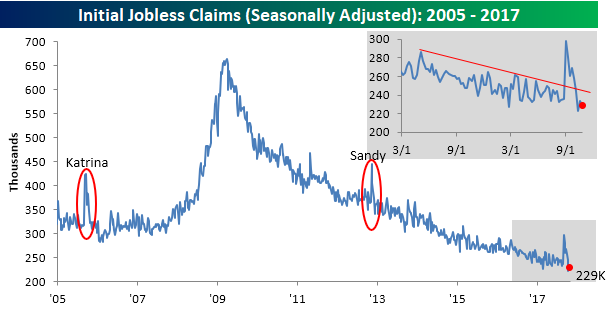
Initial jobless claims came in slightly higher than expected at 239,000 for the week ending November 4th, versus 232,000 expected and 229,000 last week. Continuing claims were slightly weaker, rising to 1.901mm versus 1.885 expected and 1.884 previously. While the uptick wasn’t positive, the trend is still very much “down and to the right”.
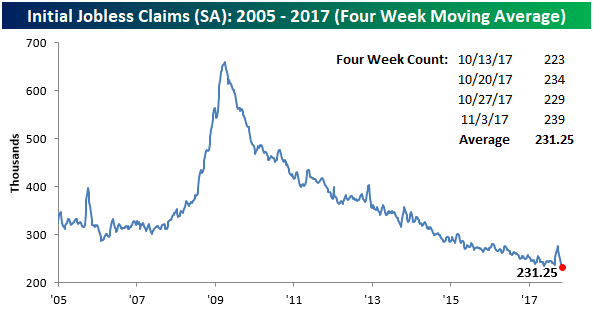
The best way to measure the trend of claims is to look at the 4 week moving average. As shown in the chart below, that 4 week average is the lowest we’ve seen in the current cycle. It’s also the lowest number in more than 40 years, with no other period since 1973 showing claims so low in a 4 week period.
On an non-seasonally adjusted basis, the current week saw claims of less than 220,000, and as has been the case for a while now, it was the lowest level for this week of the year in the past decade. On average, claims have typically been more than 50% higher than the current level during this week of the year.
the Bespoke 50 — 11/9/17
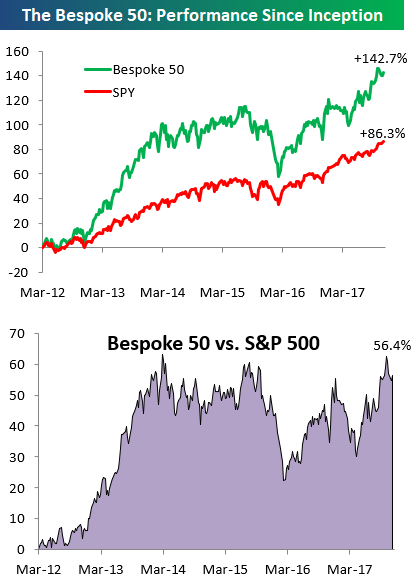
Every Thursday, Bespoke publishes its “Bespoke 50” list of top growth stocks in the Russell 3,000. Our “Bespoke 50” portfolio is made up of the 50 stocks that fit a proprietary growth screen that we created a number of years ago. Since inception in early 2012, the “Bespoke 50” has beaten the S&P 500 by 56.4 percentage points. Through today, the “Bespoke 50” is up 142.7% since inception versus the S&P 500’s gain of 86.3%. Always remember, though, that past performance is no guarantee of future returns.
To view our “Bespoke 50” list of top growth stocks, click the button below and start a trial to either Bespoke Premium or Bespoke Institutional.
ETF Trends: US Indices & Styles – 11/8/17
The Closer — S&P De-FAANGed, Labor Turnover, Exports Punish WTI — 11/8/17
Log-in here if you’re a member with access to the Closer.
Looking for deeper insight on markets? In tonight’s Closer sent to Bespoke Institutional clients, we take a look at how much the FAANG stocks (Facebook, Apple, Amazon, Netflix, and Alphabet) have impacted S&P 500 returns. We also take a look at labor market turnover and review the EIA petroleum market data released today.
The Closer is one of our most popular reports, and you can sign up for a free trial below to see it!
See today’s post-market Closer and everything else Bespoke publishes by starting a 14-day free trial to Bespoke Institutional today!
B.I.G. Tips – Post Election Recap
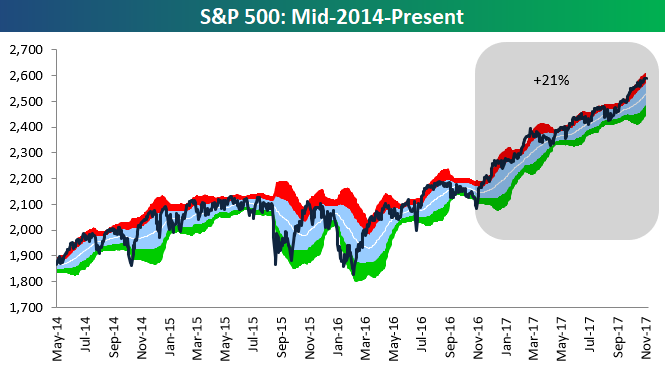
Time travel back to November 7th, 2016 — one day prior to the 2016 US Presidential Election. Which of these outcomes would you have thought more likely? 1) Trump wins the Election, or 2) the S&P 500 rallies 20%+ over the next year IF Trump wins the Election. We’ll let you ponder over that one for a moment, but fast-forward to today, and we’re now one year past Trump’s improbable victory on 11/8/16. Since then, the S&P 500 is up 21%.
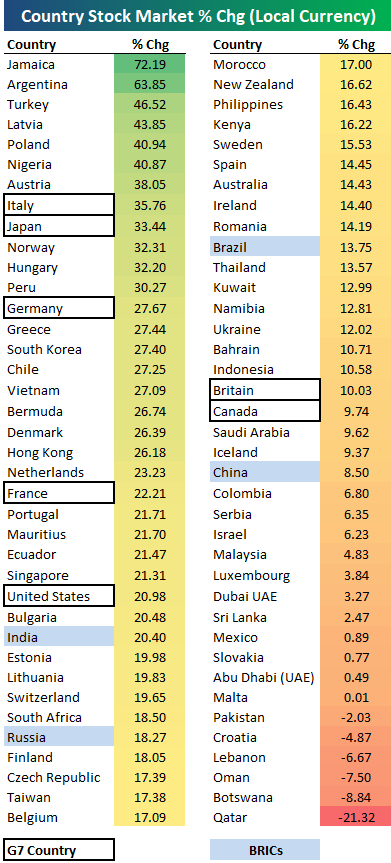
Below is a table highlighting the performance of 76 stock markets around the world since Election Day 2016 (in local currency). All but 6 of the 76 countries are up over the last year, with Jamaica on top at +72.19%. Of the G7 countries, Italy ranks first with a gain of 35.76%, followed by Japan at +33.44% and Germany at +27.67%. The US has been just the 5th best of the G7, with only Britain and Canada posting smaller gains. Of the BRICs, India is up the most while China is up the least
We’ve just published an in-depth report on the state of the market one year past Election Day 2016. If you would like to give it a read, start a 14-day free trial to Bespoke Premium now!
Fixed Income Weekly – 11/8/17
Searching for ways to better understand the fixed income space or looking for actionable ideals in this asset class? Bespoke’s Fixed Income Weekly provides an update on rates and credit every Wednesday. We start off with a fresh piece of analysis driven by what’s in the headlines or driving the market in a given week. We then provide charts of how US Treasury futures and rates are trading, before moving on to a summary of recent fixed income ETF performance, short-term interest rates including money market funds, and a trade idea. We summarize changes and recent developments for a variety of yield curves (UST, bund, Eurodollar, US breakeven inflation and Bespoke’s Global Yield Curve) before finishing with a review of recent UST yield curve changes, spread changes for major credit products and international bonds, and 1 year return profiles for a cross section of the fixed income world.
In this week’s note, we review ex-ante yields on crude oil futures, MLPs, and high yield bonds in the Energy sector.
Our Fixed Income Weekly helps investors stay on top of fixed income markets and gain new perspective on the developments in interest rates. You can sign up for a Bespoke research trial below to see this week’s report and everything else Bespoke publishes free for the next two weeks!
Click here and start a 14-day free trial to Bespoke Institutional to see our newest Fixed Income Weekly now!
Chart of the Day: Manufacturing Monster
Bespoke’s Global Macro Dashboard — 11/8/17
Bespoke’s Global Macro Dashboard is a high-level summary of 22 major economies from around the world. For each country, we provide charts of local equity market prices, relative performance versus global equities, price to earnings ratios, dividend yields, economic growth, unemployment, retail sales and industrial production growth, inflation, money supply, spot FX performance versus the dollar, policy rate, and ten year local government bond yield interest rates. The report is intended as a tool for both reference and idea generation. It’s clients’ first stop for basic background info on how a given economy is performing, and what issues are driving the narrative for that economy. The dashboard helps you get up to speed on and keep track of the basics for the most important economies around the world, informing starting points for further research and risk management. It’s published weekly every Wednesday at the Bespoke Institutional membership level.
You can access our Global Macro Dashboard by starting a 14-day free trial to Bespoke Institutional now!
The Closer — Phenomenal Factor, JOLTS Journey, Consumptive Credit — 11/7/17
Log-in here if you’re a member with access to the Closer.
Looking for deeper insight on markets? In tonight’s Closer sent to Bespoke Institutional clients, we take a look at quantitative factor performance in the US equity market, data from the monthly JOLTS report, and a recap of consumer credit numbers from the Fed.
The Closer is one of our most popular reports, and you can sign up for a free trial below to see it!
See today’s post-market Closer and everything else Bespoke publishes by starting a 14-day free trial to Bespoke Institutional today!
