Morning Lineup – Shaky Start
It’s not looking like a pretty morning for equity bulls today, but with the DJIA futures indicating an opening decline of just over 200 points, things look a lot better than they did a few hours ago. As always when the market’s get into one of their moods, things tend to move in fits and starts before calming down, so expect to see some violent swings throughout the day. The opening bell is only an hour away, but we could just as easily see an up open when the bell rings as we could see a down 400+ open. In the big picture, while today’s early weakness is disappointing, positive futures following a day like yesterday are often met with selling.
In today’s Chart of the Day, which was just sent out a short time ago, we looked at S&P 500 performance figures following 3% down days. Be sure to check it out.
Yesterday’s fifth straight day of declines has really moved the S&P 500, most of its sectors, and a lot of stocks into oversold territory. Among individual S&P 500 stocks, more than half (52%) are now trading more than one standard deviation below their 50-DMA, which is the highest reading in over six months.
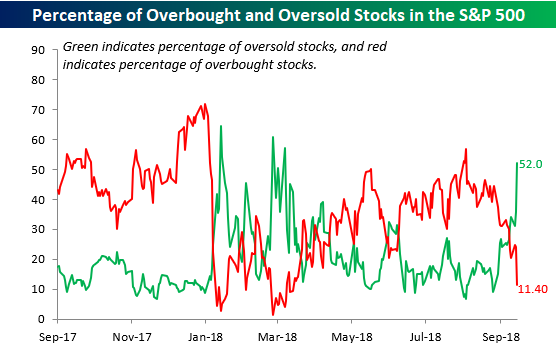
Among the S&P 500’s major sectors, just three (Energy, Health Care, and Utilities) are not oversold and three (Financials, Materials, and Technology) are trading more than three standard deviations below their 50-day moving average- a level that we would unscientifically call ‘waayyy’ oversold. The S&P 500 is also trading at oversold levels, but still hasn’t quite reached those ‘waayyy’ oversold levels.
Start a two-week free trial to Bespoke Premium to see today’s full Morning Lineup report. You’ll receive it in your inbox each morning an hour before the open to get your trading day started.

Chart of the Day: Wicked Wednesday, Turnaround Thursday?
the Bespoke 50 — 10/11/18
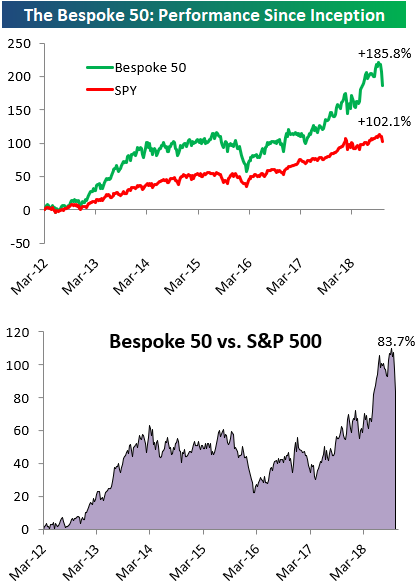
Every Thursday, Bespoke publishes its “Bespoke 50” list of top growth stocks in the Russell 3,000. Our “Bespoke 50” portfolio is made up of the 50 stocks that fit a proprietary growth screen that we created a number of years ago. Since inception in early 2012, the “Bespoke 50” has beaten the S&P 500 by 83.7 percentage points. Through today, the “Bespoke 50” is up 185.8% since inception versus the S&P 500’s gain of 102.1%. Always remember, though, that past performance is no guarantee of future returns.
To view our “Bespoke 50” list of top growth stocks, click the button below and start a trial to either Bespoke Premium or Bespoke Institutional.
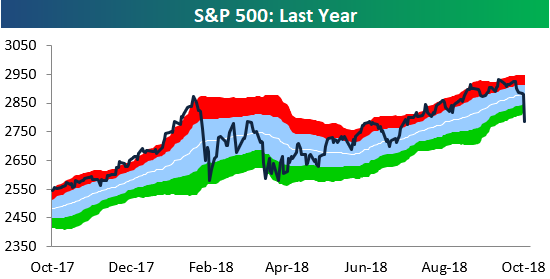
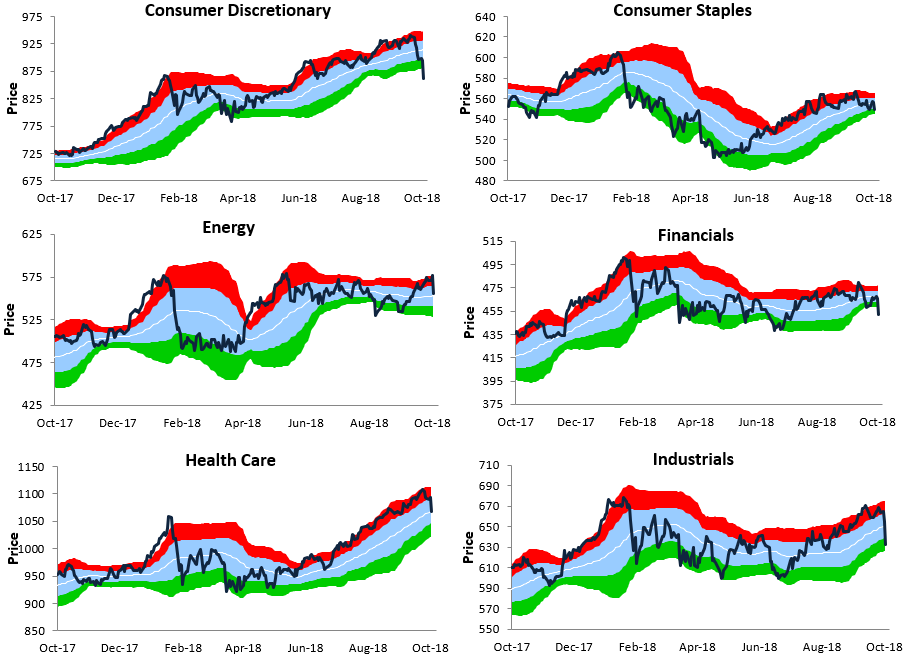
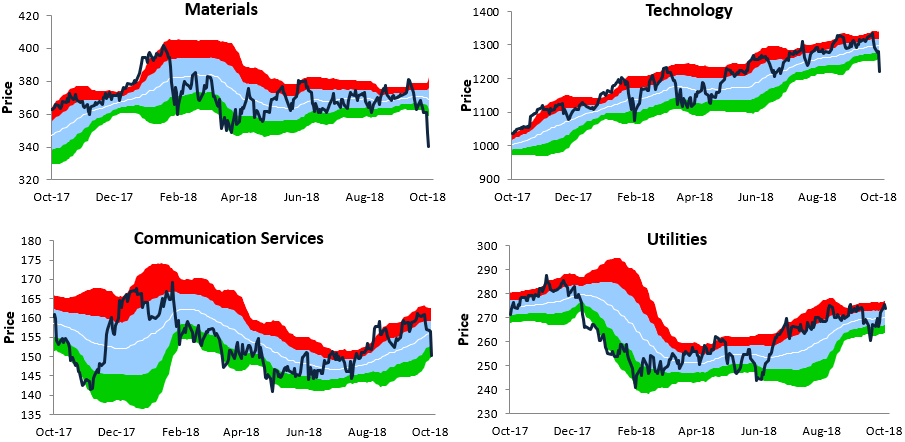
Bespoke’s Sector Trading Range Charts
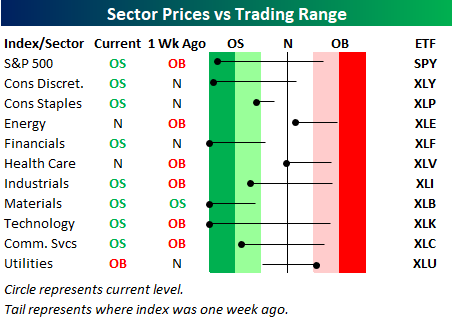
The S&P 500’s 3.3% drop on Wednesday (10/10) leaves the index down 4.4% month to date already. Below is a look at our updated Bespoke sector trading range charts to see what’s left in the rubble after a truly horrific start to the month for stocks.
The light blue shading in each chart represents each index’s “normal” trading range, which is one standard deviation above and below the 50-day moving average. Moves into the red or green zones mean the index has gotten “overbought” or “oversold.” An “oversold” reading means price is more than one standard deviation below the 50-DMA, and vice versa for an “overbought” reading.
After yesterday’s drop, the S&P 500 has reached its most oversold level since the end of the first quarter when the index successfully re-tested its February correction low.
Looking at individual sectors, a number of them broke down badly yesterday and are now trading at or close to their most extreme oversold levels of the last year. These include Consumer Discretionary, Materials, and Technology.

The Closer — Stocks Smoked — 10/10/18
Log-in here if you’re a member with access to the Closer.
Looking for deeper insight on markets? In tonight’s Closer sent to Bespoke Institutional clients, we go into detail on today’s equity market selloff, including index technicals, the collapse of growth versus value, a huge decline in the Nasdaq 100, and the role interest rate term structure has played in equity selling.

See today’s post-market Closer and everything else Bespoke publishes by starting a 14-day free trial to Bespoke Institutional today!
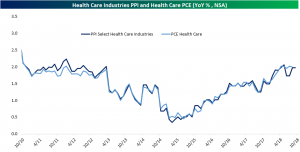
PPI Maintains Its Pace
The BLS released September Producer Price Index numbers this morning. PPI has been gradually accelerating since late 2015/early 2016, but recent months saw PPI begin to slow by its headline measure. The headline PPI decelerated again last month down to 2.73% YoY from 2.83% the month before. This continues a trend over the past few months of the headline measure surprising lower. Meanwhile, Core PPI which removes food and energy accelerated slightly to 2.48% YoY from 2.4%. A more refined measure of PPI excluding foods, energy, and trade services increased the most, up 3.02% YoY compared to 2.84% in August. This is the first time this measure of core PPI has been higher than the headline number since June 2017. While the headline data may confirm multiple recent Fed members claiming to not see any striking issues concerning inflation on the horizon, the core measures indicates pretty broad price pressures after removing volatile components (food, energy) and margins for retail and wholesale operators.
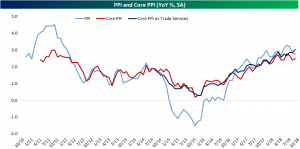
We also like to look at the PPI index for Select Health Care Industries, which the BEA uses as a direct input for PCE Health Care. As shown below, the PPI measure shows that health care inflation continues to run at a reasonably strong clip and about in-line with core inflation.
B.I.G. Tips – Analyst Ratings Update
B.I.G. Tips – Analysts Increasingly Pessimistic
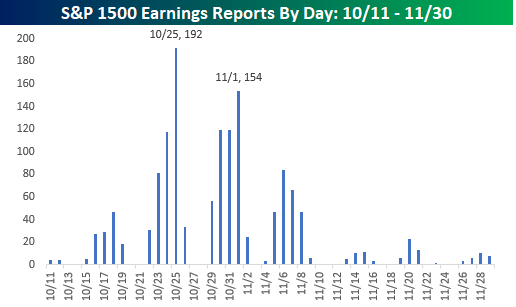
Earnings season kicks off this week as the first of the major companies start to report Q3 numbers. Most of the big names reporting are Financials like Citigroup (C), JPMorgan Chase (JPM), PNC, and Wells Fargo (WFC), which all report on Friday morning. Besides these names, the only non-Financials of note are Delta Air Lines (DAL) and Walgreens Boots (WBA), which both report before the open on Thursday.
While the pace of reports is quiet this week, things will pick up next week when 126 companies in the S&P 1500 are expected to report. The peak period of earnings season, though, will be in the two weeks that follow as more than 900 companies in the S&P 1500 are scheduled to report. That’s 60% of the entire index in just two weeks! The busiest day during that period will be on 10/25 when 192 companies in the S&P 1500 are expected to report in a single day, while the second busiest day of earnings season is one week later on 11/1 when another 154 companies will report. For a more detailed rundown of the earnings schedule for the upcoming season, please see our Interactive Earnings Calendar, and to prepare for how individual companies tend to react to earnings, check out our Earnings Screener (available to all Institutional clients).
Just in time for earnings season, in a just-published B.I.G. Tips report, we presented an analysis of how analyst sentiment heading into earnings season impacts stock market performance during the ensuing reporting period. For access to this must-see report, sign up for a monthly Bespoke Premium membership now!
Fixed Income Weekly – 10/10/18
Searching for ways to better understand the fixed income space or looking for actionable ideals in this asset class? Bespoke’s Fixed Income Weekly provides an update on rates and credit every Wednesday. We start off with a fresh piece of analysis driven by what’s in the headlines or driving the market in a given week. We then provide charts of how US Treasury futures and rates are trading, before moving on to a summary of recent fixed income ETF performance, short-term interest rates including money market funds, and a trade idea. We summarize changes and recent developments for a variety of yield curves (UST, bund, Eurodollar, US breakeven inflation and Bespoke’s Global Yield Curve) before finishing with a review of recent UST yield curve changes, spread changes for major credit products and international bonds, and 1 year return profiles for a cross section of the fixed income world.
This week we look at where real yields are sitting around the world.

Our Fixed Income Weekly helps investors stay on top of fixed income markets and gain new perspective on the developments in interest rates. You can sign up for a Bespoke research trial below to see this week’s report and everything else Bespoke publishes free for the next two weeks!
Click here and start a 14-day free trial to Bespoke Institutional to see our newest Fixed Income Weekly now!
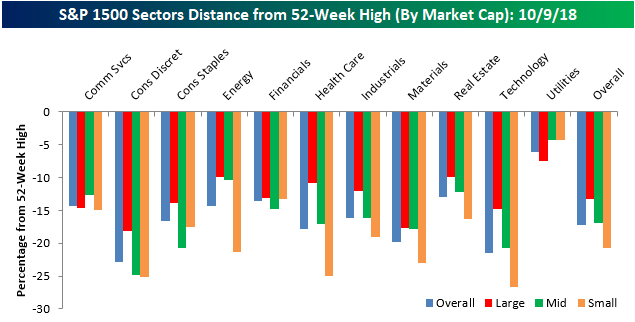
Small Cap Stocks Getting Crushed Across Sectors
In a post yesterday, we highlighted the fact that while large-cap stocks in the S&P 500 were down an average of 13.2% from their 52-week highs, small-cap stocks were faring much worse, with stocks in the S&P 600 Small Cap index down an average of over 20% from their respective highs. Today, we wanted to go into a little more detail on these market cap divergences by looking at how far stocks are down from their 52-week highs within individual sectors.
While small-cap stocks are down an average of 20.7% from their 52-week highs, small-cap Technology, Consumer Discretionary, and Health Care stocks are down an average of much more. In the Technology sector, for example, the average spread between where individual small cap tech stocks are trading relative to their 52-week highs is 26.7%, while in the Consumer Discretionary sector that same spread is just over 25%. While stocks in these sectors have sold off sharply from their 52-week highs, stocks in the Utilities sector are down less than 5% on average from their 52-week highs. Utilities is also the only sector where the average small-cap stock is down less from its 52-week high than the average large-cap stock in the sector.
Speaking of large caps, stocks in the Consumer Discretionary and Materials sector are trading down the furthest from their 52-week highs (~18%), while Utilities (-7.4%), Energy (-9.9%), and Real Estate (-9.95%) are the only three sectors where stocks are down less than 10%, on average, from their 52-week highs.