Bespoke Stock Scores — 10/16/18
Chart of the Day: Small Cap Mean Reversion
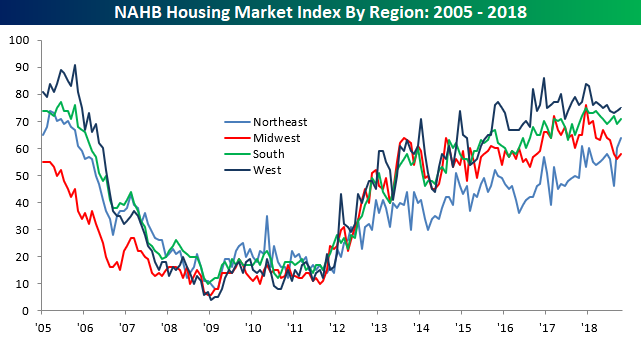
Homebuilder Sentiment Unexpectedly Jumps
Lately, it seems that there hasn’t been a whole lot of positive data coming out of the residential housing sector, but this morning we actually received some good news for a change. According to the National Association of Homebuilders (NAHB), homebuilder sentiment for the month of October unexpectedly increased from 67 up to 68 versus estimates for a decline to 66. In spite of this month’s increase, the index is still off of its high of 74 that was hit right at the end of 2017 when the GOP tax plan was passed.

Breaking out this month’s report by sales, traffic, and regions shows gains across the board. As shown in the table below, Traffic saw a big surge rising from 49 back into positive territory at 53. From a regional perspective, sentiment improved in all four regions of the country, but for the second straight month, homebuilders in the Northeast saw the biggest boost to sentiment and it is the only region of the country where sentiment is at a high for the cycle. Finally, some good news out of the housing sector!

Morning Lineup – Another Rally Attempt
US equity futures are attempting to rally again this morning after yesterday’s last hour decline of nearly 1% erased all the positive goodwill from the rebound earlier in the day. The pace of earnings reports is finally starting to pick up, and based on this morning’s results, at least, the news has been good. Of the 12 companies that have reported, 11 have exceeded EPS forecasts and just three missed revenue estimates. The big question now is, can stocks finally rally on what at the surface look like good results?
Looking ahead at market seasonal trends, the gauges below are from our Stock Seasonality tool and show the S&P 500’s median historical return over the upcoming week, month, and quarter during the last ten years. In that span, the upcoming week and month have seen median gains of 0.48% and 1.18%, respectively. Relative to all other one week and one month periods over the last ten years, these returns are pretty much in line with the norm. Looking out over the next three months, though, it doesn’t get much better than the S&P 500’s median gain of 6.11% which ranks right up there with the best three month periods of the calendar over the last decade.

Start a two-week free trial to Bespoke Premium to see today’s full Morning Lineup report. You’ll receive it in your inbox each morning an hour before the open to get your trading day started.

Trend Analyzer – 10/16/18 – Holding Pattern
Today there is more of the same that we have seen this past week in our Trend Analyzer Tool. Every major US Index ETF with the exception of the Dow (DIA) remains extremely oversold after most markets again finished Monday slightly lower. The recent volatility has now erased YTD gains for three of the members of this group. The Russell Mid-Cap (IWR) ETF is currently down the most YTD at 1.06%. Core S&P Mid-Cap (IJH) is down 0.53% YTD, while the S&P MidCap 400 (MDY) which is down a quarter of a percent. Also important to note is that the Micro-Cap ETF (IWC) and the Russell 2000 (IWM) are both now trending sideways after breaking their uptrends on this downturn.

The Closer: Relative Trends, Deficit Spend, Canada Quarterly Improvement — 10/15/18
Log-in here if you’re a member with access to the Closer.
Looking for deeper insight on markets? In tonight’s Closer sent to Bespoke Institutional clients, we take a look at relative performance for two sectors versus the broad market as well as the ongoing break above resistance for our EMFX index. We also review the monthly budget numbers from the US Census, where the deficit was much smaller than typical thanks to a huge decline in outlays. Finally, we break down quarterly numbers from the BoC on the business outlook and availability of credit in Canada.

See today’s post-market Closer and everything else Bespoke publishes by starting a 14-day free trial to Bespoke Institutional today!
A Calmer Than Normal October
October has historically been the most volatile month of the year for equity markets, so the fact that volatility has picked up so far this month is to be expected. What may come as a surprise to many, though, is that so far at least, this October has been less volatile than average. The chart below shows the S&P 500’s average daily move by month going back to 1928, where October’s average daily move of +/-0.90% is clearly the largest of any month. With this October nearly half over, though, the average daily move so far has actually been just +/-0.77%. If the market is even going to see ‘average’ volatility this month, things are going to have to get a lot more active!
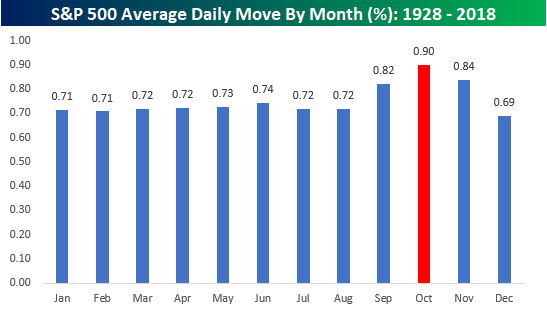
Chart of the Day: FOMC Speakers Stay Hawkish
Empire Manufacturing Tops Expectations
The Empire Manufacturing report put out by the New York Fed came in slightly stronger than expected in October, rising to a level of 21.1 from 19.0 and expectations for an increase to 20.0. The headline index for this report has now been positive for 24 straight months, which is the longest streak of positive readings since the 32-month streak that ended in January 2008. While the index of current General Business conditions rebounded this month, expectations pulled back for the second straight month.
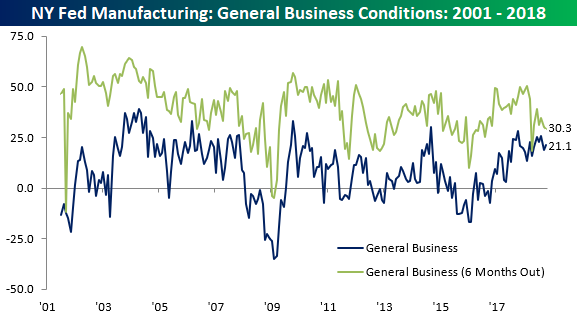
The internals of this month’s report were generally weak. In terms of current conditions, both New Orders and Shipments saw increases, but every other component declined including both Prices Paid and Prices Received as well as Number of Employees and Average Workweek. The outlook for Manufacturers was also skewed to the downside. While New Orders saw a slight increase, Shipments actually declined.
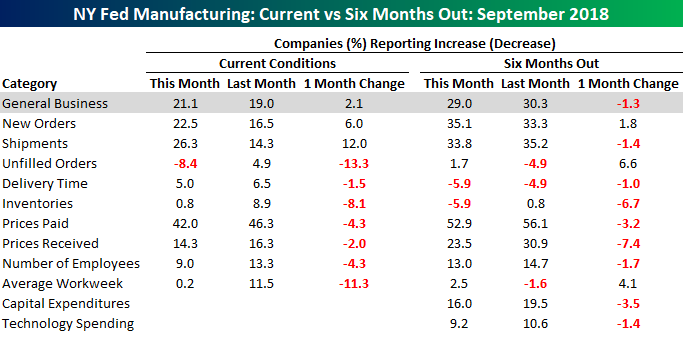
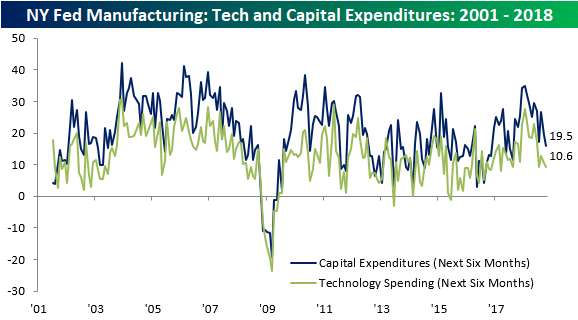
Another not so positive aspect of the October Empire Manufacturing report was the section about plans for Cap Ex and Technology Spending. Both of these indices declined in October. In the case of Cap Ex, that index dropped to its lowest level since August 2017, while the index for expected Technology Spending dropped to its lowest level since March 2017.
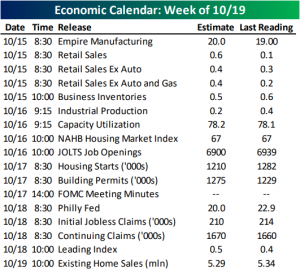
This Week’s Economic Indicators – 10/15/18
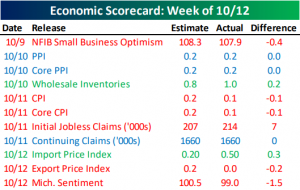
Not that there was much of it, but economic data took a backseat last week as investors were understandably more concerned with their portfolios. Regardless, there were some important reports, most of which did not meet expectations.
Inflation data—PPI on Tuesday, CPI on Wednesday, and Import/Export Prices on Friday—was the main focus point of the week. Of these reports three were weaker than expected, two were inline, and only one beat expectations. Small business optimism came in weaker and lower than expectations, but should not be a cause for concern as it still sits at above average levels. Jobless claims was a similar story. Even though it came in with a rare weaker reading, it is still at healthy levels.
This week things get a little bit busier with 17 US releases scheduled. Retail Sales for September kicked off the week earlier today slightly worse than forecasted. Sales grew, but just barely so. Fortunately, the core measure did beat estimates and the previous reading. Business Inventories also released this morning inline with estimates.
Looking towards the rest of this week, the main focus will center around housing. The National Association of Home Builders Housing Market Index releases tomorrow followed by Housing Starts and Building Permits on Wednesday. Existing Home Sales will close out the week on Friday morning. Also on the docket is the JOLTS report tomorrow and the Philly Fed Manufacturing Index and Leading Index on Thursday.
As always, you can find the day’s economic releases in our Economic Monitor.