Bespoke’s Sector Snapshot — 12/6/18
A 9-Year Low for Fluor (FLR)
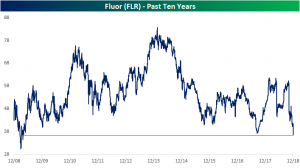
One of the country’s largest engineering and construction companies, Fluor (FLR), has declined 40% from its highs just two months ago. The company primarily offers engineering and construction services in oil, gas, industrial, and government projects including the development of power plants, petrochemical factories, mining facilities, and infrastructure. Seeing as misery loves company, the declines in oil prices track fairly well to the company in which oil and gas related business account for as much as 40% of revenues. With oil’s decline broadly being centered around an oversupply of the commodity, FLR’s business in oil and gas infrastructure understandably would be hurting.

Below is a price chart for FLR over the last ten years. Declines today have caused a breakdown below 2017 lows that takes shares to their lowest level since April 2009 — just one month after the Financial Crisis low was made.
Bespoke’s Consumer Pulse Report — November 2018
Bespoke’s Consumer Pulse Report is an analysis of a huge consumer survey that we run each month. Our goal with this survey is to track trends across the economic and financial landscape in the US. Using the results from our proprietary monthly survey, we dissect and analyze all of the data and publish the Consumer Pulse Report, which we sell access to on a subscription basis. Sign up for a 30-day free trial to our Bespoke Consumer Pulse subscription service. With a trial, you’ll get coverage of consumer electronics, social media, streaming media, retail, autos, and much more. The report also has numerous proprietary US economic data points that are extremely timely and useful for investors.
We’ve just released our most recent monthly report to Pulse subscribers, and it’s definitely worth the read if you’re curious about the health of the consumer in year two of Trump’s economy. Start a 30-day free trial for a full breakdown of all of our proprietary Pulse economic indicators.

November Employment Report Preview
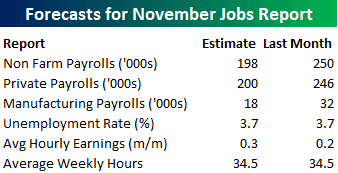
Heading into Friday’s Non Farm Payrolls (NFP) report for November, economists are expecting an increase in payrolls of 198K, which would be a decline from October’s report which came in above expectations at 250K. In the private sector, economists are expecting an increase of 200K, which would imply a similar decline versus October as the headline reading. The unemployment rate is expected to remain at 3.7%. Average hourly earnings are expected to grow at a rate of 0.3% versus the 0.2% reading last month. Higher wage growth is probably not something this market wants to see, but with expectations already anticipating some increase, it would have to be a big jump to really have a negative impact on the market. Finally, average weekly hours are expected to be unchanged at 34.5.
Ahead of the report, we just published our eleven-page preview of the November jobs report. This report contains a ton of analysis related to how the equity market has historically reacted to the monthly jobs report, as well as how secondary employment-related indicators we track looked in November. We also include a breakdown of how the initial reading for November typically comes in relative to expectations and how that ranks versus other months.
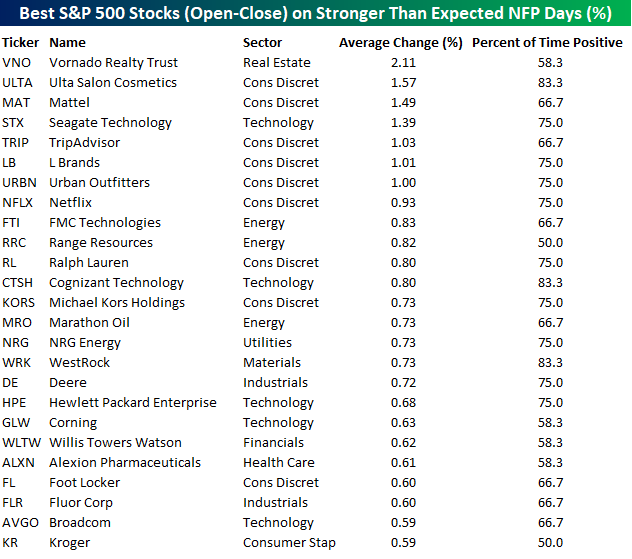
One topic we cover in each month’s report is the S&P 500 stocks that do best and worst from the open to close on the day of the employment report based on whether or not the report comes in stronger or weaker than expected. In other words, which stocks should you buy, and which should you avoid? The table below highlights the best-performing stocks in the S&P 500 from the open to close on days when the Non-Farm Payrolls report has been better than expected over the last two years.
Of the top performing stocks on days when NFP beats expectations, ten sectors are represented, but Consumer Discretionary leads the way with nine. Vornado (VNO) has been the best performing stock with an average open to close gain of 2.11%, but six of the next seven stocks are from the Consumer Discretionary sector. In terms of consistency, just three stocks (Ulta Beauty, Cognizant, and WestRock) have been in the black more than three-quarters of the time.
For anyone with more than a passing interest in how equities are impacted by economic data, this November employment report preview is a must-read. To see the report, sign up for a monthly Bespoke Premium membership now!
Yield Curves Near Inversion
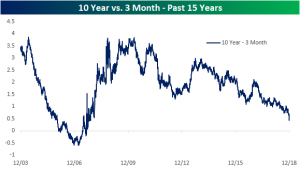
On Tuesday, the front end of the yield curve inverted as 3-year yields rose above 5-year yields. Other front end curves, by that measure, while not there yet, have also begun to dip to cycle lows. The 10-year minus 3-month spread is at its lowest level since 2007. Despite being at a low for the current cycle, the curve remains around 40 bps from inversion.
In the charts below we look at various yield curves over the past 15 years; this time frame allows us to see the curve’s movement leading up to the last recession.
Perhaps the most widely followed curve, the 10 year versus the 2-year spread, is also at levels it has not seen since 2007. Although it is picking up slightly today as yields across the board fall, 2s10s is looking much more ominous at only 13 bps away from becoming inverted. This will be the main curve that investors will keep their eyes on; expect to see it ad nauseam in headlines if it moves those 13 bps lower.

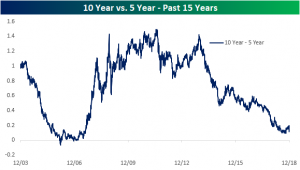
Shifting our focus to the longer end of the curve, spreads are off of lows from earlier in the year, but may not have quite bottomed just yet. The 10-year versus the 5-year spread has recently fallen back down towards these lows.
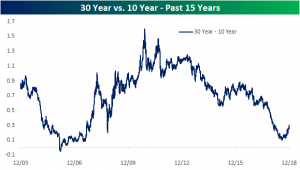
Even longer maturities like the 30-year versus the 10-year have a higher spread still and has much more clearly made a bottom. It is important to note, leading up to the previous recession this curve was not inverted for long. Most of the bottoming occurred with a normal—albeit very flat—curve.
Services Sector Continues to Hum Along
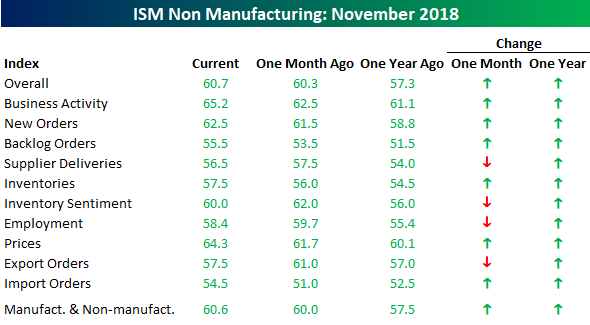
The ISM Non-Manufacturing report for the month of November showed that the services sector of the economy (the lion’s share) continues to hum along. While economists were expecting the headline index to come in at a level of 59.0, the actual reading stayed above 60, hitting a level of 60.7. What’s notable about this is that even though it is still off its highs from two months ago, the current string of back to back to back readings above 60 is the longest streak of 60+ readings since the survey began in 1997! On a combined basis and accounting for each sector’s share in the overall economy, the combined ISM for the month of November was 60.6, which is also among the highest readings on record.
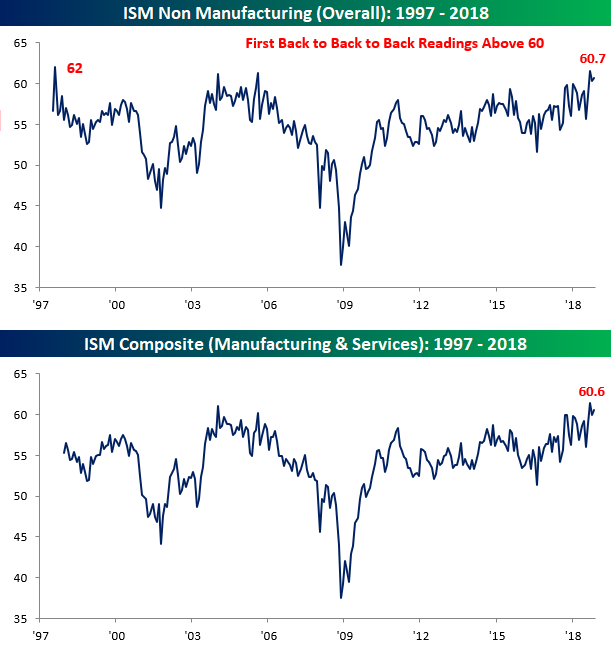
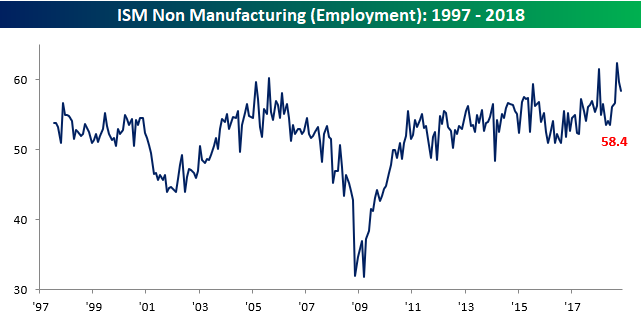
Breadth in this month’s report was somewhat mixed. Of the index’s ten sub-components, six were up in November and four were down, but all of them are still well above 50 – the threshold for growth. The key gainer on the month was Business Activity (top chart below table), which is back at its highest levels of the cycle, while one of the bigger disappointments to the downside was Employment, which has seen a bit of a reversal from its recent surge higher in the prior few months (lower chart).

Individual Investors Ironically Turn Bullish
This may be hard to believe after the past few days, but individual investors’ outlook on markets from the AAII survey actually saw a bump in bullish sentiment this week. Bullish sentiment rose for the second week in a row to 37.94% from last week’s 33.88%. This is off of one of the lowest readings of the year from only a few weeks ago.
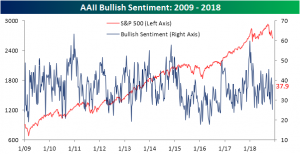
As always, as bullish sentiment rose, bearish sentiment took a hit returning back towards the historical average. Bearish sentiment fell to 30.5%. This is well off the high of 47.14% hit a couple weeks ago.

Neutral sentiment also saw a decent bump this week rising to 31.55%. Coming off of lows, this could indicate that investors are growing increasingly uncertain with how markets have performed recently.
As we mentioned last week, much of the more optimistic outlook from this week’s survey likely came as the result of Fed Chair Powell’s speech. Seeing as the survey polling closes Wednesday, this week’s results may not have fully taken into account Tuesday’s stock rout; just as last week’s survey likely did not take into account Powell’s speech. In other words, as the expected rise in bullish sentiment came this week, next week we should expect to see a rise in bearish sentiment especially if this price action keeps up.
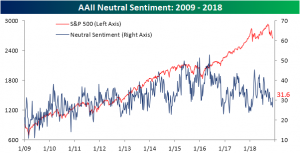
Chart of the Day – Big Downside Gaps Following a Big Decline
Morning Lineup – More Weakness
At least US stocks couldn’t go down yesterday. Equities are looking to open the day sharply lower on new concerns regarding the US-China relationship. Not helping matters is the fact that the latest round of US economic data that released this morning was disappointing as ADP Private Payrolls came in weaker than expected while Jobless Claims were a little higher than expected. Read today’s Bespoke Morning Lineup below for major macro and stock-specific news events, updated market internals, and detailed analysis and commentary:
Bespoke Morning Lineup – 12/6/18
The last thing you want to see the day after a 3%+ decline in the S&P 500 is another 1%+ decline at the open the following day, but that’s what today’s open is shaping up to be. In looking at the chart of the S&P 500 below, the fact that we were unable to hold above 2,800 for a third time on Monday is certainly a disappointment, but this latest swoon to the downside hasn’t violated any important levels as of yet. Even with today’s implied open, we still won’t be making any sort of lower low. That doesn’t mean things will not get worse going forward, but we just wanted to provide some perspective of where things stand now. As always, we’ll be watching some of our key internal indicators for any further clues.

Start a two-week free trial to Bespoke Premium to see today’s full Morning Lineup report. You’ll receive it in your inbox each morning an hour before the open to get your trading day started.

the Bespoke 50 — 12/6/18
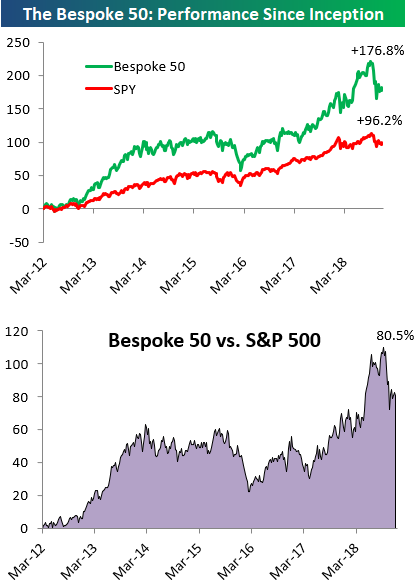
Every Thursday, Bespoke publishes its “Bespoke 50” list of top growth stocks in the Russell 3,000. Our “Bespoke 50” portfolio is made up of the 50 stocks that fit a proprietary growth screen that we created a number of years ago. Since inception in early 2012, the “Bespoke 50” has beaten the S&P 500 by 80.5 percentage points. Through today, the “Bespoke 50” is up 176.8% since inception versus the S&P 500’s gain of 96.2%. Always remember, though, that past performance is no guarantee of future returns.
To view our “Bespoke 50” list of top growth stocks, click the button below and start a trial to either Bespoke Premium or Bespoke Institutional.