B.I.G. Tips – Asset Class Performance by Weekday
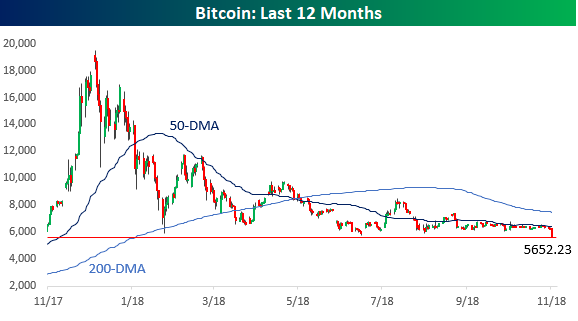
Bitcoin Breaks Down
It’s been a long 2018 for bitcoin, but because the price ran up so much towards the end of 2017 and into January, up until this point it stayed off the new low list even after losing more than two-thirds of its value. Partly because of lower numbers falling off and a 10% breakdown in prices today, bitcoin made its first 52-week low of 2018 today. What’s pretty amazing about the chart of bitcoin is how prior to today support at the $6K level was so strong. Once that support failed, though, prices fell fast.
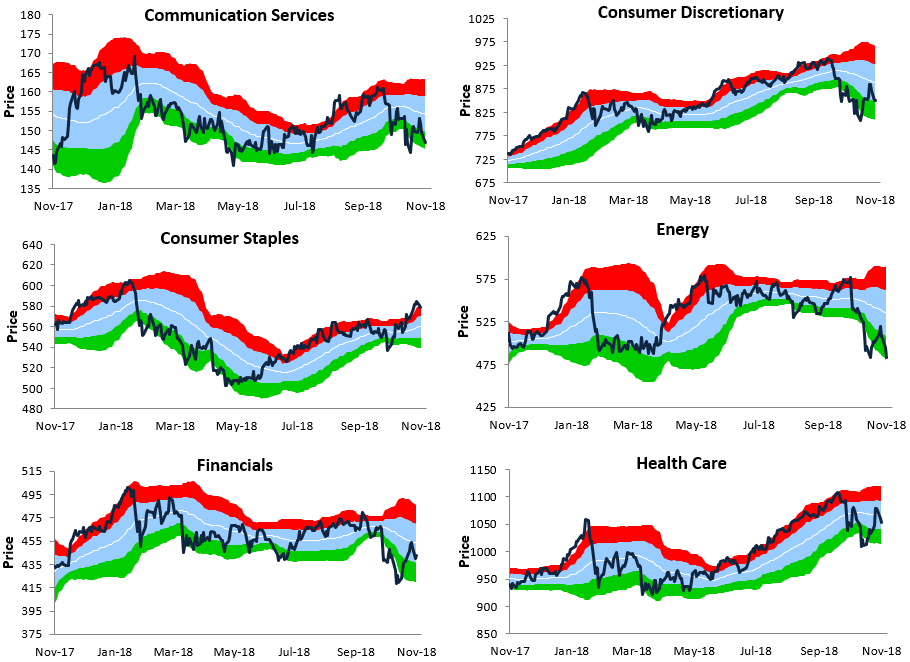
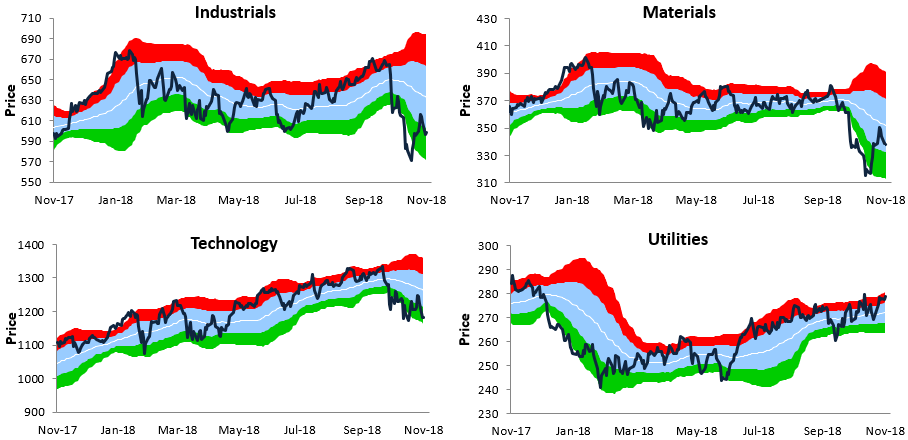
Bespoke’s Sector Trading Range Charts
Below is an updated look at our trading range charts for the S&P 500 and its major sectors (Real Estate not included). In each chart, the light blue shading represents the sector’s “normal” trading range, which is one standard deviation above and below the 50-day moving average (white line). The red zone represents overbought territory, which is between one and two standard deviations above the 50-DMA, while the green zone represents oversold territory.
As major indices have switched from trending higher to trending lower over the last two months, stocks are spending a lot more time in oversold territory. For the S&P 500, the index is back into oversold territory after failing right at resistance at its 50-day moving average. The technical set-up for the S&P is not good right now.

The only sectors with positive technicals right now are the two defensive sectors — Consumer Staples and Utilities. That should tell you something. The market is trading like we’re headed for an economic slowdown.
Morning Lineup – Friends Don’t Let Friends Buy Leveraged ETFs
Crude oil prices are trying to recover this morning as Natural Gas prices continue to go bananas. Equity futures are picking up steam to the upside, and CPI came in right inline with expectations.
With the surge in natural gas over the last couple of days and into this morning, one security that has been absolutely on fire over the last week is the Natural Gas Triple Leveraged ETN (UGAZ). While it was trading around $80 per share a week or so ago, it closed yesterday at $158 and is trading above $220 in the pre-market this morning. When you see moves like this in such a short period of time, it’s tempting for some to want to get in on the action.
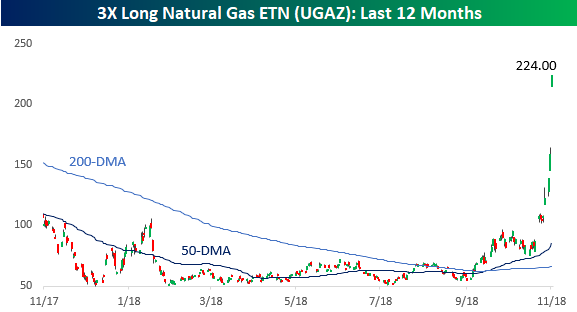
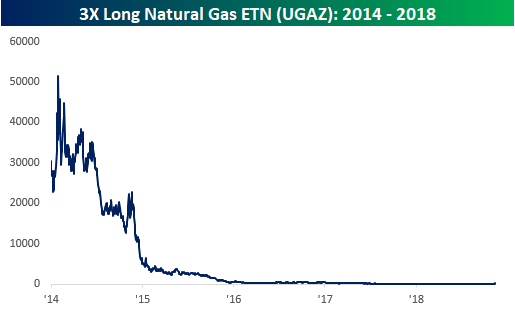
Besides the fact that these leveraged ETNs go down just as fast as they go up, it is important to remember that the way they are structured makes holding them for any extended period of time a sucker’s bet. Just take a look at the long-term chart of UGAZ below. After taking all of the reverse splits into account over the years, of which there were three (1-10, 1-25, 1-5), UGAZ’s price in early 2014 was over $50,000 per share. So, even though the price has tripled in the last two weeks, UGAZ is still down over 99.5% from its high less than five years ago. Next time you hear someone talk about buying one of these ETNs do them a favor and take their money instead.
Start a two-week free trial to Bespoke Premium to see today’s full Morning Lineup report. You’ll receive it in your inbox each morning an hour before the open to get your trading day started.

The Closer — Oil Bears, Dollar Soars, Hong Kong Band Plays On — 11/13/18
Log-in here if you’re a member with access to the Closer.
Looking for deeper insight on markets? In tonight’s Closer sent to Bespoke Institutional clients, we focus on crude oil’s recent plummet compared to other oil bear markets, our interest rate differential-based valuation of the US dollar, and finally how the dollar has stacked up against HKD.
See today’s post-market Closer and everything else Bespoke publishes by starting a 14-day free trial to Bespoke Institutional today!
Bespoke Stock Scores — 11/13/18
Oil Declining At Fastest Rate Since 2015 – 2016 Crash
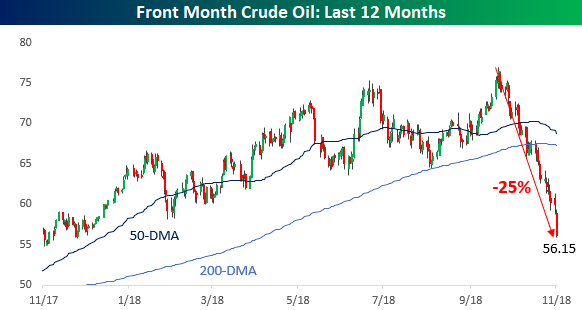
With a record losing streak and the pace of declines picking up steam to the downside, the recent decline in crude oil prices is starting to resemble the bust we saw three years ago. With today’s decline, crude oil prices have now given up over 25% since the early October peak and are within $2 of a 52-week low. Furthermore, because the 52-week low was all the way back November 2017, by the time we get to the end of the week, today’s prices will become the new 52-week low. That is unless we keep falling. Whatever happens from here, by this time next week the 52-week low in crude oil prices will shift from November 2017 to November 2018.
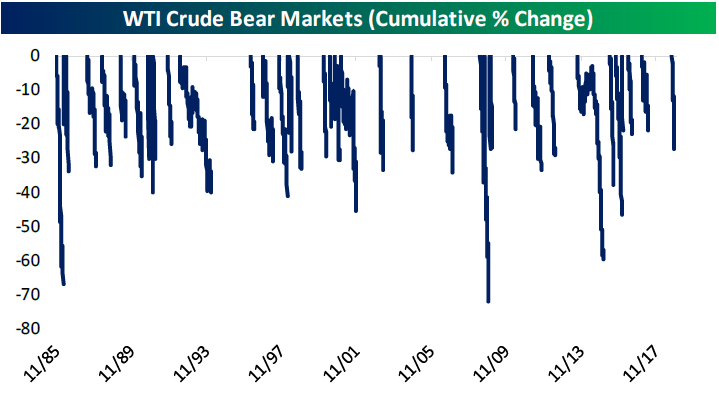
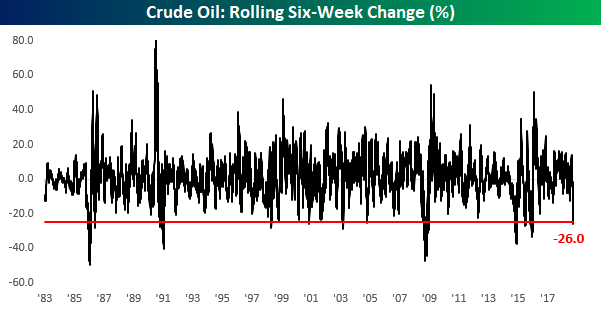
The fact that crude oil prices are down 25% 26% 27% in the last six weeks is notable due to the fact that it doesn’t happen all that often. As shown in the chart below, there have only been nine other periods going all the way back to 1983 where prices lost 25% or more of their value in 30 trading days with the last occurrence coming back during the crash in prices that spanned from mid 2014 through early 2016. Back then, the maximum decline over a six-week period was 37.5%.
While the current decline is the most severe six-week drop we have seen since the 2015/2016 crash in prices, the important thing to keep in mind is that this drop hasn’t been nearly as long. As shown in the chart below, the current decline in prices has only spanned 29 trading days. Three years ago, oil prices lost three-quarters of their value over the span of 415 trading days.
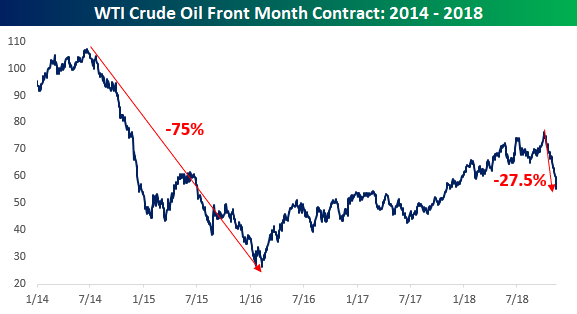

Chart of the Day – Failures at the 200-DMA
Bespoke’s Global Macro Dashboard — 11/13/18
Bespoke’s Global Macro Dashboard is a high-level summary of 22 major economies from around the world. For each country, we provide charts of local equity market prices, relative performance versus global equities, price to earnings ratios, dividend yields, economic growth, unemployment, retail sales and industrial production growth, inflation, money supply, spot FX performance versus the dollar, policy rate, and ten year local government bond yield interest rates. The report is intended as a tool for both reference and idea generation. It’s clients’ first stop for basic background info on how a given economy is performing, and what issues are driving the narrative for that economy. The dashboard helps you get up to speed on and keep track of the basics for the most important economies around the world, informing starting points for further research and risk management. It’s published weekly every Wednesday at the Bespoke Institutional membership level.
You can access our Global Macro Dashboard by starting a 14-day free trial to Bespoke Institutional now!

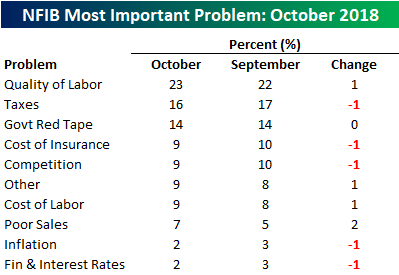
Small Business Sentiment Drops For Second Straight Month
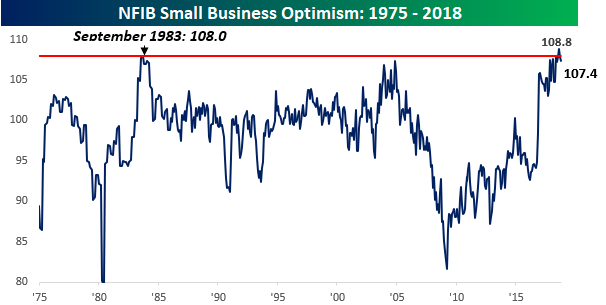
Small Business optimism in the US was weaker than expected in October (107.4 vs 108). After hitting a record high two months ago, the headline index has now declined for two straight months. We would note, however, that outside of 2018, there have only been four monthly prints going all the way back to 1975 where the headline index was higher. According to NFIB, current levels continue to support economic growth in excess of 3%, which is great for businesses and consumers, but not the best news for stock market bulls hoping for a more dovish FOMC. Two of the key stats of the report: 30% of business owners believe now is a good time to expand substantially and 38% of small business owners reported job openings that they couldn’t fill. The job market is definitely tight.
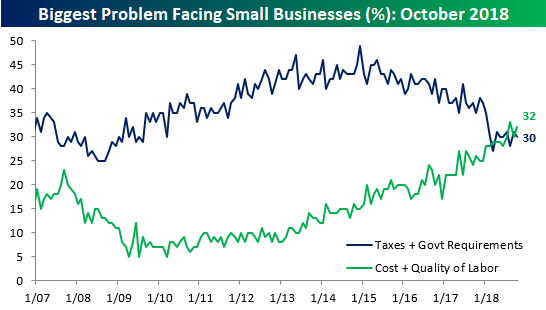
The tight labor market is also reflected in the fact that nearly a quarter of all small business owners report that Labor Quality is their number one problem and another 9% cite labor costs as their biggest problem. On a combined basis, labor issues were cited by just under a third of all small business owners, which is slightly more than the combined impact of Taxes and Red Tape.