Morning Lineup – Rush For the Exits
The highways will be crowded this evening as the Thanksgiving rush will begin in earnest, but this morning investors are rushing for the exits with Technology and Retail leading the way lower. Apple (AAPL) is trading down close to 3%, Facebook (FB) is under $130, and Nvidia (NVDA) is down another 5%. While NVDA’s decline is bad enough by itself it follows two days of trading where the stock was down 18% and 12%, respectively. Since early October, the stock is now down over 50%!
In economic data, Housing Starts for October actually came in right inline or slightly ahead of forecasts, which is a bit of a surprise given the very weak homebuilder sentiment report on Monday.
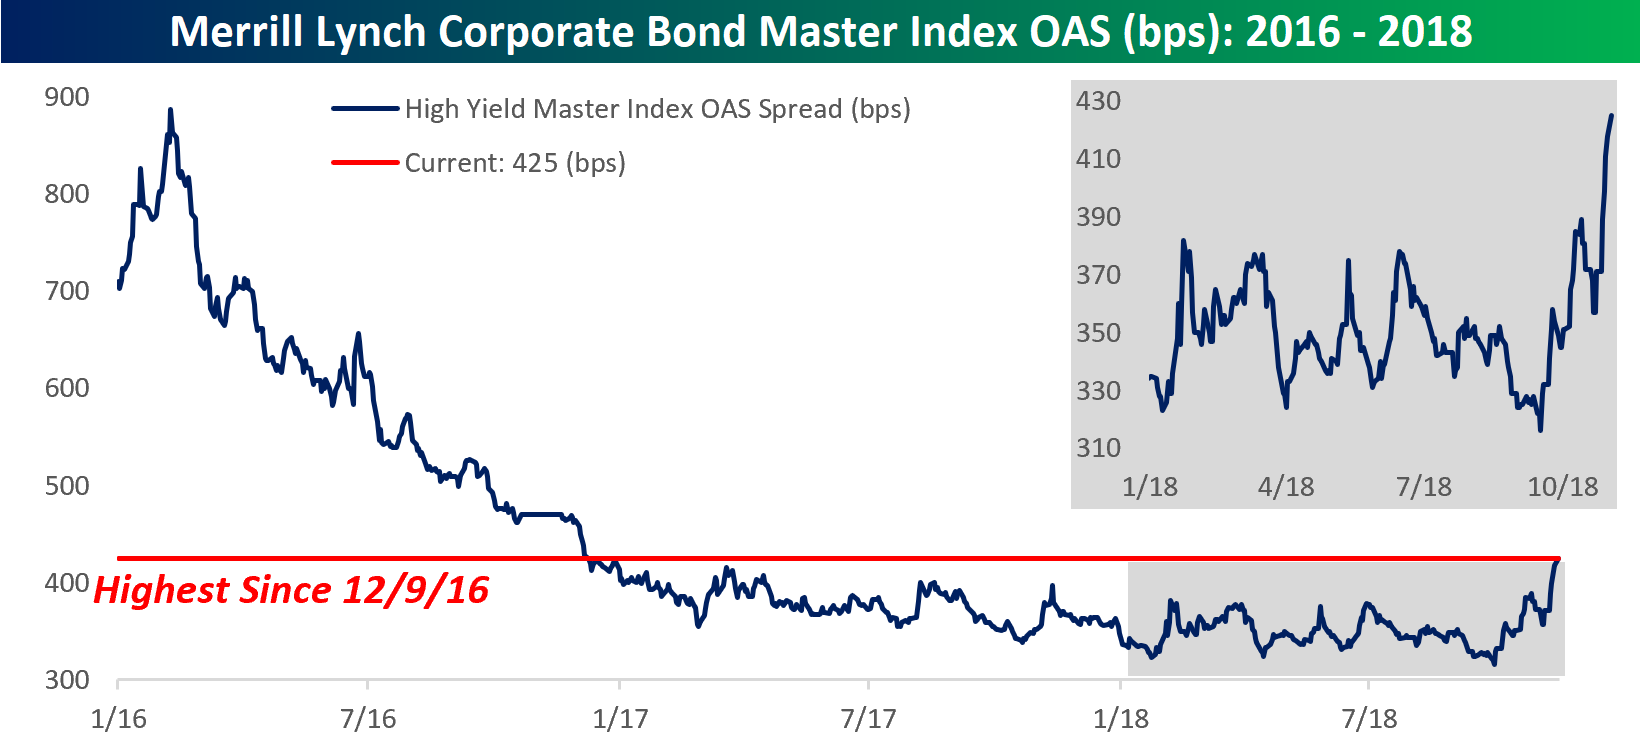
We often look to the high yield market for signs of confirmation of a move or divergences, and unfortunately for bulls, recent moves haven’t been positive. As shown in the chart below, after moving up and down within a range of 310 bps to 390 bps for much of the year, spreads have surged in the last several days to their current levels of 425 bps. That’s the highest level since December 2016, erasing nearly all of the narrowing that we saw in the thirteen months spanning the November 2016 election through early 2018. From the equity market’s perspective, this negative divergence suggests equity prices could be vulnerable to further weakness.
Start a two-week free trial to Bespoke Premium to see today’s full Morning Lineup report. You’ll receive it in your inbox each morning an hour before the open to get your trading day started.

The Closer — Net New Lows, EM Outperforms, Credit Availability — 11/19/18
Log-in here if you’re a member with access to the Closer.
Looking for deeper insight on markets? In tonight’s Closer sent to Bespoke Institutional clients, we review breadth in terms of net new 52 week highs and lows, rising implied correlations between the stocks in the S&P 500 index, accelerating relative performance of emerging markets, falling 10 year yields, and two large Federal Reserve quarterly data updates from last week.

See today’s post-market Closer and everything else Bespoke publishes by starting a 14-day free trial to Bespoke Institutional today!
Square (SQ) Finally Meets Its 200-DMA
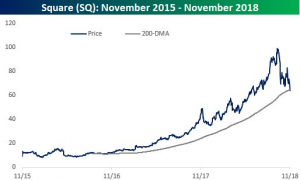
The payment and point-of-sale solutions company loved by small businesses, Square (SQ), did something today that it has not done in over two years and only done once before in the stock’s history: it closed below its 200-day moving average. Three years to the date of its IPO, SQ fell 10.74% today to drop to $62.97. Today’s decline has brought the stock 37.8% off of its high from October 1st of this year. This drop has also brought it well below support in the mid $60’s from the final days of October. It is safe to say that Square’s fantastic uptrend since its IPO has finally been broken.
Earnings and Holidays May Not Help Retail
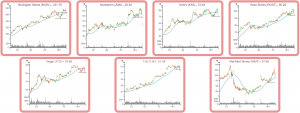
In recent weeks, discount retail stores of the likes of TJX Companies (TJX), Burlington Stores (BURL), Kohl’s Corp. (KSS), and Target (TGT) have gotten crushed. Today alone, Target (TGT) fell 2.4%, BURL fell 3.2%, and TJX fell almost 5%. Earlier in the month, these retailers had reached or came close to 52-week highs only to fall in dramatic fashion; some, like TJX, into correction territory (down +10% from highs). These companies are major retail chains focused on discount clothing and home furnishings, so headed into the holiday season, you may expect better performance of these names. But historically, it is a coin flip. They only see positive returns around half the time from now through the rest of the year. Kohl’s (KSS) is the most frequently positive merely at 53.85%; conversely, TGT underperforms the most as it is positive only 41.67%. Again, it is a coin flip so it is hard to say that the holidays necessarily help the stocks. As you can see in the charts below from our Chart Scanner tool, even from a technical standpoint, the picture is not great with these names having fallen through recent support levels.
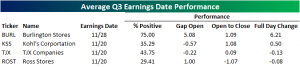
Like many things in the markets recently, finding a reason for the drop is hard to do. Looking to another major retailer, last week we saw Nordstrom (JWN) drop big on a weak earnings report, but the recent declines in these discount names cannot be blamed on poor earnings—they have yet to report. Over the course of the next few days, these names’ Q3 reports will begin to roll in. These names typically see worse performance in reaction to their Q3 earnings compared to other periods. In total, these retailers are positive around half the time in the day following earnings, but in response to Q3 earnings, with the exception of BURL, this group is less frequently positive. BURL looks the best rising on average 6.21% for the full day after earnings. The next best is a long way down with Kohl’s (KSS) only rising an average 0.5%. TJX and ROST, on the other hand, typically experience losses.
Bespoke’s S&P 500 Sector Weightings Report — November 2018
S&P 500 sector weightings are important to monitor. Over the years when weightings have gotten extremely lopsided for one or two sectors, it hasn’t ended well. Below is a table showing S&P 500 sector weightings from the mid-1990s through 2016. In the early 1990s before the Dot Com bubble, the US economy was much more evenly weighted between manufacturing sectors and service sectors. Sector weightings were bunched together between 6% and 14% across the board. In 1990, Tech was tied for the smallest sector of the market at 6.3%, while Industrials was the largest at 14.7%. The spread between the largest and smallest sectors back then was just over 8 percentage points.
The Dot Com bubble completely blew up the balanced economy, and looking back you can clearly see how lopsided things had become. Once the Tech bubble burst, it was the Financial sector that began its charge towards dominance. The Financial sector’s sole purpose is to service the economy, so in our view you never want to see the Financial sector make up the largest portion of the economy. That was the case from 2002 to 2007, though, and we all know how that ended.
Unfortunately we’ve begun to see sector weightings get extremely out of whack once again.
If you would like to see the most up-to-date numbers for S&P 500 sector weightings, simply start a two-week free trial to our Bespoke Premium or Bespoke Institutional services. Click back to this post to see the numbers once you’re signed up!

Best Stock Market Returns for a US President Since…Obama
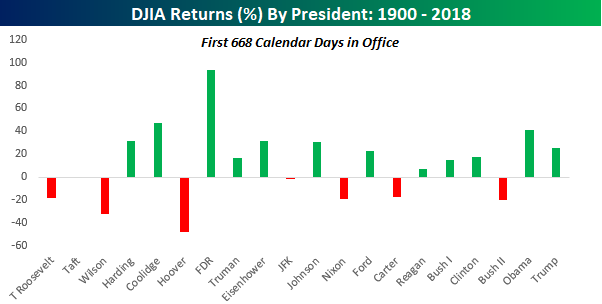
It may sound hard to believe, but for all the talk about how well the stock market has done under President Trump, the Dow Jones Industrial Average (DJIA) is actually up less (25.69%) since he took office than it was under President Obama (40.94%) at the same point in his Presidency! The chart below shows the DJIA’s historical returns during each US President’s first 668 calendar days in office going back to 1900. With a gain of 25.7%, the DJIA’s performance during President Trump’s first 668 calendar days in office is still well above the historical average for all US Presidents (15.59% – see table below) and even better when you compare it to just Republican Presidents (11.09%).
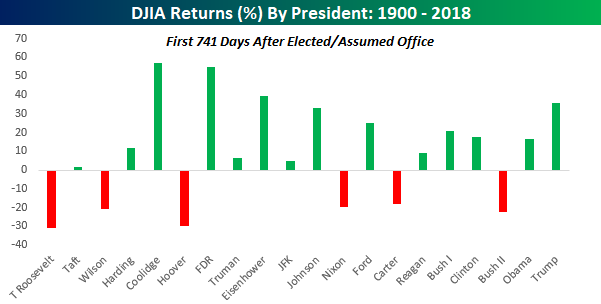
Looking at just the market’s performance since each President took office, however, may be considered a bit misleading given the fact that the market also tends to react swiftly once a President is elected. Based on this measure, even after the recent pullback in stock prices, the DJIA’s returns since President Trump was elected until now (741 days) are still the best since Eisenhower and more than twice the returns of Obama at the same point following his election in 2008.
In the table below, we have listed the DJIA’s returns for each US President since 1900 in both their first 668 days in office as well as the first 741 days after they were elected or assumed office. In the case of Presidents who weren’t elected, we used the date they first assumed office as the starting point for each period. Obviously, no method of measuring stock market returns is perfect and a lot of the rankings often are impacted by the political bias of the person reporting them. In terms of the charts above, Republicans will likely dismiss the first and focus on the second, while Democrats will do the opposite. As an investor, you should pay little attention. The basic takeaway here is that big moves over a short period of time can have a big impact on how the stock market supposedly views a President.
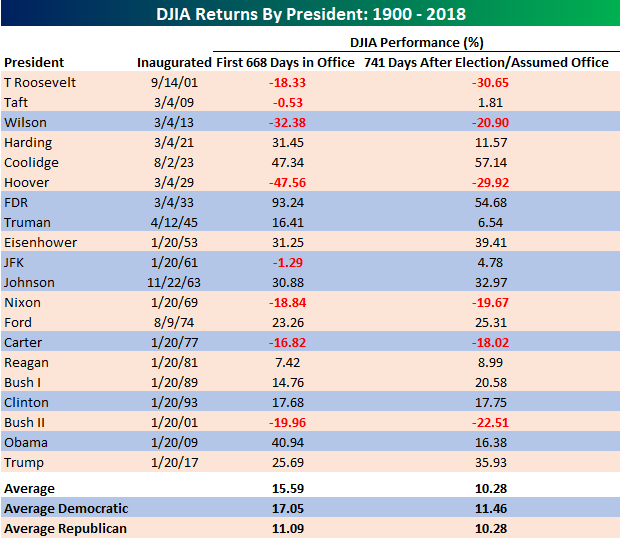
Chart of the Day: Fedspeak Shifts Into Dovish Territory
B.I.G. Tips – Housing Sentiment: Brutal
Trend Analyzer – 11/19/18 – Flat
This morning, our Trend Analyzer is more or less unchanged from this time last week. With the exception of the Nasdaq (QQQ), every major US Index ETF is in the same section of its trading range as five days ago. Along with QQQ, the Micro-cap ETF (IWC) is currently oversold while all others are unchanged at neutral. The Dow (DIA) has seen the largest downward movement within its trading range recently. It had been the only name above its 50-DMA, but with losses for a solid portion of last week, it has fallen closer to oversold. Despite this, unlike its peers, the ETF has still held onto its uptrend.

Morning Lineup – Quiet Start to a Quiet Week
It’s been a quiet start to what has historically been a quiet week, and the way things have been lately if this trend keeps up for the remainder for the day, that would be a win for the bulls. Pre-market equity futures are pretty much unchanged versus fair value on what has historically been the weakest day of the Thanksgiving week.
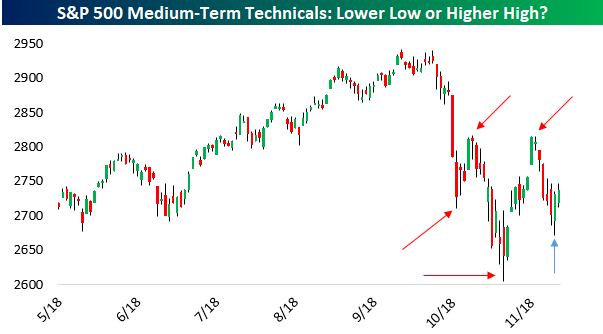
The most important question for technicians this week is whether the S&P 500 is poised to make a higher high or a lower low. As shown in the chart at left, the last two highs have been lower than the prior high (the most recent high was virtually the same, but slightly below, the prior one) while recent lows have been of the lower variety. Another lower low, in addition to a huge decline in percentage terms, would start to look pretty convincingly look like part of a new downtrend rather than a pullback in the broader bull market. A higher high, on the other hand, would be a signal that this drawdown was a sideways trend rather than a downward one and would do wonders for bulls’ confidence.
Start a two-week free trial to Bespoke Premium to see today’s full Morning Lineup report. You’ll receive it in your inbox each morning an hour before the open to get your trading day started.