Morning Lineup – Same Headlines as Yesterday
For the second day in a row, US equities are poised to open higher on positive trade headlines regarding the US and China. Hopefully today these gains can hold. The dollar is down, once again failing to break out higher from the top of its recent range, while interest rates are starting to firm up a bit with 1-2 bps of yield gains across the curve and a bias towards steepening. Crude oil is up a healthy 1.8% with gasoline rallying as well. Since OPEC announced output curbs last week, things have been mixed but generally positive for Texas Tea, with products basically staying on top of the raw oil price
Read today’s Bespoke Morning Lineup below for major macro and stock-specific news events, updated market internals, and detailed analysis and commentary:
Bespoke Morning Lineup – 12/12/18
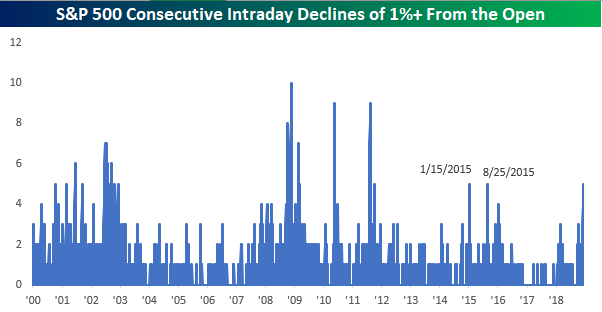
As mentioned above, the S&P 500 has had trouble lately holding onto gains. In fact, yesterday was the fifth straight trading day that the S&P 500 traded down 1% or more from its opening level at some point in the trading day. That doesn’t tend to happen often, and the last time we saw a similar string of consecutive intraday selloffs from the open was back in August 2015 when China devalued. We’re still far from really extreme levels in this streak, though. Back during the financial crisis, we saw ten straight days of similar intraday selloffs. Let’s hope we don’t get to that point.
Start a two-week free trial to Bespoke Premium to see today’s full Morning Lineup report. You’ll receive it in your inbox each morning an hour before the open to get your trading day started.

The Closer — Breadth Bombs, Reversing Reversals, Credit Considerations, PPI Solid — 12/11/18
Log-in here if you’re a member with access to the Closer.
Looking for deeper insight on markets? In tonight’s Closer sent to Bespoke Institutional clients, we cover how the market performs following intraday reversals as we have seen over the past few trading sessions. Then we discuss credit markets in depth in regards to bank loan ETFs, short-term interest rate markets, bank credit spreads, and macro data. We finish by going over today’s PPI release.

See today’s post-market Closer and everything else Bespoke publishes by starting a 14-day free trial to Bespoke Institutional today!
Chart of the Day: Fixed Income Extreme Overbought
Small Business Optimism Pulls Back
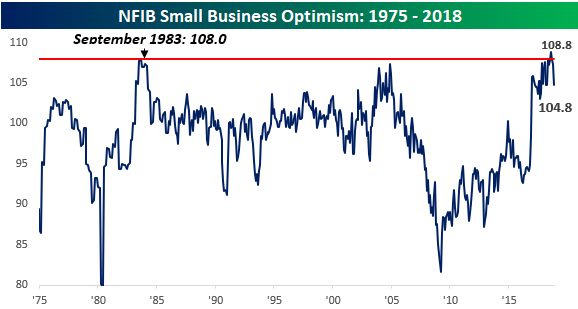
Small business optimism showed a meaningful pullback in November on both an absolute basis and relative to expectations. While economists were forecasting the headline index to come in at a level of 107.0, the actual reading was 2.2 points lower, making it the weakest report relative to expectations since April and the largest m/m decline since March.
After hitting record high levels back in August, the NFIB Small Business Optimism Index has now seen three straight monthly declines, and like a few other indicators, it’s showing signs of rolling over. With that, we’ve heard and read a number of comments suggesting that this decline is another signal that the business cycle may be turning.
In our section on “Economic Cycles” for this year’s 2019 outlook report that was published last Friday, we highlighted a number of economic indicators that have had pretty good records historically at anticipating a turn in the business cycle. One indicator that was not included in that section is the NFIB’s Small Business Optimism Index.
The chart below is the same one as above, but we have also overlaid periods of recession with gray shading. From this perspective, it is pretty obvious that there has been very little correlation to peaks in the Small Business Optimism Index and the onset of recessions. In fact, the two times the index peaked at or around similar levels was actually closer to the beginning of an expansion than the end. This is not to say that this indicator is suggesting strength or weakness in the economy going forward, but instead to simply point out that it hasn’t been the best indicator in terms of predicting the business cycle.
Which indicators should investors be watching for signs of a turn in the business cycle? Sign up today for our 2019 Annual Outlook Special to receive access to our section on “Economic Cycles” and find out!

Bespoke Stock Scores — 12/11/18
Morning Lineup – Positive Trade Headlines Provide a Boost
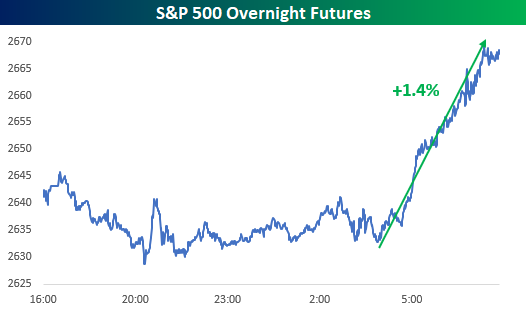
How many times can equity futures around the world rise and fall on the same headlines? We’re learning that lesson in real time these days, as US futures are rallying today on reports that China will cut tariffs on imported US autos from 40% down to 15% and that officials from both countries continue to negotiate despite the arrest of Huawei’s CFO in Canada. Believe it or not, futures were lower for most of the overnight session before getting a real boost right around 4 AM.
Read today’s Bespoke Morning Lineup below for major macro and stock-specific news events, updated market internals, and detailed analysis and commentary:
Bespoke Morning Lineup – 12/11/18
Start a two-week free trial to Bespoke Premium to see today’s full Morning Lineup report. You’ll receive it in your inbox each morning an hour before the open to get your trading day started.
Chart of the Day: Decile Analysis of the Correction
The Intraday Correction
A key characteristic of this correction during its early stages in late September and October was the unrelenting selling pressure that went on during regular trading hours. While futures were either flat or even pointed higher on a lot of trading days, the selling began pretty much immediately after markets opened at 9:30 AM ET and didn’t let up until the 4 PM close.
This type of intraday selling is not a bullish sign, so today we wanted to update the readings to see where things stand as the correction closes in on three months in length.
Below we show the cumulative change since 9/20 (the date of the high for the S&P) of buying SPY at the close every day and selling at the next open (after hours) versus buying at the open every day and selling at the close (intraday). If you only owned SPY after hours during the current correction, you’d actually be in the green with a gain of 1.1%. Had you only owned intraday by buying at the open and selling at the close, however, you’d be deep in the red with an 11.2% decline. This means that more than 100% of the S&P’s losses during the current correction have come during regular trading hours.
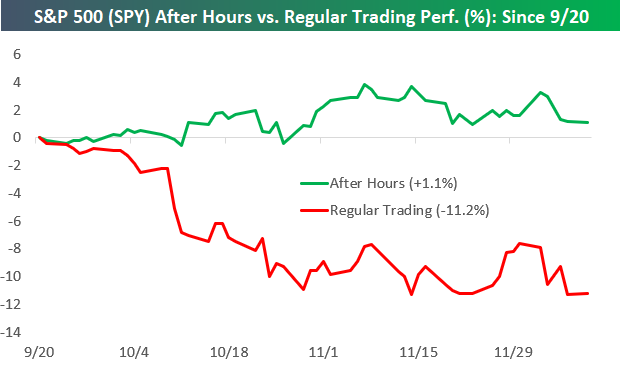
Looking at this strategy for all of 2018, had you only owned SPY after hours this year, you’d still be up 10.8%. If you only owned during regular trading hours, you’d be down 10.9%.
As you can see in the chart, there were two periods where these two strategies diverged. One came towards the end of Q1 into early Q2 when the after-hours strategy traded sharply higher as the intraday strategy plummeted. The second came at the start of the current correction when the intraday strategy started to collapse while the after-hours strategy continued to tick higher.

US Stock Market Performance During Years Ending In…
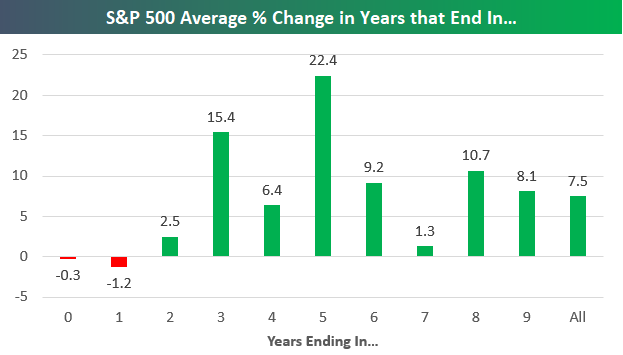
Below is a quick market stat to log as 2018 nears an end and 2019 approaches. In the chart, we show the S&P 500’s average price change in years ending in 0 through 9. This data goes back to 1928 when the S&P 500 begins.
As shown, years ending in “8” have historically seen the S&P 500 gain an average of 10.7%. At one point earlier in 2018, this type of gain seemed likely, but not anymore now that the S&P is down 2% YTD.
Years ending in “9” have historically seen an average gain of 8.1%, which is just a hair above the average of 7.5% seen for all years since 1928.
The best years have come in years ending in “5” with an average gain of 22.4%. Years ending in “3” rank second with a gain of 15.4%.
On the negative side, years ending in “0” and “1” have both averaged losses throughout history.
Below we show the consistency of positive returns for the S&P 500 in years ending in “0” through “9”. As shown, years ending in “5” have been positive 88.9% of the time (8 out of 9), while years ending in “0” and “1” have been positive just 44.4% of the time (4 out of 9).

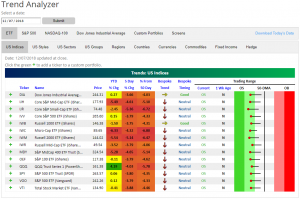
Trend Analyzer – 12/10/18 – YTD Gains Get Decimated
The major US index ETFs are starting off the week on a far weaker note following last week’s sell-off. Every ETF in this group has fallen over 3% since this time last week. The Russell 2000 (IWM) and Core S&P Small-Cap (IJR) have led the way down falling 5.14% and 5.36%, respectively. Despite attempting to press above their 50-day moving averages at one point last week, currently, these ETFs have collapsed well below their 50-DMAs into oversold territory. As YTD gains either turn to losses or become just barely positive, long-term trends have remained biased to the downside. The Nasdaq (QQQ) is the only ETF in the group that has maintained any sort of significant gains YTD.