Chart of the Day: Procter & Gamble (PG) Powers Higher
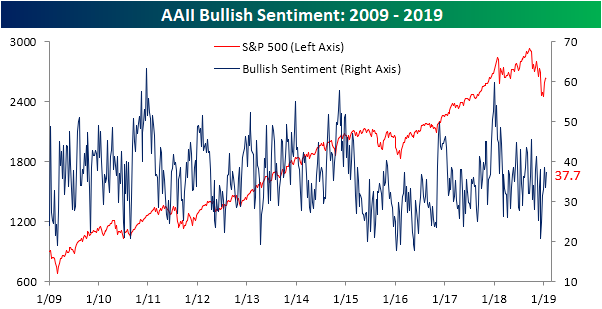
Individual Investors Bullish Again
Bullish sentiment ticked back up this week to 37.7% after falling to 33.5% last week. This comes as the S&P 500 has traded above its 50-DMA for a week now. The weekly investor sentiment survey conducted by AAII has come off of extremely low levels from the late 2018 sell-off and has maintained above 30% readings for all of 2019 so far. This jump in bullish sentiment is still slightly lower than the historical average and where we were only a couple weeks ago (38.5%).
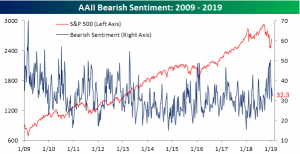
Bearish sentiment fell 4% this week down to 32.3%. Bearish sentiment has fallen off of extremely elevated levels following the Christmas Eve sell-off. While it has fallen, bearish sentiment remains above the historical average of 30.5%, though not by much.
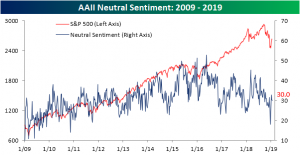
Neutral sentiment has remained essentially unchanged at 30% this week. Given this, the gain in the bullish camp seems to have entirely come from those with formerly pessimistic outlooks.
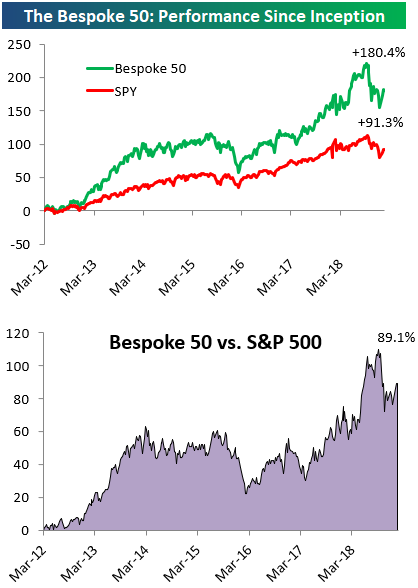
the Bespoke 50 — 1/24/19
Every Thursday, Bespoke publishes its “Bespoke 50” list of top growth stocks in the Russell 3,000. Our “Bespoke 50” portfolio is made up of the 50 stocks that fit a proprietary growth screen that we created a number of years ago. Since inception in early 2012, the “Bespoke 50” has beaten the S&P 500 by 89.1 percentage points. Through today, the “Bespoke 50” is up 180.4% since inception versus the S&P 500’s gain of 91.3%. Always remember, though, that past performance is no guarantee of future returns.
To view our “Bespoke 50” list of top growth stocks, click the button below and start a trial to either Bespoke Premium or Bespoke Institutional.
Jobless Claims: Mic Drop
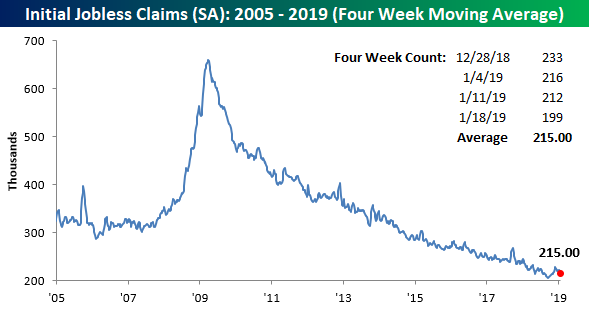
We’ve said it countless times over the last several years, and today we’re forced to say it again regarding jobless claims. Wow! This week’s report on first time claims not only came in lower than expected, but it also dropped below 200K to 199K. Not since November 1969 has a weekly jobless claims print come in with a ‘one’ handle. This week’s report represents a record 203 straight weeks that jobless claims have been at or below 300K, 68 straight weeks of at or below 250K readings, and finally one week below 200K!

With this week’s large decline in claims, the four-week moving average also dropped by over 5K to 215K. That’s still 9K above the multi-decade low of 206K from back in September, but it will continue to drop further next week as we are dropping another large weekly reading from the four-week count.
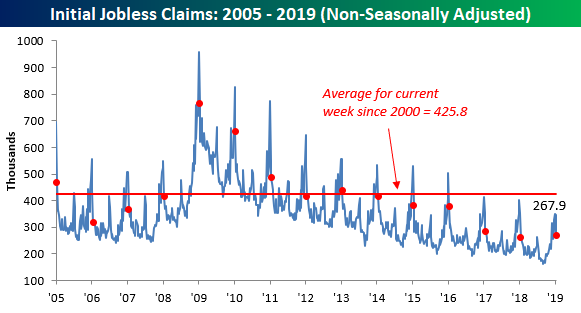
On a non-seasonally adjusted (NSA) basis, claims also saw a large decline falling to 267.9K. That’s more than 150K below the average of 425.8% for the current week of the year dating back to 2000, but it’s actually slightly higher than the reading for the same week last year (260.1K). So it’s the lowest seasonally adjusted reading in a half-century, but not nearly as extreme on an NSA basis.
Morning Lineup – Semi Rally Lifts Pre Market Futures
Semis were supposed to be out of favor, weren’t they? That’s not the case this morning, though, as positive earnings reports from Texas Instruments (TXN), Lam Research (LRCX), Xilinx (XLNX), and Teradyne (TER) are pushing the semiconductor group higher by over 2.5%. Read today’s Bespoke Morning Lineup below for major macro and stock-specific news events, updated market internals, and commentary.
Bespoke Morning Lineup – 1/24/19
The rally in US equities has taken a bit of a breather in the last couple of days as investors try to digest the gains off of the Christmas Eve lows. With the rally on pause for the time being, we wanted to take a quick moment to compare the performance of S&P 500 industries so far in 2019 (x-axis) to their performance in Q4 of 2018 (y-axis). While there are most certainly exceptions, there is a pretty clear trend where the areas of the market that worked in Q4 haven’t really worked all that well in 2019, whereas the industries that were the hardest hit in Q4 have outperformed so far in 2019.
A perfect example is the Energy Equipment Industry, which was the worst performing S&P 500 industry in Q4 (-38%) but has been the best performer so far this year (+16%). One exception? Technology Hardware. In Q4, the industry was down 29.5%, but this year it has also declined, falling 2%. You can thank Apple (AAPL) for that.

Start a two-week free trial to Bespoke Premium to see today’s full Morning Lineup report. You’ll receive it in your inbox each morning an hour before the open to get your trading day started.

Chart of the Day: Great Time for D.R. Horton (DHI)
B.I.G. Tips – The Best Performing Stocks on Q4 Earnings
Using our Earnings Screener tool, in our newest B.I.G. Tips report we highlight stocks that have historically performed extremely well in the immediate aftermath of their Q4 earnings report specifically.
To run the screen, we looked for S&P 1500 stocks set to report between now and early March that have historically averaged the biggest one-day gains in reaction to their Q4 earnings reports. To make the list, a stock had to have at least 8 years worth of Q4 reports.
We found 49 stocks (a surprisingly high #) across large, mid, and small caps in the S&P 1500 that have historically averaged a gain of 3.8%+ on their Q4 earnings reaction days. For whatever reason, these stocks have demonstrated an ability to post big gains when they report earnings at the start of every year.
To see our B.I.G. Tips report featuring the stocks that historically react the most positively to Q4 earnings, sign up for a monthly Bespoke Premium membership now!
Two Rally Laggards: Tobacco and Tech Hardware
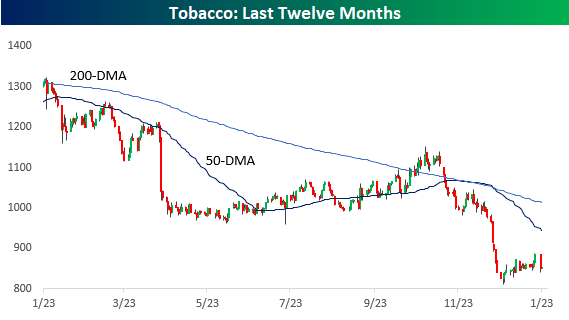
While just about every market group has seen a significant rebound off the Christmas Eve lows, two notable laggards have been Tobacco and Tech Hardware. These are two groups that you don’t normally associate with each other, but both have been profoundly weak over the course of the last few months.
After rallying nearly 9% from its lows, the Tobacco group is down over 4% this week after Altria (MO) was downgraded at Morgan Stanley on Tuesday due to concerns over changing smoking patterns, disruption in the space (marijuana and e-cigarettes), and increased regulatory risk. As the chart below shows, weakness for the Tobacco industry has been nothing new as the group did nothing but go down in the last year, falling over 34%, including an 18.1% decline in Q4. Regarding the Q4 decline, you may counter that the rest of the market was down big in Q4 as well. That’s true, but considering the fact that the group has always been considered defensive in nature, that kind of weakness is extreme. One big contributor to last year’s Q4 weakness was the fact that the company went out and took a 35% stake in e-cigarette maker Juul for $12.8 billion. We understand that desperate times call for desperate measures, and in the face of disruption companies need to be bold, but based on the terms of the investment, Altria valued Juul at $38 billion which is 45% of its current market cap!
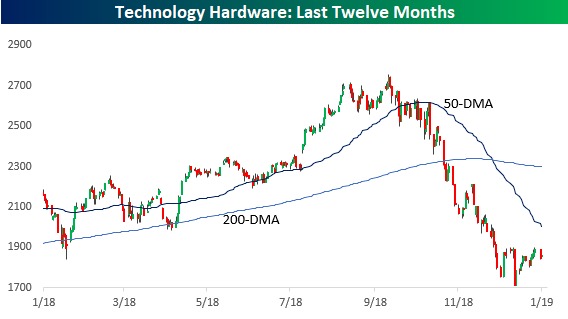
Tobacco has been no stranger to the 52-week low list over the last year or so, but in recent months it has found a new roommate in Technology Hardware. This group has seen an epic fall from grace of the last six months quickly turning from market leader to laggard. From its high in late-September, this group has lost more than a third of its value, and while more than one stock has contributed to the decline, the big driver has been Apple (AAPL), which is down close to 40%. Apple doesn’t make cigarettes, and its iPhones are still in much higher demand than a pack of smokes, but like the problem of weaker demand for Altria, sales of iPhones have been slowing as investors have been holding on to their phones longer in response to higher prices. Ironically enough, in the wake of Apple’s decline, it now trades at just about the same valuation as Altria in terms of their P/E ratios. One key difference, however, is that while Apple’s dividend yield of 1.92% is slightly below the S&P 500’s yield of 2.02%, Altria has a yield of 7.1%!
Fixed Income Weekly – 1/23/19
Searching for ways to better understand the fixed income space or looking for actionable ideals in this asset class? Bespoke’s Fixed Income Weekly provides an update on rates and credit every Wednesday. We start off with a fresh piece of analysis driven by what’s in the headlines or driving the market in a given week. We then provide charts of how US Treasury futures and rates are trading, before moving on to a summary of recent fixed income ETF performance, short-term interest rates including money market funds, and a trade idea. We summarize changes and recent developments for a variety of yield curves (UST, bund, Eurodollar, US breakeven inflation and Bespoke’s Global Yield Curve) before finishing with a review of recent UST yield curve changes, spread changes for major credit products and international bonds, and 1 year return profiles for a cross section of the fixed income world.
This week we take a look at the options market for large cap ETFs.

Our Fixed Income Weekly helps investors stay on top of fixed income markets and gain new perspective on the developments in interest rates. You can sign up for a Bespoke research trial below to see this week’s report and everything else Bespoke publishes free for the next two weeks!
Click here and start a 14-day free trial to Bespoke Institutional to see our newest Fixed Income Weekly now!