Semis Hold Support
Yesterday’s earnings warning from Nvidia (NVDA) caught the overall semiconductor group by surprise. After a nice rally off the lows in late December, the group had really stabilized in recent weeks, but the warning and NVDA’s subsequent 15%+ decline at the open threatened the fragile recovery. While the group finished down on the day, things didn’t get much worse after the opening bell. As shown in the chart below, while the group opened weaker, it held support at the short-term uptrend off the December lows and finished the day up nearly 2% from its early lows.

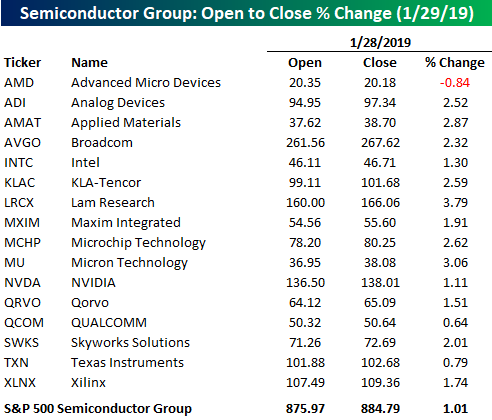
The same can be said for just about every stock in the semiconductor group. The table below shows the open to close percentage change for each of the sixteen stocks in the S&P 500 Semiconductor and Semiconductor Equipment Index. Of the 16 stocks listed, the only one that finished the day lower than it opened was AMD, and the other 15 stocks in the group actually rallied slightly more than 2% from their prices at the opening bell.
Trend Analyzer – 1/29/19 – Pulling Back
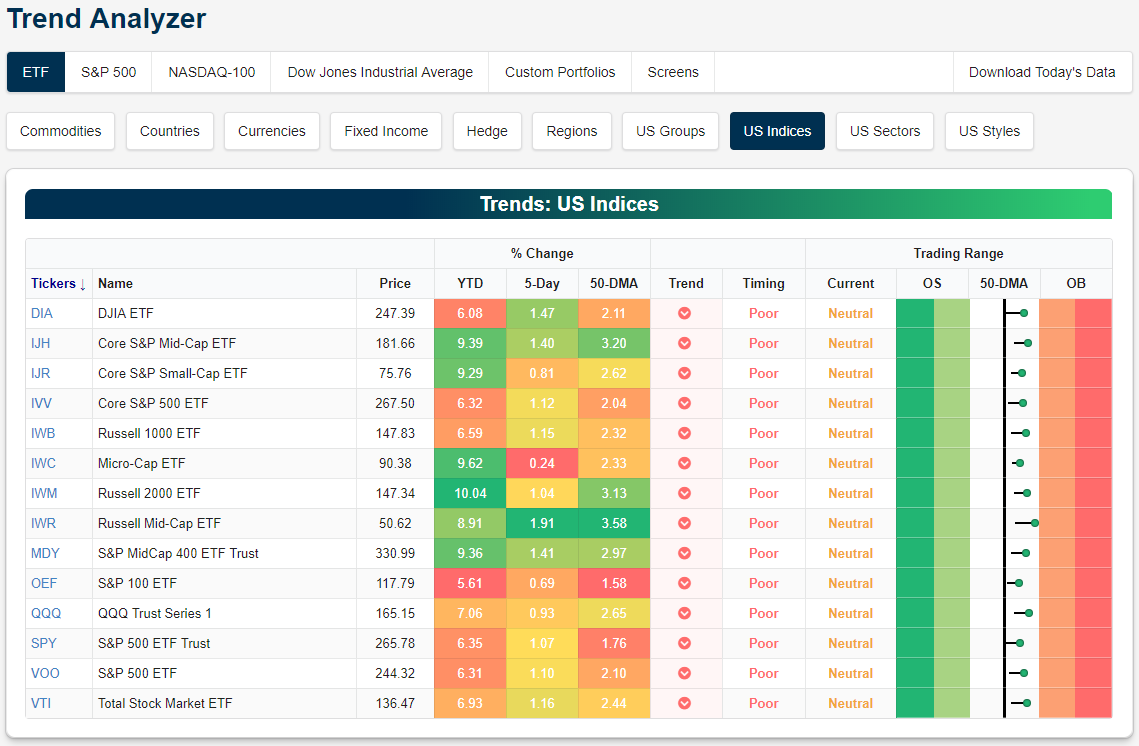
Upward momentum has somewhat faltered in the past week as the S&P 500 continues to attempt to break out of its several month long downtrend. The S&P 500 ETFs (SPY and VOO) are both down over 1% in the past week. In fact, each major index ETF, except for the Russell Mid-Cap (IWR), is now down over the past week; ranging from just barely negative to sizable losses. The mid-caps continue to show the most relative strength (IWR, IJH, and MDY). Conversely, the large cap S&P 100 (OEF) has taken it on the chin and is now down 1.45% in the past five days. The Nasdaq (QQQ) and Micro-Cap (IWC) are not much better, with each down over 1%. Despite these losses and while they all still remain in downtrends, the indices have held firm in neutral territory and above their 50-DMAs.

Morning Lineup – Shaking Off Bad News
The pace of earnings reports continues to pick up steam, and what we’ve seen in many instances so far is an ability by the market to shake off weakness. The latest example today is 3M (MMM), which reported weaker than expected EPS and revenues and also lowered guidance. So, how much is MMM trading down in the pre-market? It’s actually up 2.5%. Overall, this earnings season we have also seen a trend where companies beating EPS forecasts are being rewarded considerably more in magnitude than companies who are missing EPS forecasts are being punished. In the last two weeks, the 129 companies that have reported better than expected EPS are up an average of 2.5% on their earnings reaction days, while the 60 companies that have missed EPS forecasts have declined just 1.6% Read today’s Bespoke Morning Lineup for more on what’s driving the markets this morning.
Bespoke Morning Lineup – 1/29/19
After yesterday’s warnings from Nvidia (NVDA), there’s been some dueling analyst commentary in the stock this morning. While UBS upgraded the stock to a buy rating, both Morgan Stanley and Needham downgraded the stock. Needham even thinks the stock could drop below $100. While the analysts disagree on NVDA, the semis held up reasonably well yesterday given the warning. As shown in the chart below, while the group opened weaker on the day yesterday, it held support at the short-term uptrend off the December lows and finished the day up nearly 2% from its early lows.

Start a two-week free trial to Bespoke Premium to see today’s full Morning Lineup report. You’ll receive it in your inbox each morning an hour before the open to get your trading day started.

B.I.G. Tips — Apple (AAPL), Amazon (AMZN), Facebook (FB) to Report This Week
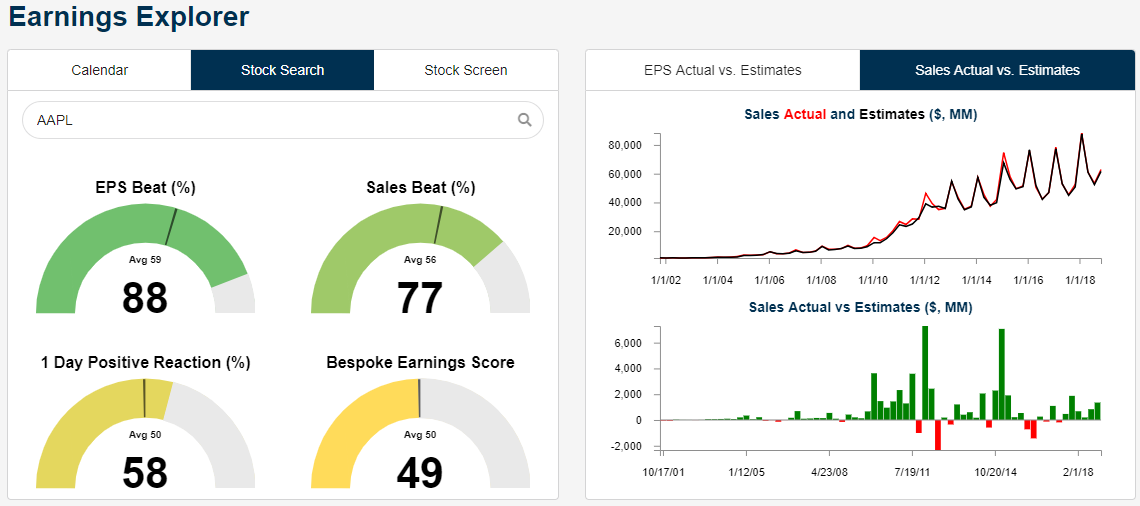
In this B.I.G. Tips report available to Bespoke Premium and Bespoke Institutional members, we take a deep dive into historical earnings reports for Apple (AAPL), Facebook (FB), and Amazon.com (AMZN), all of which are reporting earnings over the next three days. Below is an example of what we’re analyzing in this report. We look at historical beat rates, guidance, and how these three FAANG stocks typically perform in reaction to their Q4 earnings reports.
To unlock the full report, start a two-week free trial to either Bespoke Premium or Bespoke Institutional.

Chart of the Day: Positive Volume Explodes
Last Hour Strength – Welcome Back!
We’ve been discussing the market’s recent tendency to rally in the last hour of trading numerous times in the last few weeks. To summarize, in the 21 trading days since Christmas, the S&P 500 has been up in the last hour of trading 15 times! With a slight decline in the last hour of trading last Friday, the 20-day rolling total of positive last hours as of Thursday’s close was even stronger as the S&P 500 was up in the final hour of trading 75% of the time. Strength in the last hour of trading is generally considered a bullish trend as it signals that investors aren’t worried about the overnight risk of being long equities while the market is closed.
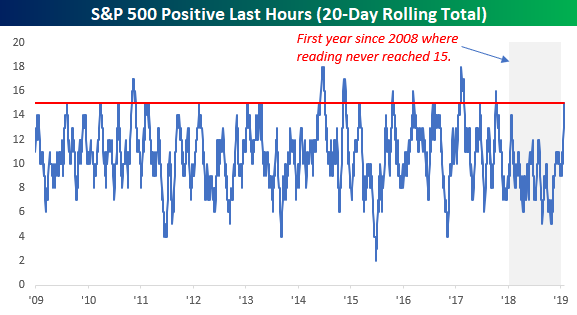
The fact that we have seen such consistent strength in the last hour has been a change of pace for the market based on recent trends. From a longer-term perspective, though, such strength is not uncommon. The chart below shows the rolling 20-day total of the number of days where the S&P 500 saw positive returns in the last hour of trading. Before the most recent occurrence, the last time the percentage of days with positive last hours reached 75% or more over a 20-trading period was in October 2017. That’s a pretty long gap without any occurrences, but when you look back over time, this long of a gap was more of the exception than the rule. In fact, before 2018 the last time that the 20-day rolling total of positive last hours never reached 15 in a calendar year was in 2008.
This Week’s Economic Indicators – 1/28/19
Economic data was light last week with just 10 releases (Durable Goods and New Home Sales did not release due to the shutdown); half of which came in worse while the rest came in at or above forecasts. After the MLK Jr. holiday Monday, we came back Tuesday to a poor reading in existing home sales which missed by the widest margin since November of 2015. More in housing data, alongside an uptick in FHFA House Prices was a decline in mortgage applications, although they were still strong. Wednesday’s Richmond Fed improved versus December but was still negative. Markit released their preliminary January PMIs on Thursday with a stronger reading, especially relative to weak global numbers released that same morning. Thursday’s report on Leading Indicators showed a slight decline (-0.1%) but was right inline with expectations.
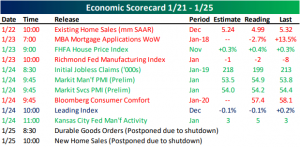
This week activity picks up in a big way with over 30 indicators scheduled for release. Of note, today we get regional Fed activity indices. The Chicago Fed printed its first back to back monthly increase since October 2017. Meanwhile, the Dallas Fed came in stronger at +1 vs -2.1 forecasts. Those activity numbers will be followed up with the first release of Q4 GDP data and an FOMC rate decision (no change is expected) on Wednesday. After Chicago PMI and weekly jobless claims are released on Thursday, the nonfarm payrolls report for January will hit the tape at 8:30 AM ET on Friday.

Last week added two releases to the long list of 26 data points that have been postponed due to the closure of the government organizations responsible for the releases. Thankfully, we should return back to normal next week (no releases have yet to be rescheduled for this week) after lawmakers in Washington agreed to re-open the government last Friday afternoon. With the government re-opened, it is not as though all of the reports listed below will be released immediately. Depending on the department that collects the data, the schedule for release will vary. In some cases, the missed reports will be released on the same day of the next release, while preliminary will not be released at all.
At 34 days long, this shutdown far surpassed the previous record for longest shutdown (21 days) in 2013. The December readings on preliminary Durable Goods Orders and New Home Sales both were scheduled to be released Friday. For these two indicators, we are now missing their November and December data which is why there is no entry for the estimate and last reading of these indicators. These are not the only indicators to have missed two releases. Wholesale Inventories and the Trade Balance, for example, have missed preliminary and final outputs.

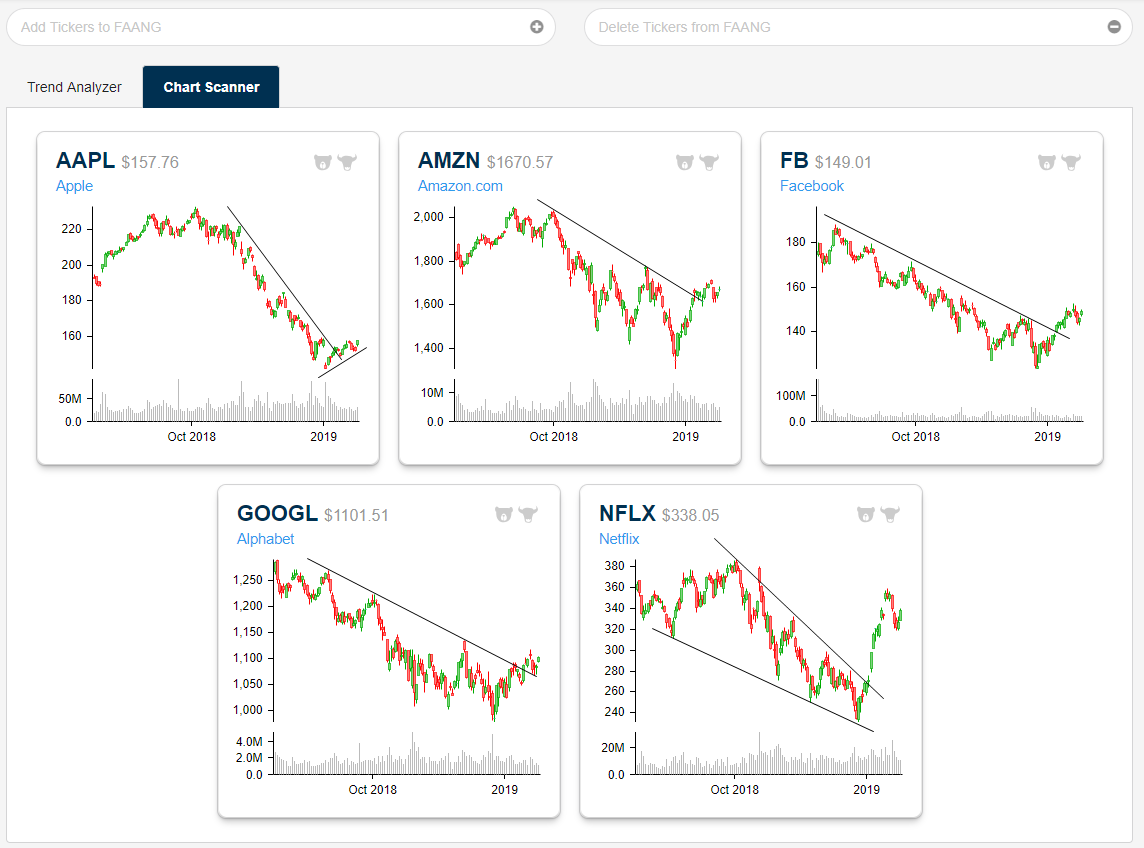
FAANG Chart Scanner Snapshot
Bespoke recently launched a new interactive research portal for subscribers. Along with an amazing new search feature that lets investors easily look up individual stocks and ETFs, we also have a revamped reports section, a brand new interactive tools section, and a custom portfolios section!
Our original and timely research reports continue to make up the backbone of Bespoke’s service, but as we grow, our goal has been to give subscribers access to more of the unique investment tools that we use internally.
If a subscriber wants to monitor charts for a basket of stocks or ETFs, it’s now simple to set up a custom portfolio that updates chart patterns for these specific tickers on a daily basis. You can view all of these charts on one page for quick and easy viewing.
Below we’ve taken a snapshot from our new portal of a FAANG custom portfolio we created. (Subscribers — go to the “Custom Portfolios” section to do this.)
As you can see, the FAANG stocks have all recently made strides in breaking the long-term downtrends that formed in Q4 2018. This is a bullish first step, but they still have a lot of work to do if they’re going to form new uptrends.
To try out Bespoke’s new interactive research portal, start a two-week free trial to either our Bespoke Premium or Bespoke Institutional membership levels.
Trend Analyzer – 1/28/19 – Almost Overbought
Every major US index ETF is starting the trading week in neutral territory just above its 50-day moving average. With equity futures pointed lower, however, the week may be setting up for a number of tests of support at the 50-day, especially for large-cap indices like the S&P 500 (SPY) and the Dow 30 (DIA).
Note that every ETF listed in the snapshot from our Trend Analyzer tool below is now up more than 5% on the year. The small-cap Russell 2,000 (IWM) is up the most YTD at 10.04%, while the large-cap S&P 100 (OEF) is up the least at 5.61%.
While the small-cap Russell 2,000 (IWM) is up the most year-to-date, the Russell Mid-Cap ETF (IWR) is the most extended above its 50-day moving average at +3.58%.
Morning Lineup – CAT Bites
Equities aren’t kicking off the week on a positive note, and if this morning’s earnings report from Caterpillar (CAT) is any indication, the busiest week of earnings season could be a long one. CAT had its biggest earnings miss in ten years this morning. It was also the first time that the company missed EPS and revenue forecasts as well as lowered guidance in the same report for the first time since October 2013. Read today’s Bespoke Morning Lineup for more on what’s driving the markets this morning.
Bespoke Morning Lineup – 1/28/19
While equities are poised to open the week on a negative note, this year it all comes down to the actual trading day. As shown in our updated chart comparing the S&P 500’s intraday pattern in the period from 9/20 through 12/24 to the days since then, the last 21 trading days have been characterized by steady buying throughout the trading day, especially during the last hour of trading. Can the last hour bail out the bulls again today?

Start a two-week free trial to Bespoke Premium to see today’s full Morning Lineup report. You’ll receive it in your inbox each morning an hour before the open to get your trading day started.