The Closer — St. Valentine’s Retail Massacre — 2/14/19
Log-in here if you’re a member with access to the Closer.
Looking for deeper insight on markets? In tonight’s Closer sent to Bespoke Institutional clients, we begin by examining the market’s impulsive reactions to headlines on the government shutdown. Amid shortages of the metal, we then look at the surge in palladium prices. Next, we put into perspective what Initial Jobless Claims’ 4 week moving average hitting a 52-week high means. We then provide a look at port traffic numbers which showed exports fall while imports rose. We finish by breaking down all of the reasons to have a degree of skepticism in regards to today’s brutal retail sales report.

See today’s post-market Closer and everything else Bespoke publishes by starting a 14-day free trial to Bespoke Institutional today!
Bespoke’s Sector Snapshot — 2/14/19
We’ve just released our weekly Sector Snapshot report (see a sample here) for Bespoke Premium and Bespoke Institutional members. Please log-in here to view the report if you’re already a member. If you’re not yet a subscriber and would like to see the report, please start a two-week free trial to Bespoke Premium now.
In this week’s Sector Snapshot we note extremely strong readings in the percentage of stocks trading above their 50-day moving averages, as shown in the chart below.

To find out what this means and to see our full Sector Snapshot with additional commentary plus six pages of charts that include analysis of valuations, breadth, technicals, and relative strength, start a two-week free trial to our Bespoke Premium package now. Here’s a breakdown of the products you’ll receive.
Growing Caution in Individual Investors
Sentiment pulled back slightly this week but has maintained a fairly optimistic attitude as seen through the weekly AAII survey data. Bullish sentiment fell to 35.1% from a recent high of 39.87% last week. While that is below the historical average, it is well off of the lows of the past few months as markets sold off and is now sitting right in the middle of the range from 2018.
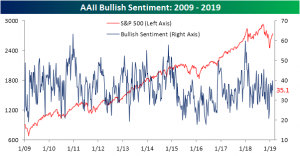
Bearish sentiment, on the other hand, remains at multi-month lows but picked up slightly this week. Pessimistic views rose to 25.07% from 22.78% last week. While these readings could seem concerningly low when looking at the past six months or so—meaning from a contrarian perspective it is due for a reversal—it is not necessarily a concern as it is only at a lower range than the indicator has been at for the better portion of the past few years.

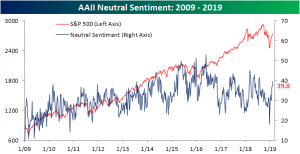
Meanwhile, neutral sentiment has picked up significantly in the past few weeks. This week’s reading of 39.82% is the highest since late July of last year. It is also the fourth consecutive week of an uptick in this sentiment reading. Since the market bottomed on Christmas Eve, neutral sentiment has increasingly become the majority sentiment reading from investors. In other words, as the market has rallied, investors have been less polarized between bulls and bears as they had been during the late 2018 volatility. Rather, investors seem to be a tad more cautious of the markets and have low expectations of bigger movements in either direction. Depending on whether or not a contrarian stance to the indicator is taken, the survey’s recent results have indicated more investors are expecting markets to rally or maintain these levels than continue the sell-off from late 2018.
Third Times the Charm for Cisco (CSCO)
Cisco (CSCO) reported after the close yesterday and exceeded both EPS and revenue forecasts while reiterating forward guidance. In response, the stock initially gapped up 2.84% and kept going from their hitting multi-year highs in the process. Since those highs shortly after the open, the stock has fallen quite a bit intraday but is still well above yesterday’s close. In the past year, the $49 level has proven to be tough resistance for CSCO. On October 3 of last year, the stock ran all the way up to a multi-year high of $49.47 before falling alongside the rest of the market for the next month. Afterward, CSCO attempted to retest these levels but fell short just over $49 in early December; once again collapsing with the rest of the market and finding a bottom on Christmas Eve. Since then, the stock has seen a considerable rally.
With earnings acting as a catalyst, the stock has finally regained all of these losses in the last quarter of 2018 and is looking at a break out once again. Even if the stock does not close above the highs today, it is certainly showing potential. As shown in the chart below, over the past few years, it has usually taken around three tests of prior highs for the stock to break out further.
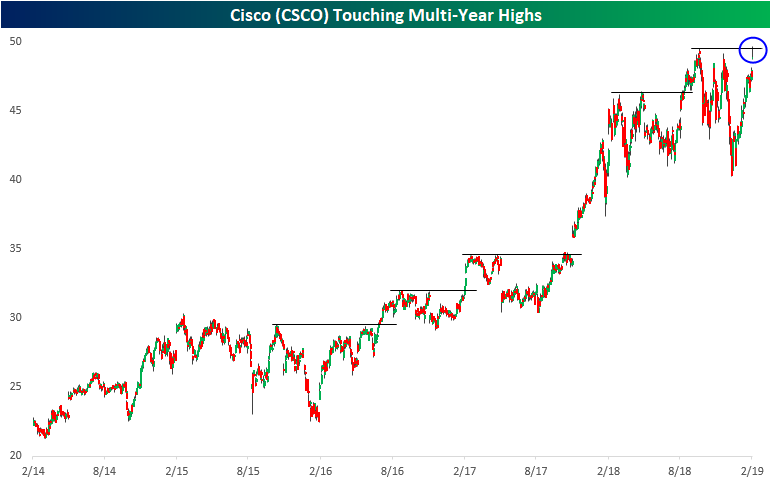
Chart of the Day: European Group Weights
the Bespoke 50 — 2/14/19
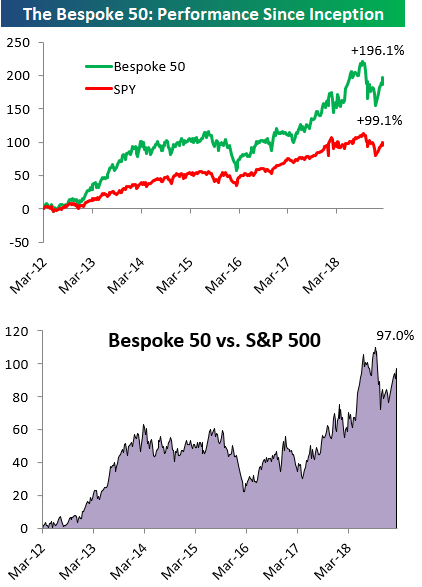
Every Thursday, Bespoke publishes its “Bespoke 50” list of top growth stocks in the Russell 3,000. Our “Bespoke 50” portfolio is made up of the 50 stocks that fit a proprietary growth screen that we created a number of years ago. Since inception in early 2012, the “Bespoke 50” has beaten the S&P 500 by 97.0 percentage points. Through today, the “Bespoke 50” is up 196.1% since inception versus the S&P 500’s gain of 99.1%. Always remember, though, that past performance is no guarantee of future returns.
To view our “Bespoke 50” list of top growth stocks, click the button below and start a trial to either Bespoke Premium or Bespoke Institutional.
B.I.G. Tips – Retail Sales: Better Never Than Late
Claims Tick Up Again
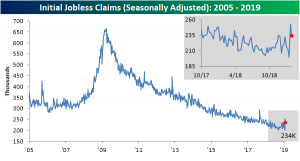
Initial Jobless Claims ticked up again this week after last week’s reading came down off of a recent high from the week prior. Since late last year, jobless claims have been fairly volatile with the seasonally adjusted number swinging from its lowest levels since the 60s all the way up to the aforementioned high which broke a historically long streak of strong readings. This week’s reading of 239K was a 4K increase from last week’s revised reading of 235K. While the reading is not a new high, it is at the upper end of the range that we have seen in the last year. Despite the uptick, this week’s data has maintained the streak of 206 weeks below 300K. While still healthy, several weeks of these spikes could be a sign of some cooling in what has been a historically hot labor market.
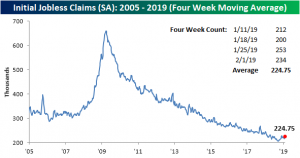
The four-week moving average—a less volatile measure of this indicator—confirms this. Over the past few months, claims by this measure bottomed out and have been consistently working their way upwards. This week’s 231.75K was the highest since the middle of January of last year. Looking to next week, assuming the indicator does not once again fall to the bottom of the range it has been in, the low of 200K from mid-January will roll off of the average likely leading to a further increase. While the horrible Retail Sales report for December is getting most of the attention, the uptick in the four-week moving average is more of a concern.
Unfortunately, the non-seasonally adjusted number does not provide much optimism either. Claims by this measure came in at 242.3K, which for the current week of the year is the highest since 2017’s print. As claims often have, this week is still well below the average for the current week of the year since 2000. That average is 368.84K, placing this week’s data over 100K below the average.

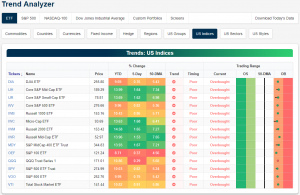
Trend Analyzer – 2/14/19 – Double Digits All Around
After another push higher yesterday, major US index ETFs are all now firmly overbought. Small and mid-caps are still the most overbought by a small margin as they continue to be the best performers with each one up over 1.5% over the past week while their peers have seen far more modest gains. Turning to the YTD performance, things are a bit more cheery. Currently, a majority of US index ETFs have now edged out double-digit gains on a year to date basis, and the ones that aren’t (DIA, IVV, OEF, and VOO) are very close to doing so. Despite the rally since Christmas, each of these indices are still in long term downtrends and the timing is poor. If the gains to start 2019 continue for a few more weeks, however, we’ll start to see these downtrends flip to sideways trends or even new uptrends.
Morning Lineup – Weak Economic Data
Futures had been drifting higher this morning, but a ton of economic data was just released and it wasn’t good. PPI missed on the headline but was stronger than expected at the core. Retail Sales for December were much weaker than expected, and Jobless Claims also came in considerably higher than expected. Jobless Claims have now been steadily drifting higher with the four-week moving average reaching its highest level in over a year and leading to the question, have we seen the low in jobless claims? Read all about overnight events around the world and this morning’s news in today’s Morning Lineup.
Bespoke Morning Lineup – 2/14/19
With all the strength we have seen in equities so far this year, it’s pretty amazing that there has been practically no movement in the long-end of the Treasury curve, as the 10-year yield remains below 2.7% this morning. With little changes in long-term rates, the yield curve (the spread between the yield on the 10-year and 3-month US Treasuries) remains below 30 basis points and is actually flatter now than it was at the end of December. As we have repeatedly mentioned in the past, though, flat yield curves aren’t necessarily a bad thing for US equity prices or a negative signal for the economy. It isn’t until the curve inverts (and then starts to re-steepen) that you have to start raising your guard.

Start a two-week free trial to Bespoke Premium to see today’s full Morning Lineup report. You’ll receive it in your inbox each morning an hour before the open to get your trading day started.
