Stocks Feeling Sensitive
Investors are wondering what the right number is for the market as stocks leg lower on bad global data to close the week. Without taking a view on what the “right” price for the S&P 500 is, below we show a way to organize thinking about valuation in the short-term. In the table below we show a range of EPS growth rates relative to 2018 and a range of multiples on the resulting EPS numbers. The result is where the S&P 500 should trade given hypothetical earnings and how those are valued. For example, if you estimate EPS will fall 2% in both 2019 and 2020, and you value those EPS at a multiple of 15.0x, the S&P 500 is almost 700 points above where it should be! Alternatively, if you think EPS will be stable but should be valued at a relatively aggressive 19.0x, the S&P 500 should be trading near 3100. In the grid below, we’ve highlighted ~2800 values (roughly where the S&P 500 sits right now) to show the implicit EPS growth and multiple assumptions embedded in the price. Again, we don’t know the “right” combination of multiples and EPS growth, but if you’re extremely beared up with the Friday drop or think stocks are set to surge thanks to a dovish Fed, this analysis can help you see what sort of assumptions would need to play out for that to happen.

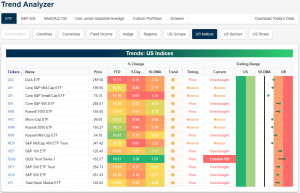
Trend Analyzer – 3/22/19 – Tech Getting Extended
As equities recovered losses from Wednesday’s FOMC meeting with strong gains yesterday, the major index ETFs have made another move towards overbought levels. Five index ETFs are neutral, while the other nine are overbought with one of these now to an extreme degree. Small and mid caps continue to lag behind their larger cap peers. Each of these ETFs in addition to the Dow (DIA), while still positive, have only seen modest gains of under 1% relative to other large cap ETFs gains which are all up well over 1%. The Nasdaq (QQQ) continues to blow the rest of the market out of the water with almost double the returns of the next best ETF over the last week. QQQ is up 3.5%, but these gains come with a cost as it is now in extreme overbought territory, sitting 7.57%, or more than 2 standard deviations, above its 50-DMA.
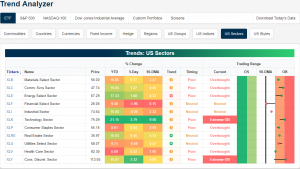
The Nasdaq’s strength comes thanks to the Technology sector (XLK). On top of outperforming YTD with a gain of over 21%, it is now up 3.79% this week and at extreme overbought levels. Additionally, Consumer Discretionary (XLY) has also rallied over 3% in the past 5 days bringing it to extremely overbought levels as well. In spite of these two sector’s outstanding performance, no other sector has managed to edge out gains that are as impressive. For example, the next best performing sector is Energy (XLE) which is only up 1.88%. On the other hand, Financials (XLF) have gotten hammered thanks to less favorable rates. The sector is now down 1.96% this week falling all the way back to its 50-DMA after sitting just barely below overbought levels last Friday.
Morning Lineup – Red Finish
Investors are scrambling for fixed income this morning after some truly bad economic data in Europe. 10-year bunds are back to negative yields and the US Treasury yield curve (10y vs 3m) is just 2 basis points (bps) from inversion. As you might expect, equity futures aren’t taking too kindly to the moves in fixed income and are looking to close out the week on a down note.
Please click the link below to read today’s Bespoke Morning Lineup.
Bespoke Morning Lineup – 3/22/19
As noted in our Closer report last night, one of the defining characteristics of the rally off the Christmas Eve lows for the stock market was the trend of strong buying in the last hour of trading and right into the closing bell (light blue line), which is generally considered a positive market signal. That strength stood in stark contrast to the period from 9/21 through 12/24, where the S&P 500 typically sold off towards the close (red line). Over the last two weeks, late day buying power has started to weaken (dark blue line). Up to this point, we haven’t seen it turn outright negative, but it has shifted to a more neutral trend and something that bears watching in the weeks ahead.

Start a two-week free trial to Bespoke Premium to see today’s full Morning Lineup report. You’ll receive it in your inbox each morning an hour before the open to get your trading day started.

The Closer — Bank Stumble, Late-Day Rumble — 3/21/19
Log-in here if you’re a member with access to the Closer.
Looking for deeper insight on markets? In tonight’s Closer sent to Bespoke Institutional clients, we take a look at the rally in credit which has brought it right up to resistance. Staying on the topic, we pivot towards the underperformance of banks which have been moving contrary to what credit would lead one to believe. After making note of recent late session trends, we turn to macro data with an update to our Five Fed Manufacturing Composite which—with the addition of the Philly Fed’s release—is showing strong shipments but weaker forward-looking indicators. We finish tonight covering the lackluster labor productivity in some Eurozone countries and Chinese auto sales dragging down the global metrics.

See today’s post-market Closer and everything else Bespoke publishes by starting a 14-day free trial to Bespoke Institutional today!
Bespoke’s Sector Snapshot — 3/21/19
We’ve just released our weekly Sector Snapshot report (see a sample here) for Bespoke Premium and Bespoke Institutional members. Please log-in here to view the report if you’re already a member. If you’re not yet a subscriber and would like to see the report, please start a two-week free trial to Bespoke Premium now.
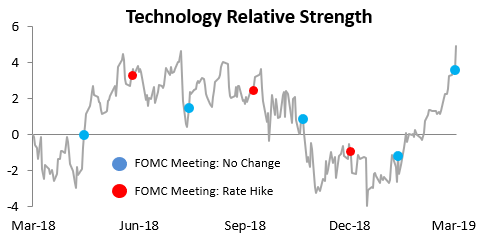
In this week’s Sector Snapshot, we highlight quite an extreme move for the Technology sector over the last couple of weeks. As shown in the chart below, Tech’s relative strength versus the S&P 500 just hit its highest point over the last year.
To gain access to the report, please start a two-week free trial to our Bespoke Premium package now. Here’s a breakdown of the products you’ll receive.
Two Sectors Telling Two Very Different Stories
The Dow Transports have historically been considered a good leading indicator of the global economy given that the companies in the group are responsible for moving goods across the country. While we wouldn’t completely dismiss the Dow Transports as an economic barometer, as the economy has migrated away from manufacturing over the years, the sector’s relevance has declined. In an interview earlier this week, we argued that because semiconductors are central to every aspect of the globally connected economy and even to many analog aspects of the economy, they could be considered the 21st century equivalent of the Dow Transports. Every investor is entitled to their opinion of whether the Transports still carry the same weight as they have in the past as an economic or market barometer, or if the Semiconductor group has the same sort of relevance. One thing everyone can agree on, however, is that right now the sectors are telling two very different stories.
The chart below compares the relative strength of the S&P 500 Semiconductor Group and the Dow Transports to the S&P 500. For each chart, a rising line indicates outperformance versus the S&P 500, while a falling line indicates that the S&P 500 is outperforming. From last March right up through the later stages of 2018, both sectors saw their relative performance versus the S&P 500 decline. Beginning in November, though, semis began to turn things around while the Transports have continued to lag, and in recent weeks their performances couldn’t be more opposite. Just today, the semis are trading at their best levels since early October while the Transports are still trending lower. Only time will tell which sector is giving a more accurate picture of the economic backdrop, but semis have had more recent history on their side.
![]()
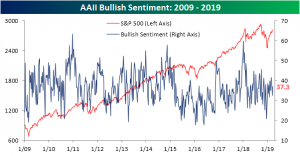
Bears Back Into Hibernation
After falling last week down to 32.42%, bullish sentiment as seen through the AAII’s survey of individual investors rebounded right back to where it was a couple of weeks ago with today’s release coming in at 37.3%. This uptick is not too surprising following the bounce back from the first week of significant declines of 2019.
Bearish sentiment, on the other hand, saw the largest decrease since the first week of February falling to 23.41% from 31.06% last week. While not falling to new lows—earlier this month, bearish sentiment fell all the way down to 20%—this week’s reading is certainly at the lower end of the range it has been at for most of the past few years. In spite of this, it is not quite reaching extreme levels.
Neutral remains the most popular opinion for the second week in a row. 39.2% of individual investors reported having neutral sentiment this week, up from 36.52% last week. Neutral sentiment has been relatively elevated since the market staged its recovery from the Q4 2018 sell-off. For seven weeks in a row now, it has been higher than the historical average. Since the start of the year, bullish and bearish sentiment, by comparison, has come in higher than average about half that amount; nor have they seen nearly as large of streaks of doing so.
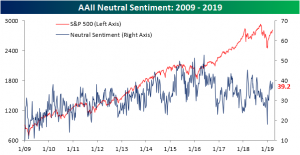
Chart of the Day: Death Pledges Revive Housing
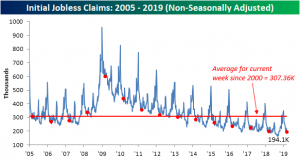
Claims Range Bound
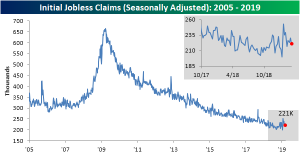
Initial jobless claims declined this week falling down to 221K from last week’s reading of 230K and below consensus forecasts of 225K. This week marks the 211th week that claims have come in below 300K. In other words, in spite of short term fluctuations, jobless data is still at healthy levels. 221K sits right within the range of the last month (221K – 230K), indicating that jobless claims seem to have stabilized following big fluctuations around the government shutdown.
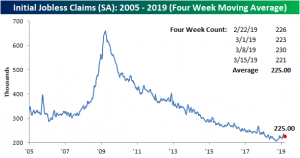
Similarly, the less volatile four-week moving average has also found a degree of stability after drifting upwards since the final weeks of 2018. This week the moving average rose 1K to 225K, and it has now been an entire month since it last hit a 52-week high. Again in the past month, the moving average—like the SA number—has been pretty much sideways.
Finally, turning to the non-seasonally adjusted data, claims saw a drop consistent with seasonal patterns to 194.1K. That is down from 209.4K last week. This was also the lowest reading for the current week of the year for the current cycle and the lowest week’s number since early October. Additionally, this was far below the average of 307K for the current week of the year going back to 2000.
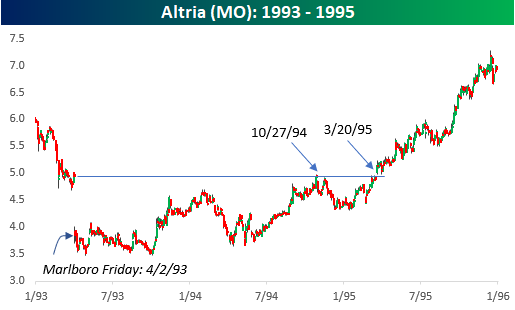
Memories of “Marlboro Friday”
Marlboro Friday” refers to a day back in 1993 when Philip Morris (MO) announced drastic cuts in cigarette prices in order to better compete with the cheaper prices being offered by generic makers. As a result of the move, the company’s stock immediately dropped over 25%. Fast forwarding a quarter century, today could go down in the annals of history as ‘Biogen Thursday’ as the company announced that it was discontinuing trials for its experimental treatment of Alzheimer’s disease as the initial results have been ineffective. As a result of Biogen’s (BIIB) announcement, the stock, like MO back in 1993, is trading down over 25%.
In the case of MO back in 1993, the stock did a whole lot of nothing for the next six months. From the initial decline on 4/2/1993, MO dropped an additional 10% over the following four weeks and then moved sideways through the Fall. From there, the stock generally trended higher and first briefly traded above its pre-Marlboro Friday levels on 10/27/94, but didn’t convincingly break above those levels until the following March, or nearly a full two years after the initial decline. While this morning is no doubt a painful one for BIIB shareholders, as was the case with Philip Morris in the early 1990s, the hope is that a little (or lot depending on your level of patience) time will also heal the sting from today’s “Biogen Thursday”.