Claims Still Healthy
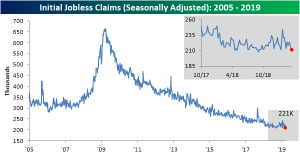
Bucking the trend of recent weak economic releases, this week’s Initial Jobless Claims provided a sigh of relief as it came in stronger than expected. On a seasonally adjusted basis, claims fell 5K from last week’s 216K to 211K. The past two weeks’ decline in the claims number has brought the indicator back to a level near the lower end of the range it has been in since Q4 2018. This week’s 211K is also the lowest print since January 18th. Once again, the labor market is still showing strength as claims have now come in at or below 300K for 212 consecutive weeks.
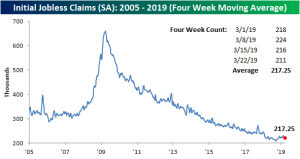
With early 2019 data that was frankly all over the place now having rolled off of the average, the less volatile four-week moving average has continued to stabilize and came in lower again this week. Down from 220.5K last week, the moving average is now at 217.25K. That is the lowest reading since early November and also well off of levels from February when this measure was reaching 52-week highs. So while other economic data has been week recently, this week’s initial jobless claims and lack of more 52-week highs in the four-week moving average seem to show that some of the worries of the past few months have more or less subsided.
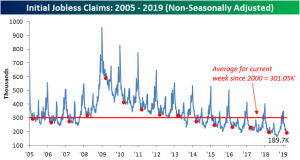
Turning to the non-seasonally adjusted number for this week, as we have frequently seen it came in at the lowest level since at least 2005 and for the current cycle. It is also well below the average for the current week since 2000.
Morning Lineup – Back to China
We’ve just published today’s Morning Lineup featuring all the news and market indicators you need to know ahead of the trading day. To view the full Morning Lineup, start a two-week free trial to Bespoke Premium.
After four trading days of non-stop focus on the yield curve, investors are moving on to the new topic du jour as positive headlines with respect to China have provided a boost to equity futures. As they say, everything old is new again! The news this time around is that the Chinese government is planning to offer more access to its cloud computing market for foreign tech firms. While sentiment is positive right now, there’s a lot to focus on today with a number of economic indicators on the calendar and several FOMC speakers set to speak.
Please click the link below to read today’s Bespoke Morning Lineup.
Sentiment sure can shift quickly in financial markets, and the latest example comes from Brazil. Just a little more than a week ago, Brazil’s benchmark Ibovespa index crossed the 100,000 level on an intraday basis for the first time ever. While the index was still down over 40% in dollar-adjusted terms, crossing 100,000 was a pretty big deal.
The party didn’t last long, though. The Ibovespa was never able to close above 100,000 last week, and ever since then, we have seen steady selling. Just yesterday the index broke down through short-term support and is now down nearly 8% from its recent highs. This morning is also looking like more of the same at the open as Brazilian equities are set to open down about 1%. Easy come easy go.

Start a two-week free trial to Bespoke Premium to see today’s full Morning Lineup report. You’ll receive it in your inbox each morning an hour before the open to get your trading day started.

The Closer — Stocks Sticky, Hedges Ride Herd On Rates, Current Account Deficit — 3/27/19
Log-in here if you’re a member with access to the Closer.
Looking for deeper insight on markets? In tonight’s Closer sent to Bespoke Institutional clients, taking a look at the recent decimation of Treasury yields, we note that stocks have actually held up well, and are not always perfectly correlated with yields. We make a similar note regarding oil before delving deeper into the mess that has been rates. We examine the evidence that interest rates’ movements have been a result of hedging by looking at swap spreads and mortgages. In macro data, we review the US Current Account which showed the largest deficit since 2012 driven by the Goods and Services trade balance. We also show US income from portfolio investment which is at a record and the gross value of goods and services multi-year declines as a share of GDP. We finish with a recap of today’s EIA data.

See today’s post-market Closer and everything else Bespoke publishes by starting a 14-day free trial to Bespoke Institutional today!
B.I.G. Tips – Sector Performance Following Initial Inversion of Yield Curve
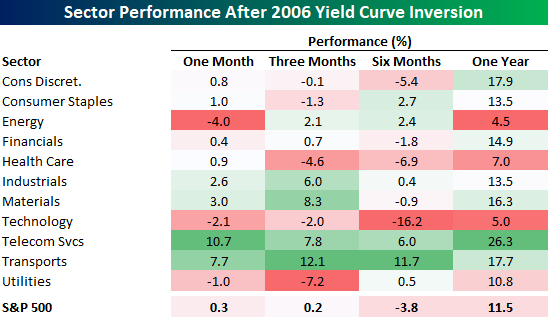
In our latest B.I.G Tips report, we detail and summarize sector performance following periods where the yield curve first inverts after two-years or more of not being inverted. One of the periods we looked at was the most recent period prior to last week, which was back in 2006. The 2006 inversion was followed by mixed market returns. One month later, the S&P 500 was essentially flat with Telecom Services and Transports leading the way higher as Energy and Utilities both declined. Three and six months later, the S&P 500 saw similarly mixed returns, but one year later, the S&P 500 was up over 11% and every sector was up at least 4.5%. The party ended shortly thereafter, however, as the Global Financial Crisis took hold in late 2007 through early 2009.
To gain access to the full report which contains more of the same analysis for each of the periods where we saw similar inversions after at least two years without an inversion, please start a two-week free trial to our Bespoke Premium package now. Here’s a breakdown of the products you’ll receive.
Fixed Income Weekly – 3/27/19
Searching for ways to better understand the fixed income space or looking for actionable ideals in this asset class? Bespoke’s Fixed Income Weekly provides an update on rates and credit every Wednesday. We start off with a fresh piece of analysis driven by what’s in the headlines or driving the market in a given week. We then provide charts of how US Treasury futures and rates are trading, before moving on to a summary of recent fixed income ETF performance, short-term interest rates including money market funds, and a trade idea. We summarize changes and recent developments for a variety of yield curves (UST, bund, Eurodollar, US breakeven inflation and Bespoke’s Global Yield Curve) before finishing with a review of recent UST yield curve changes, spread changes for major credit products and international bonds, and 1 year return profiles for a cross section of the fixed income world.
In this week’s report we review the shocking rally in short-term rates over the last few weeks.

Our Fixed Income Weekly helps investors stay on top of fixed income markets and gain new perspective on the developments in interest rates. You can sign up for a Bespoke research trial below to see this week’s report and everything else Bespoke publishes free for the next two weeks!
Click here and start a 14-day free trial to Bespoke Institutional to see our newest Fixed Income Weekly now!
Chart of the Day: Smart Money Shifts Negative?
B.I.G. Tips: Recession Odds
What are the odds of a recession coming at some point in the next three years?
In order to more precisely quantify recession risks, we took four economic indicators related to the labor market (the Conference Board’s Current Situation indicator, the Jobs Hard to Get—Jobs Plentiful spread, the unemployment rate, and the 6m rate of change in each month’s initial jobless claims average) and four rates market indicators (the 3m5y curve, the 3m10y curve, the 5y30y curve, and the real Fed Funds rate) and ran probit regressions against the binary condition “did a recession start at some point over the next X years.”
A probit regression is very similar to linear regression, but instead of continuous variables, the regression is run against a binary data point. The result is a probability of a binary outcome based on continuous inputs; given a certain set of data points, what are the odds we enter recession? We note that for the real Fed Funds and unemployment rates, we use February data for March; all other variables are either March or March-to-date.
To read our findings, start a two-week free trial to Bespoke Premium or Bespoke Institutional. Then come back to this post.
Bespoke’s Global Macro Dashboard — 3/27/19
Bespoke’s Global Macro Dashboard is a high-level summary of 22 major economies from around the world. For each country, we provide charts of local equity market prices, relative performance versus global equities, price to earnings ratios, dividend yields, economic growth, unemployment, retail sales and industrial production growth, inflation, money supply, spot FX performance versus the dollar, policy rate, and ten year local government bond yield interest rates. The report is intended as a tool for both reference and idea generation. It’s clients’ first stop for basic background info on how a given economy is performing, and what issues are driving the narrative for that economy. The dashboard helps you get up to speed on and keep track of the basics for the most important economies around the world, informing starting points for further research and risk management. It’s published weekly every Wednesday at the Bespoke Institutional membership level.
You can access our Global Macro Dashboard by starting a 14-day free trial to Bespoke Institutional now!

Morning Lineup – More Inversion
We’ve just published today’s Morning Lineup featuring all the news and market indicators you need to know ahead of the trading day. To view the full Morning Lineup, start a two-week free trial to Bespoke Premium.
The global frenzy for yield continues this morning as Mario Draghi made dovish comments suggesting more easing measures likely to come from the ECB in response to recent weakness in the economic headlines. US Treasuries are rallying again this morning, sending the yield on the 10-year to 2.38% and pushing the yield curve further into inverted territory at negative 6 basis points on the 10y/3m curve. In corporate news, Southwest Airlines (LUV) lowered guidance citing the grounding of the 737 MAX and adverse weather conditions. On a more positive note, both KB Homes (KBH) and Lennar (LEN) are trading up over 2.5% after reporting earnings.
Please click the link below to read today’s Bespoke Morning Lineup.
The chart below is from the second page of our Morning Lineup and shows where S&P 500 sectors are trading with respect to their trading ranges. For each sector, the circle represents where it is now, while the tail indicates where the sector was trading a week ago. In the chart, light red or green shading represents overbought or oversold readings (>1 standard deviation above or below 50-DMA), while dark red and dark green shading indicate extreme overbought or oversold readings (>2 standard deviations above or below 50-DMA).
Looking at the chart, can you tell which one isn’t like the others? While the S&P 500 and most sectors remain at short-term overbought levels, Financials have been hit hard and is not only the only sector trading below its 50-DMA, but it is also the only oversold sector. Keep in mind also, that this reading comes after yesterday’s rally where the sector handily outperformed the S&P 500 gaining over 1%. If there is one sector where the pain of an inverted yield curve was immediately felt, it was in the Financials!

Start a two-week free trial to Bespoke Premium to see today’s full Morning Lineup report. You’ll receive it in your inbox each morning an hour before the open to get your trading day started.
The Closer — Doji City, Recession Odds, California Crushed — 3/26/19
Log-in here if you’re a member with access to the Closer.
Looking for deeper insight on markets? In tonight’s Closer sent to Bespoke Institutional clients, we begin with a note on the S&P 500’s price action after two straight days with a doji candlestick pattern. Turning to rates, we discuss where the 10-year Treasury yield should be given its relationship to crude oil, and the prospects of the 2-year after today’s impressive auction. Following up on today’s Chart of the Day, we provide some probit regressions to show the odds of a recession in the next few years given a number of variables. Next, with the addition of the Dallas and Richmond Feds’ indices, we provide an updated look at our Five Fed Manufacturing Composite which is now showing some improvements. We finish with today’s housing starts release which missed by a wide margin (though permits were stronger) partially thanks to weather conditions on the west coast.
See today’s post-market Closer and everything else Bespoke publishes by starting a 14-day free trial to Bespoke Institutional today!