Chart of the Day: China (ASHR), Emerging Markets (EEM) Technicals Looking Strong
March Employment Report Preview
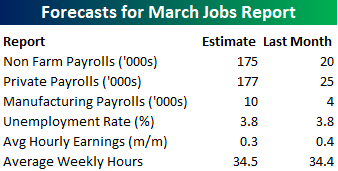
Heading into Friday’s Non Farm Payrolls (NFP) report for March, economists are expecting an increase in payrolls of 175K, which would be a major improvement from February’s paltry reading which came in at just 20K for the tenth biggest miss relative to expectations since at least 1999. In the private sector, economists are expecting an increase of 177K, which would imply a similar increase versus February as the headline reading. The unemployment rate is expected to remain unchanged at 3.8%. Average hourly earnings are expected to grow at a rate of 0.3% versus the 0.4% reading last month. Finally, average weekly hours are expected to be unchanged at 34.5.
One trend worth highlighting about recent NFP reports is that they have been extremely volatile relative to expectations. In each of the last three months, the originally reported number was off the mark by at least 100K for an average of 142K above or below expectations. Since 1999, there have only been three other periods where the original number was that far off expectations by at least 100K for three months in a row, and the last occurrence was in 2004.
Ahead of the report, we just published our eleven-page preview of the March jobs report. This report contains a ton of analysis related to how the equity market has historically reacted to the monthly jobs report, as well as how secondary employment-related indicators we track looked in March. We also include a breakdown of how the initial reading for March typically comes in relative to expectations and how that ranks versus other months.
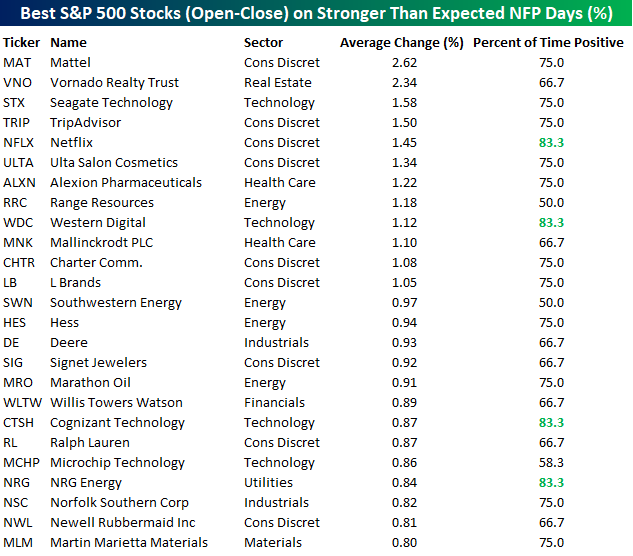
One topic we cover in each month’s report is the S&P 500 stocks that do best and worst from the open to close on the day of the employment report based on whether or not the report comes in stronger or weaker than expected. In other words, which stocks should you buy, and which should you avoid? The table below highlights the best-performing stocks in the S&P 500 from the open to close on days when the Non-Farm Payrolls report has been better than expected over the last two years.
Of the top performing stocks on days when NFP beats expectations, nine sectors are represented, but Consumer Discretionary leads the way with nine. Mattel (MAT) has been the best performing stock with an average open to close gain of 2.62%, but another eleven have seen average open to close gains of more than 1%. In terms of consistency, Netflix, Western Digital, Cognizant, and NRG have all been positive 83% of the time.
For anyone with more than a passing interest in how equities are impacted by economic data, this March employment report preview is a must-read. To see the report, sign up for a monthly Bespoke Premium membership now!
the Bespoke 50 — 4/4/19
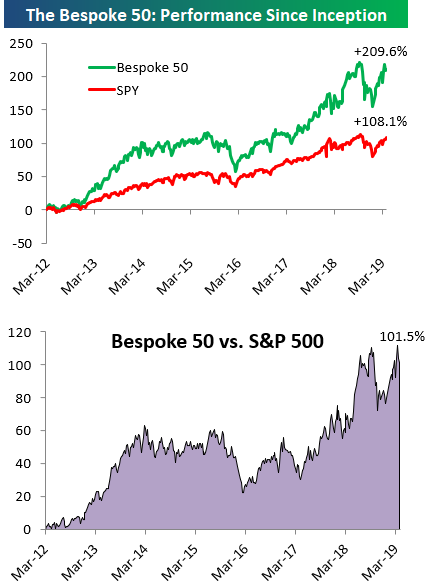
Every Thursday, Bespoke publishes its “Bespoke 50” list of top growth stocks in the Russell 3,000. Our “Bespoke 50” portfolio is made up of the 50 stocks that fit a proprietary growth screen that we created a number of years ago. Since inception in early 2012, the “Bespoke 50” has beaten the S&P 500 by 101.5 percentage points. Through today, the “Bespoke 50” is up 209.6% since inception versus the S&P 500’s gain of 108.1%. Always remember, though, that past performance is no guarantee of future returns.
To view our “Bespoke 50” list of top growth stocks, please start a two-week free trial to either Bespoke Premium or Bespoke Institutional.
Jobless Claims: What Highs?
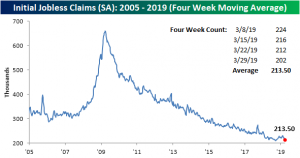
The Department of Labor’s weekly jobless claims continued to surprise this week as seasonally adjusted initial jobless claims fell to 202K from a revised 212K last week. This comes in complete contrast of what briefly appeared to be a bottoming out of claims earlier this year, as that increase has now been more than erased. Not only is this print of 202K the 213th week below 300K, but it is also a low for the current cycle. Even more impressive, it is the lowest weekly claims number in nearly 50 years!Start a two-week free trial to Bespoke Premium to access our interactive research portal. You won’t be disappointed!

As tempting as it is to rally around this small factoid, we actually saw lower prints earlier this year that were later revised higher. Back in the third week of January, the original release of initial jobless claims came in at a low of 199K which of course earned the title of lowest since November of 1969. This 199K was later revised all the way up to 211K. Similarly, in late August and early September, initial releases of jobless claims came in near similar levels between 201K and 204K also to be significantly revised. Let’s see if this week’s print gets revised higher as well.
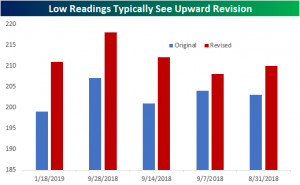
Revisions aside, the less volatile four-week moving average has once again reaffirmed this week that highs from February have peaked. Settling at 213.5K, the moving average is now right back to where it was on October 5th. This week’s data also brings the moving average within 3K of the current cycle’s low of 210.5K (from September 21st).
Turning to the non-seasonally adjusted number, jobless claims fell from 190.1K last week down to 182.6K. This is well below the average for the current week of the year since 2000. It is also healthily the lowest claims print for the current week of the year going back to at least 2000.

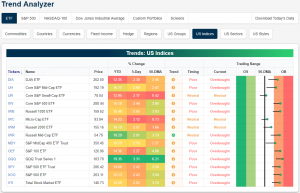
Trend Analyzer – 4/4/19 – Getting Overbought
As seen through the long tails in our Trend Analyzer, this time last week, the major index ETFs were mostly neutral with some below the 50-DMA. Gains over the week have certainly shifted things towards overbought as now there are only three neutral ETFs while the rest are overbought. The Nasdaq (QQQ) continues to be a leader as it has risen more than the other indices on both a year to date and weekly basis. Currently, it is up 19.35% YTD and up 3.31% in the past week and as a result is pushing on extremely overbought levels. While the others have a little further to go until reaching extreme levels, they are firmly overbought. Small caps remain the exception to this. In spite of all gaining over 2% over the past week—basically in line if not slightly less than the other indices’ gains—small caps continue to sit right around the 50-DMA. The Core S&P Small Cap ETF (IJR) and the Micro-Cap (IWC) are only 0.42% and 0.73%, respectively, above the 50-day. Granted, this is an improvement from sitting under the average last week.
Morning Lineup – 100 Days
We’ve just published today’s Morning Lineup featuring all the news and market indicators you need to know ahead of the trading day. To view the full Morning Lineup, start a two-week free trial to Bespoke Premium.

Here’s a snippet from today’s report:
US-China trade talks are in the spotlight again this morning as the President is set to meet with the Chinese Vice Premier shortly after the close this afternoon, and he just tweeted that talks are ‘moving along nicely’- a phrase we have been hearing for months now. Jobless Claims were just released and came in lower than expected at a 49-year low of 202K versus forecasts for 215K. We’ve said it numerous times before, but Jobless Claims continue to amaze! While not a new low, Continuing Claims also saw their largest weekly drop since November.
Yesterday marked the 100-day mark since the 2018 closing low in US equity markets. During that stretch, the S&P 500 has rallied 22%, which for most people would be considered a great year let alone a great quarter. Among various industries, though, some of the gains have been even more extraordinary. The table below lists the best and worst performing S&P 500 industries since the close on December 24th, along with each one’s overall weighting in the index.
As far as winners are concerned, there have been some big ones as 13 have seen gains of over 30%. Personal Products, a member of the Consumer Staples sector has led the way higher with a gain of just under 39%! Consumer Staples is not normally the sector that comes to mind when you think of big rallies, but there it is right at the top of the list! Behind Personal Products, Communications Equipment (36.5%), Construction & Engineering (36%), and Real Estate Management & Development have all gained 35% or more. While an industry from the Consumer Staples sector has been the top performer, industries from the Technology and Industrials sectors are the most well-represented with five and four, respectively.
On the downside, there hasn’t been any as every industry in the S&P 500 is up since the 12/24 lows! In terms of laggards, Health Care Providers and Diversified Consumer Services are the only two groups that are up less than 5%. Additionally, there are only two others that are up less than 10%. Hard to believe that being up over 10% in just over three month’s time can still be trailing the S&P 500 in a big way.

Start a two-week free trial to Bespoke Premium to see today’s full Morning Lineup report. You’ll receive it in your inbox each morning an hour before the open to get your trading day started.
The Closer — Drawdowns, Intraday Weakness, EM Drivers, Refis, Flows — 4/3/19
Log-in here if you’re a member with access to the Closer.
Looking for deeper insight on markets? In tonight’s Closer sent to Bespoke Institutional clients, as the current drawdown from the S&P 500’s high closes in on the third longest of the current bull market, given current levels we show how long it could be until it reaches those highs again. We also highlight a potential red flag in the index’s intraday weakness. Looking outside the US, as emerging markets hit new highs today, we cover EEM’s reliance on Chinese gains to make this progress. We also show how EEM relative to SPY has diverged from commodity total returns. Turning to US data, we expand on this mornings note about MBA Mortgage data by showing the surge in refinancing applications and adjustable rate mortgages. We finish with a look at weekly fund flows and EIA petroleum data.

See today’s post-market Closer and everything else Bespoke publishes by starting a 14-day free trial to Bespoke Institutional today!
Chart of the Day: Retail Sales Flashing Yellow
Fixed Income Weekly – 4/3/19
Searching for ways to better understand the fixed income space or looking for actionable ideals in this asset class? Bespoke’s Fixed Income Weekly provides an update on rates and credit every Wednesday. We start off with a fresh piece of analysis driven by what’s in the headlines or driving the market in a given week. We then provide charts of how US Treasury futures and rates are trading, before moving on to a summary of recent fixed income ETF performance, short-term interest rates including money market funds, and a trade idea. We summarize changes and recent developments for a variety of yield curves (UST, bund, Eurodollar, US breakeven inflation and Bespoke’s Global Yield Curve) before finishing with a review of recent UST yield curve changes, spread changes for major credit products and international bonds, and 1 year return profiles for a cross section of the fixed income world.
In this week’s report we discuss the signals being sent by the term structure of the Brent crude curve.

Our Fixed Income Weekly helps investors stay on top of fixed income markets and gain new perspective on the developments in interest rates. You can sign up for a Bespoke research trial below to see this week’s report and everything else Bespoke publishes free for the next two weeks!
Click here and start a 14-day free trial to Bespoke Institutional to see our newest Fixed Income Weekly now!
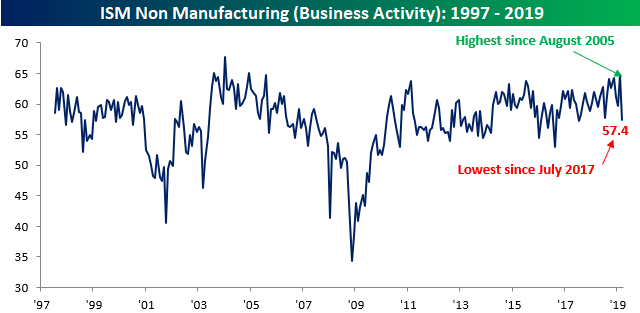
Services Sector Disappoints
After a number of global PMIs for the services sector came in better than expected overnight and this morning, the ISM Services (non-manufacturing) report for March disappointed, coming in at a level of 56.1 compared to expectations for a reading of 57.9 and last month’s reading of 59.7. Not only was this month’s report weaker than expected, but it was also the lowest reading since July 2017. On a combined basis and accounting for each sector’s share of the total economy, the ISM for March came in at 56.0 versus last month’s reading of 59.1. This combined reading was the lowest print seen since August 2017. Start a two-week free trial to Bespoke Premium to access our interactive research portal. You won’t be disappointed!

The table below breaks down this month’s report by each of its subcomponents and shows their m/m and y/y changes. Despite the large drop on a m/m basis, more components actually saw increases (5) in March versus declines (4). The biggest gainer was Prices Paid, followed by Inventory Sentiment and Import Orders. On the downside, the declines were larger and the biggest ones were Business Activity and New Orders. On a y/y basis, breadth was considerably weaker as Inventory Sentiment was the only component that increased.

There has been a lot of inconsistency in economic data lately and one of the prime examples has been in the Retail Sales data from the last three months. Retail Sales isn’t the only example, though. Take a look at the chart of Business Activity below. In last month’s report, Business Activity rose to 64.7, which was the highest reading since August 2005. This month, however, the index for Business Activity dropped to 57.4, which was the lowest level since July 2017. In other words, Business Activity went from a 13+ year high to a 52-week low in the span of a month!