Fixed Income Weekly – 5/8/19
Searching for ways to better understand the fixed income space or looking for actionable ideals in this asset class? Bespoke’s Fixed Income Weekly provides an update on rates and credit every Wednesday. We start off with a fresh piece of analysis driven by what’s in the headlines or driving the market in a given week. We then provide charts of how US Treasury futures and rates are trading, before moving on to a summary of recent fixed income ETF performance, short-term interest rates including money market funds, and a trade idea. We summarize changes and recent developments for a variety of yield curves (UST, bund, Eurodollar, US breakeven inflation and Bespoke’s Global Yield Curve) before finishing with a review of recent UST yield curve changes, spread changes for major credit products and international bonds, and 1 year return profiles for a cross section of the fixed income world.
In this week’s report we take a look at the evolution of real yields since before the financial crisis.

Our Fixed Income Weekly helps investors stay on top of fixed income markets and gain new perspective on the developments in interest rates. You can sign up for a Bespoke research trial below to see this week’s report and everything else Bespoke publishes free for the next two weeks!
Click here and start a 14-day free trial to Bespoke Institutional to see our newest Fixed Income Weekly now!
Markets Keep Pushing the FOMC
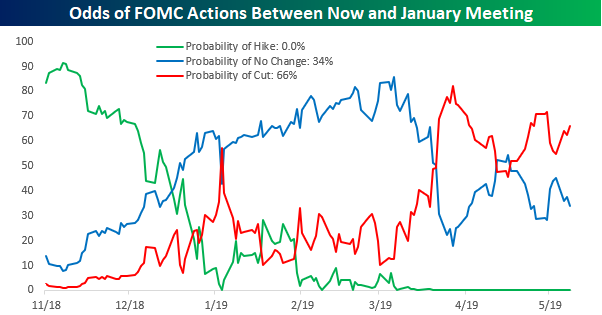
Heading into last week’s FOMC meeting, futures markets were pricing in close to an 80% chance of at least one rate cut from the FOMC between now and the January 2020 meeting in less than eight months. In his press conference following that meeting, Fed Chairman Jay Powell did his best to reset market expectations by arguing that recent low inflation readings are transitory and by saying that the FOMC wasn’t currently leaning in one direction or the other with respect to its next move on rates.
The result of Powell’s non-dovish remarks (but definitely not hawkish either) was a relatively sharp reversal in equity prices and a re-pricing in the futures markets regarding the likelihood of rate cuts between now and January. By last Friday, the market was only pricing in a slightly better than 50-50 chance of a rate cut by the January 2020 meeting.
In the span of the last three trading days (and a Sunday tweetstorm from the President regarding China), though, traders in Fed Funds futures are once again back to pressing their bets on the possibility of rate cuts. As of this morning, those odds have moved back up to 66%.
Recent moves in the yield curve are also starting to suggest that the FOMC may have to blink. After a brief inversion in late March, the yield curve, which we measure as the spread between the yields on the 10-year and 3-month treasuries, started to steepen again in April, which likely caused a sigh of relief in the halls of the Federal Reserve. Over the last few days, though, the flattening trend has returned with vigor and as of this morning is just one basis point from inversion again. If that happens, there’s a good chance that it won’t sit well with markets.Start a two-week free trial to Bespoke Institutional to access all of our market, earnings, economic, and FOMC analysis.
Chart of the Day – Intraday Pattern Points to Overseas Selling
Morning Lineup – Quick Change
Futures are down again this morning as global equities sell-off in the wake of yesterday’s brutal day in the US. Traders are in no mood to take a stand right now as the uncertainties regarding China and Iran take center stage. The flight to safety has provided a big boost for treasuries, re-flattening the yield curve closer to the inversion zone. And to think, just three trading days ago, the S&P 500 was flirting with a record high close! Change happens fast!
We’ve just published today’s Morning Lineup featuring all the news and market indicators you need to know ahead of the trading day. To view the full Morning Lineup, start a two-week free trial to Bespoke Premium.

Each morning on page two of the Morning Lineup, we show the daily percentage of S&P 500 stocks trading at overbought and oversold levels over the last year. In the chart below, we combine those two series to show the daily reading on a net basis. After reaching extreme negative levels back in late December, this indicator saw a sharp rebound at the turn of the calendar and has basically been in positive territory for most of this year. Following yesterday’s shellacking in the market, though, the net percentage of overbought stocks turned negative for the first time since mid-January. While there may have been short-term froth in prices heading into this week, the rekindling of Chinese trade issues as well as geopolitical issues bubbling up in the Middle-East, has been more enough to settle sentiment down in the short-term.

Start a two-week free trial to Bespoke Premium to see today’s full Morning Lineup report. You’ll receive it in your inbox each morning an hour before the open to get your trading day started.
The Closer — All About Vol, SLOOS Sags, JOLTS Jump — 5/7/19
Log-in here if you’re a member with access to the Closer.
Looking for deeper insight on markets? In tonight’s Closer sent to Bespoke Institutional clients, with equities down sharply so far this week, the VIX has been headed upwards leading the curve to flatten. We delve deep into what this means for the probability of the VIX dramatically surging like early last year. Next, we turn to yesterday’s Senior Loan Officer Outlook Survey courtesy of the Fed which showed some weaker lending and demand. We show some of this data like credit card, auto, and real estate lending in further detail. We finish off tonight’s Closer with a recap of today’s JOLTS report which was substantially stronger than forecasts.

See today’s post-market Closer and everything else Bespoke publishes by starting a 14-day free trial to Bespoke Institutional today!
S&P 500 Health Check-Up
Chart of the Day: How Current Valuations Stack up to Recent History
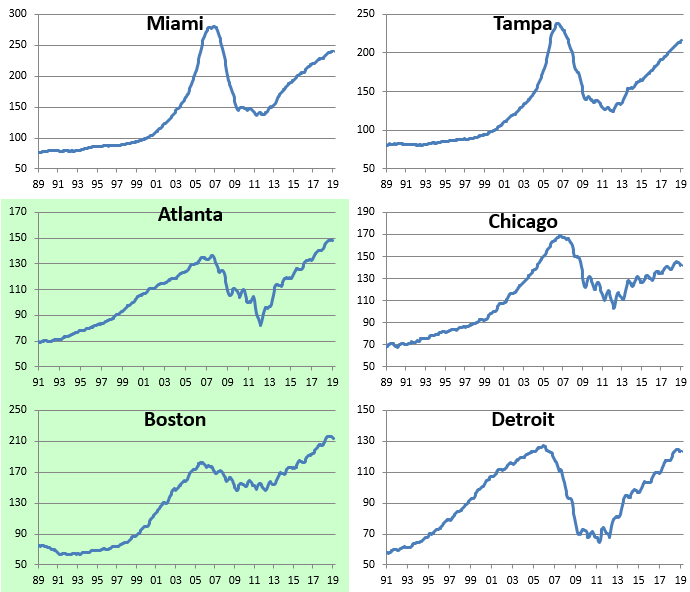
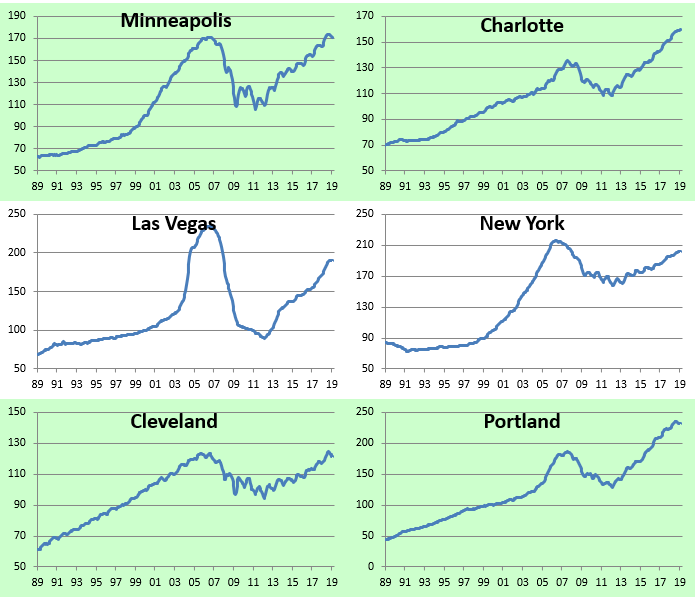
Four Cities See Home Prices Decline in Most Recent Case Shiller Release
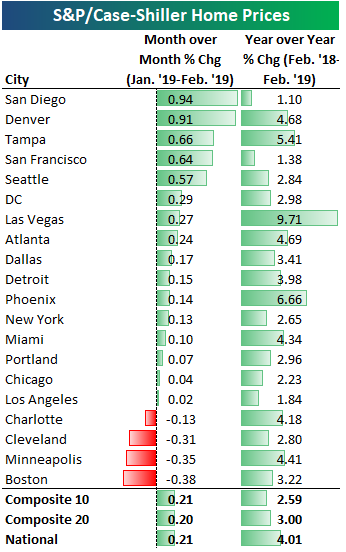
The newest S&P/Case Shiller home prices indices were released last week, and below is an updated look at the data. On a month-over-month basis, 16 of 20 cities saw home prices gain, with Charlotte, Cleveland, Minneapolis, and Boston seeing declines ranging from -0.13% to -0.38%. On a year-over-year basis, all 20 cities saw gains ranging from as low as +1.1% for San Diego to as high as +9.71% for Las Vegas.
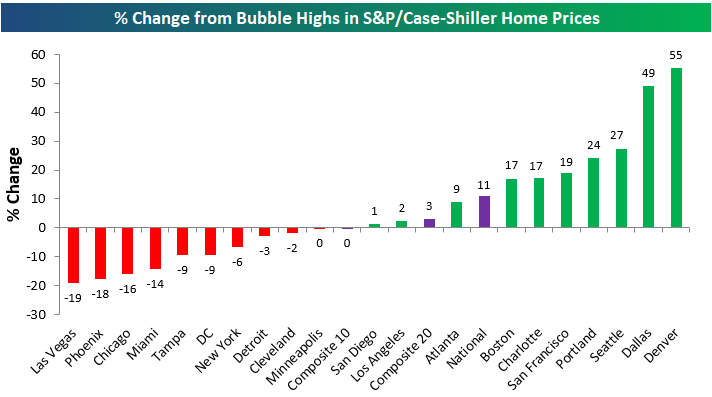
Below we show where home prices are now compared to where they were at their peaks during the mid-2000s housing bubble. The composite 10 and 20 city indices are basically at the flat line, meaning they’ve gained back all of their post-bubble losses but haven’t moved too far above them at this point. Denver prices are up the most at 55% above their prior highs, followed by Dallas at +49%, Seattle at +27%, and Portland at +24%.
Ten cities are still below their highs from the prior bubble, with Las Vegas the furthest below at -19%.
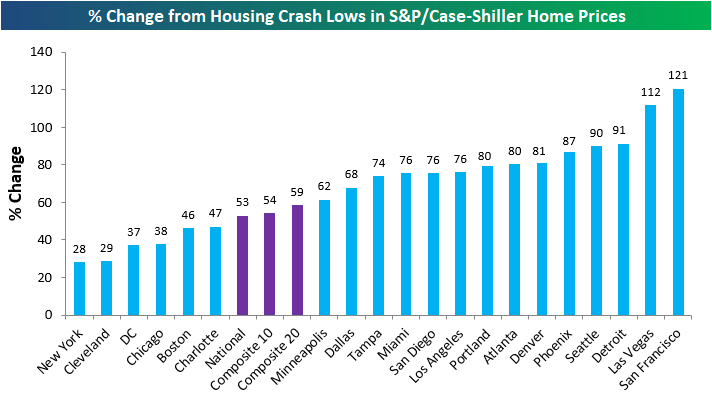
Below we show how much each city has gained from their respective lows made during the housing crash that followed the bubble. The composite indices are up more than 50% off of their lows, while San Francisco and Las Vegas are up more than 100%. New York ranks at the very bottom of this list with a bounce of just 28% off of its low at this point.
Below we show historical home price charts for each city tracked. Cities shaded in green are ones that have eclipsed their prior housing bubble highs. Get Bespoke’s most actionable research with a two-week free trial to any of our three membership levels.


Bespoke Stock Scores — 5/7/19
Morning Lineup – Trade Not the Only Headline Weighing on Stocks
It’s not just US-China trade headlines weighing on global equities this morning. Equities in Europe are trading lower after Factory Orders in Germany showed a much lower than expected increase in March (0.6% vs 1.4%). Along with that weak report, the European Commission just released economic forecasts and lowered 2019 GDP growth forecasts for the region from 1.3% down to 1.2% and said risks from global trade tensions and Brexit remain ‘pronounced’. Not to be left out of the discussion, the Federal Reserve issued its May 2019 Financial Stability Report which included the warning that “elevated valuation pressures are signaled by asset prices that are high relative to economic fundamentals or historical norms.”
Even the flow of earnings reports hasn’t been anything special in the last 15 hours. Since the close on Monday, 155 companies have reported earnings and of those, only 61% have exceeded EPS forecasts, while a slightly lower percentage (59%) managed to exceed topline revenue estimates.
We’ve just published today’s Morning Lineup featuring all the news and market indicators you need to know ahead of the trading day. To view the full Morning Lineup, start a two-week free trial to Bespoke Premium.
Along with the general rebound in equities across the board, small caps managed to finish the day slightly in the green yesterday as the Russell 2000 closed at its highest level since 10/9/18. Yesterday’s strength served as a follow-through to Friday’s breakout above resistance where the Russell finally managed to break above a level that has repeatedly acted as resistance over the last six months.

In addition to positive price action in small caps, breadth has been holding up well too. While not yet at a new high, last Friday, the Russell 2000’s cumulative A/D line reached its highest level since September 21st. Unlike the S&P 500, though, the peak breadth reading for the Russell was at the end of last August. Still, as evidenced by the recently widening gap between the two lines below, breadth has been increasingly outpacing price in the Russell 2000 for the last two months.

Start a two-week free trial to Bespoke Premium to see today’s full Morning Lineup report. You’ll receive it in your inbox each morning an hour before the open to get your trading day started.