2018 Week 1
Outside of financial markets, we’re sports fans here at Bespoke just like most people. With the 2018 NFL season kicking off this weekend, and new legal sports betting avenues now available across the US, we figured we’d have some fun and pick each NFL game versus the spread (as of Saturday evening). Let’s see how we do…
2018 NFL Week 1 Bespoke Picks:
Pittsburgh (-3.5) at Cleveland: Pittsburgh -3.5
Cincinnati at Indianapolis (-2.5): Cincinnati +2.5
Tennessee (-1) at Miami: Tennessee -1
San Francisco at Minnesota (-6.5): Minnesota -6.5
Houston at New England (-6.5): Houston +6.5
Tampa Bay at New Orleans (-9.5): New Orleans -9.5
Jacksonville (-2.5) at NY Giants: NY Giants +2.5
Buffalo at Baltimore (-7.5): Baltimore -7.5
Kansas City at LA Chargers (-3.5): Kansas City +3.5
Seattle at Denver (-3): Seattle +3
Washington (-1.5) at Arizona: Washington -1.5
Dallas at Carolina (-2.5): Carolina -2.5
Chicago at Green Bay (-7): Chicago +7
NY Jets at Detroit (-7.5): NY Jets +7.5
LA Rams (-4.5) at Oakland: LA Rams -4.5
The Bespoke Report — Buyers Strike
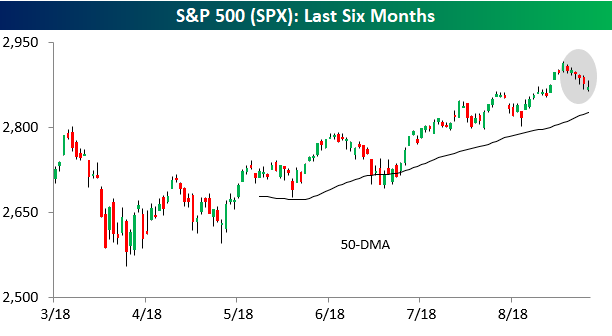
The End of Summer Hangover. The end of Labor Day weekend, when schools are back in session and summer starts to wind down, is always a tough time of year. After a summer of nice weather, swimming, hiking, outdoor sports, and hopefully even a vacation, Tuesday morning after the three-day Labor Day weekend can be rough. This year was no exception, and it was reflected in the performance of US and global equity markets.
Take a look at the chart below. For six straight trading days now, the S&P 500 had a lower intraday high and lower intraday low than the prior day’s levels. That type of consistent selling with zero in the way of buying doesn’t happen very often. To find the most recent occurrence, you have to go all the way back to May 2012, and since 1982, it has only occurred eight other times.
We’ve just published our latest weekly Bespoke Report newsletter, which is available to subscribers across all three of our membership levels. Sign up here to read the report.
To get up to speed on our thoughts regarding the market’s direction going forward, choose any membership option and access this week’s full Bespoke Report newsletter after signing up! You won’t be disappointed. Some of the topics discussed in this week’s report include:
- Buyers Strike
- International/Domestic Dichotomy
- FAANGed Up
- Bear Market in Emerging Markets
- Economic Review
- Years Like 2018
- Back to School Review
Who’s Following the Stock Market?
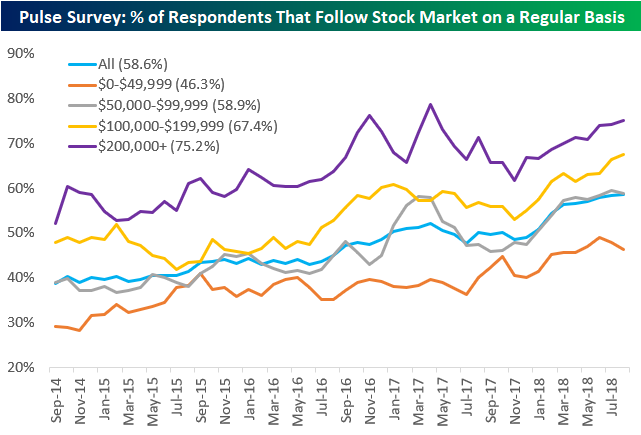
One of the questions we ask consumers in our monthly Consumer Pulse survey is if they follow the stock market on a regular basis. Since we began running our Pulse survey in 2014, the percentage of respondents that follow the stock market has steadily ticked higher to its current level of 58.6% (as of August). This is generally to be expected given that the stock market has also steadily ticked higher since 2014, but we really don’t know what would happen during a bear market because we haven’t had a bear market in nine years.
Below is a breakdown of interest in the stock market by annual income bracket. They say that the stock market is only for the wealthy, so let’s see what the numbers show.
The highest income bracket in our survey ($200k+) has had the highest percentage of interest in the stock market every month since we began running our survey in 2014. In the most recent month, 75.2% of consumers with incomes above $200k said they follow the stock market on a regular basis. This is not quite at an all-time high, though, even with the S&P 500 recently trading to new all-time highs. April 2017 is when stock market interest for the highest income bracket hit its highest level in our survey at just over 78%.
As might be expected, the higher the income, the more interest in the stock market. The $100,000-$199,999 bracket has the 2nd highest interest in the stock market at 67.4%, followed by the $50,000-$99,999 bracket at 58.9%. The lowest income bracket ($0-$49,999) has the lowest interest in the stock market, but at 46.3%, nearly a majority of the group says they follow the stock market on a regular basis.
As you can see in the chart, interest in the stock market has picked up across all income brackets over the last four years.
Bespoke’s Consumer Pulse Report is an analysis of a huge consumer survey that we run each month. Our goal with this survey is to track trends across the economic and financial landscape in the US. Using the results from our proprietary monthly survey, we dissect and analyze all of the data and publish the Consumer Pulse Report, which we sell access to on a subscription basis. Sign up for a 30-day free trial to our Bespoke Consumer Pulse subscription service. With a trial, you’ll get coverage of consumer electronics, social media, streaming media, retail, autos, and much more. The report also has numerous proprietary US economic data points that are extremely timely and useful for investors.
We’ve just released our most recent monthly report to Pulse subscribers, and it’s definitely worth the read if you’re curious about the health of the consumer in year two of Trump’s economy. Start a 30-day free trial for a full breakdown of all of our proprietary Pulse economic indicators.
August 2018 Headlines
Chart of the Day: Country “PEG” Ratios
Jobs Day Recap: Wages Impress
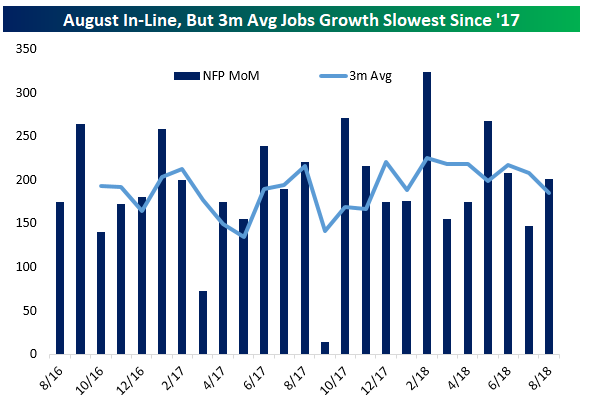
Job creation was slightly stronger than expected by economists in August (+201,000 versus +190,000 expected), but the 3 month average of payrolls growth fell to its lowest level since the end of last year thanks to large downward revisions to June and July data totaling a decline of 50,000 versus what had been previously reported.
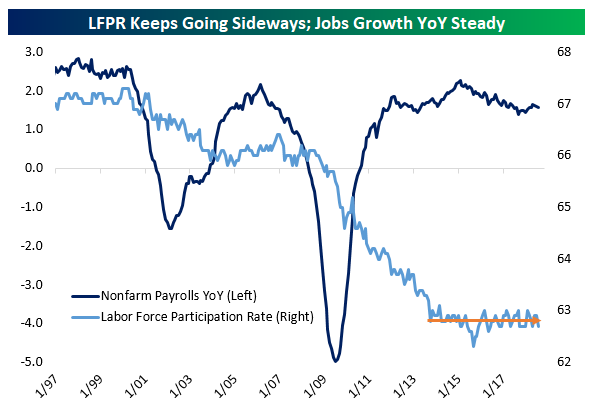
YoY jobs growth is once again slowing after a modest late-expansion uptick which had peaked as-of June. While jobs growth has slowed, it’s still rising at a very healthy pace on an annual basis. Despite ongoing jobs growth, the labor force participation rate has been basically stable for the past 5 years. One reason the LFPR is not rising along with employment is demographics: as the labor force ages, there are large outflows from employment to non-participation thanks to retirement. For instance, on average over the last 12 months, 3% of employed workers have left the labor force entirely. If they had been fired outright, it’s very unlikely they would not start looking for work immediately. Hence, the stability of the LFPR is almost entirely a demographic effect.
Saving the best for last, this was the strongest month of the expansion when it comes to wage growth. Total private wages rose 2.9% YoY, while production & non-supervisory wages (for non-managerial workers) rose to 2.8% YoY, fractional new high on an unrounded basis (+2.80% versus +2.77% in June). While job creation has slowed a bit, wages are continuing their slow process of acceleration after years of extreme weakness post-recession.
The Closer — Thursday Grab Bag — 9/6/18
Log-in here if you’re a member with access to the Closer.
Looking for deeper insight on markets? In tonight’s Closer sent to Bespoke Institutional clients, we cover a wide variety of topics: new highs for gold relative to silver, modestly rising volatility pricing, some strong relative performance in the Italian equity market, what the ADP miss today means for tomorrow’s NFP number, the effects of QE on monetary velocity, weekly EIA data, and recent price action in energy assets.

See today’s post-market Closer and everything else Bespoke publishes by starting a 14-day free trial to Bespoke Institutional today!
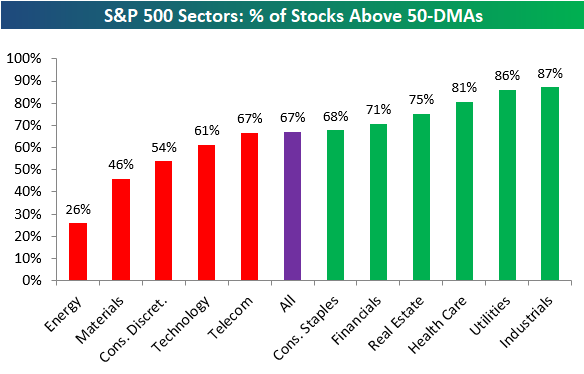
Bespoke’s Sector Snapshot — 9/6/18
We’ve just released our weekly Sector Snapshot report (see a sample here) for Bespoke Premium and Bespoke Institutional members. Please log-in here to view the report if you’re already a member. If you’re not yet a subscriber and would like to see the report, please start a two-week free trial to Bespoke Premium now.
Below is one of the many charts included in this week’s Sector Snapshot, which shows the percentage of stocks in S&P 500 sectors trading above their 50-day moving averages. As shown, 67% of stocks in the broad S&P 500 are above their 50-DMAs, while six of eleven sectors have readings stronger than 67%. Technology and Consumer Discretionary — the two best performing sectors YTD — have weakened a bit and now have lower breadth readings relative to the S&P.
To find out what this means and to see our full Sector Snapshot with additional commentary plus six pages of charts that include analysis of valuations, breadth, technicals, and relative strength, start a two-week free trial to our Bespoke Premium package now. Here’s a breakdown of the products you’ll receive.
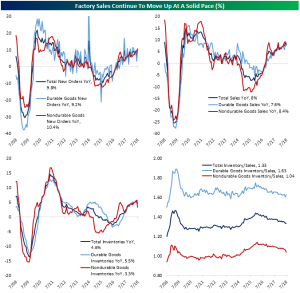
Manufacturers’ New Orders
The US Census reported new factory orders that were lower than expected for July with a 0.8% MoM decrease to $497.8 billion. Orders were estimated to fall 0.6% after the 0.7% increase in June. On a year over year basis, new orders are still up 8.3%. Breaking this down, durable goods saw a decline of 1.7% MoM; that large decline follows a 0.9% increase the month before. While not as strong as the previous period, nondurable goods orders rose by 0.2%. These readings are inline with the preliminary release.
Within durable goods, the computers and electronic products industry saw the greatest gain of 0.9% MoM growth in new orders. Machinery was not far behind at +0.8% MoM. These gains were largely helped by mining, oil field, and gas field machinery which increased 13.7% MoM amidst rapid investment in new shale capacity.
The transportation equipment industry dragged down all industries in July. Factory orders excluding transportation equipment were up 0.2% MoM. The volatile transportation equipment industry was down 5.2%, with the largest contributors to this change being nondefense and defense aircraft and parts, which saw 35.4% and 34.4% decreases, respectively. Interestingly though, with the past two periods showing strong gains, defense aircraft orders are actually down 5% YoY versus nondefense aircraft being up 14.1% YoY. The drop in new orders for these two industries completely overshadowed strength in the ships and boats industry which gained 25%.
Shipments were basically unchanged from June to July, up only $0.1 billion, but still up 7.5% YoY. Just like new orders, when the transportation equipment industry is excluded, there was an increase of 0.6% MoM from June to July. While not as drastic as the change in orders, durable goods shipments are down 0.2% MoM. Nondurable shipments are also up 0.2% MoM, mirroring nondurable orders.
Inventories for all manufacturing industry groups grew by 0.8% MoM, down from the 0.2% reading for June. On a year-over-year basis, they are up 5.6%. Once again, nondefense aircraft was a major factor with a 6.7% MoM increase. All manufacturing industries inventories to sales ratio has been relatively flat the past few months. The current ratio sits at 1.35, up 0.1 from June. Nondurable goods remained at the 1.07 level, while durable goods saw a 0.03 increase to 1.63, the same as its May and April number. It is worth noting that both shipments and inventories readings do feed through to GDP calculations by the BEA. Since there were no huge surprises, they should not have a strong impact on Q3 tracking.
Bespoke’s Consumer Pulse Report — August 2018
Bespoke’s Consumer Pulse Report is an analysis of a huge consumer survey that we run each month. Our goal with this survey is to track trends across the economic and financial landscape in the US. Using the results from our proprietary monthly survey, we dissect and analyze all of the data and publish the Consumer Pulse Report, which we sell access to on a subscription basis. Sign up for a 30-day free trial to our Bespoke Consumer Pulse subscription service. With a trial, you’ll get coverage of consumer electronics, social media, streaming media, retail, autos, and much more. The report also has numerous proprietary US economic data points that are extremely timely and useful for investors.
We’ve just released our most recent monthly report to Pulse subscribers, and it’s definitely worth the read if you’re curious about the health of the consumer in year two of Trump’s economy. Start a 30-day free trial for a full breakdown of all of our proprietary Pulse economic indicators.
