The US Current Account: Goods Are Bad & Ugly
The US current account deficit may seem fantastically large, with over $100bn in payments flowing out of the US relative to inbound payments each quarter, but that works out to less than 2% of GDP at an annual rate; during the last economic expansion, that deficit was as large as 6.3% of GDP.
The US hasn’t run a current account surplus since 1991. To help understand why, it’s worth looking at the composition of the US current account. Any current account balance is made up of debits (payments flowing out) and credits (payments flowing in) in three basic categories: trade (exports are credits, imports are debits), primary income (“earned” income by labor or capital, with US ownership of overseas assets or US workers overseas a credit, and overseas ownership of US assets or foreign workers in the US a debit), and secondary income (“transfers”, which are typically remittances to home countries by residents to relatives overseas, and sometimes foreign aid).
The Sankey chart below helps show how all the credits and debits stack up, with debits much larger than credits and hence the US current account being in a deficit. Since there’s a lot of information in the graph, it may be helpful to click it and enlarge.
As shown, the US current account deficit is driven mostly by the US trade deficit. While primary and especially secondary income is relatively small in the scope of gross payments, the US actually enjoys a surplus in primary income and secondary income flows are tiny. The primary plus secondary income categories collectively have a small surplus, all of which is consumed by trade deficits and specifically goods trade deficits. Taking all current account payments together except goods trade, the US actually runs a surplus of over $100bn. In other words, trade deficits in goods are so large that they overwhelm relatively robust surpluses in services and primary income, less small deficits in the modestly sized secondary income category.
In the 6 major categories of goods trade (food/feed/beverages, industrial supplies/materials, capital goods ex autos, autos/parts, consumer goods ex auto, and other), the only US surplus is in the food/feed/beverages category, with the largest deficit ($106bn) coming from consumer goods other than autos. Automotive and parts trade has a deficit about half as large, while industrial supplies and capital goods combine to bring a $200bn swing in the overall current account from goods trade balances.

Jobless Claims Move Towards a “1” Handle
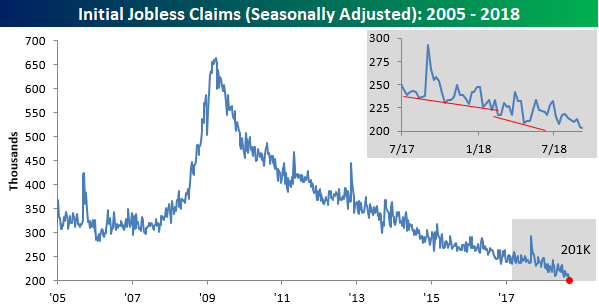
In their quarterly conference call on Thursday, Darden (DRI) CEO Gene Lee noted that the “workforce pool in the US is shrinking,” and this week’s Jobless Claims report confirmed that sentiment. While first time claims were expected to come in at an absurdly low level of 210K, the actual reading was even lower at 201K. That’s getting awfully close to a ‘1’ handle on the weekly print, which is a level we haven’t seen since November 1969. With this week’s print, claims have now been at or below 300K for a record 195 straight weeks, at or below 250K below for 50 weeks (longest streak since January 1970), and at or below 225K for eleven straight weeks (longest streak since 1969).
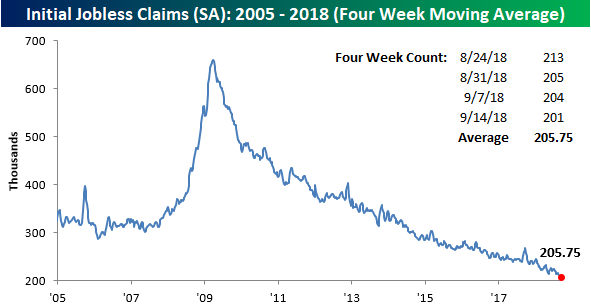
With this week’s low print, the four-week moving average also ticked down to a new multi-decade low of 205.75K from 208K last week. The last time the four-week average was this low was in December 1969.
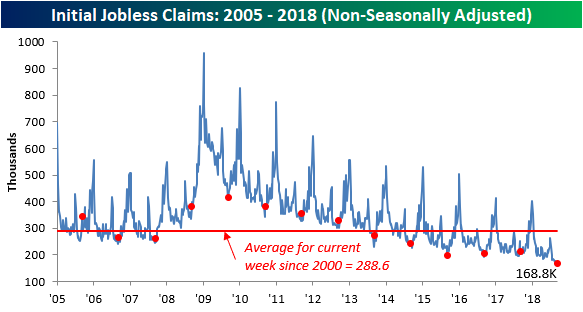
Finally, on non-seasonally adjusted (NSA) basis, claims ticked modestly higher, rising from 162.3K up to 168.3. For the current week of the year, this is the lowest reading since 1969, and it’s nearly 120K below the average for the current week of the year dating back to 2000.
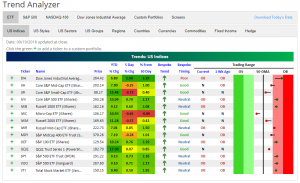
Trend Analyzer — DIA Leads, Small and Mid Cap Fall Behind — 9/20/18
From our Trend Analyzer, 8 of the Major US Index ETFs are overbought, 6 are neutral and none are oversold. Much like earlier in the week, most of the overbought ETFs are not deep in overbought territory, with the exception of the Dow (DIA). In terms of change from one week ago, DIA has more than doubled the next best performer. It is also the most overbought out of the US Index ETFs.
While the DIA has outperformed, the rest of the group has fallen behind, especially small to mid-cap focused ETFs. The S&P MidCap 400 (MDY), Core S&P Mid-Cap (IJH) and Core S&P Small-Cap (IJR) are all down from one week ago alongside the Russell 2000 (IWM) and the continuously week Micro-Cap ETF (IWC). The Russell Mid-Cap (IWR) is barely positive over the last week.
The Closer — Market Trends, Current Account Bends — 9/19/18
Log-in here if you’re a member with access to the Closer.
Looking for deeper insight on markets? In tonight’s Closer sent to Bespoke Institutional clients, we take a look at notable market developments in markets: the dollar holding up better than small caps would suggest they should be, tentative signs of life in EMFX, real yields nearing cycle highs, and breadth in US large caps. We also break down the US current account balance, updated for Q2 today by the BEA. Finally, we finish with a review of EIA petroleum market data and energy market price action.

See today’s post-market Closer and everything else Bespoke publishes by starting a 14-day free trial to Bespoke Institutional today!
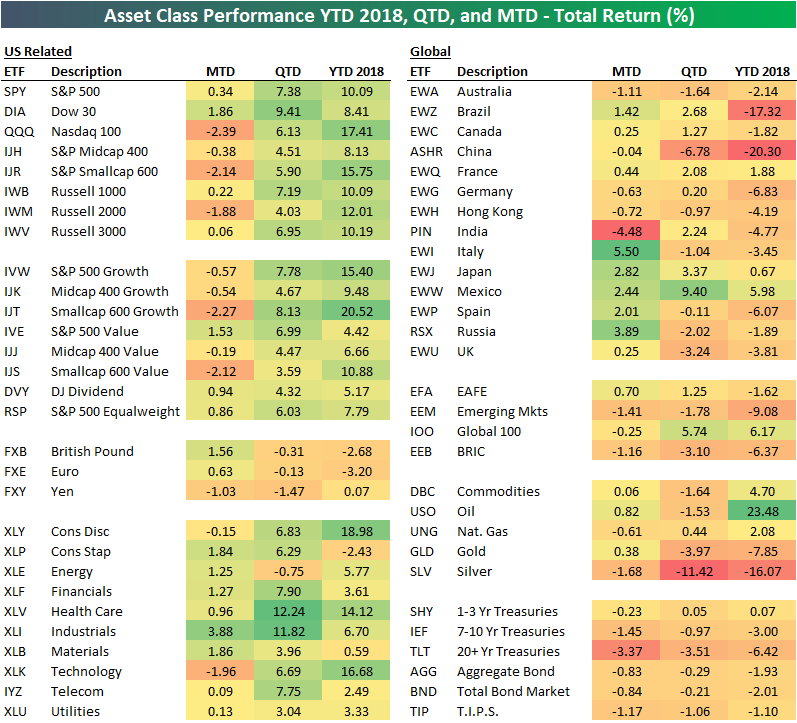
Asset Class Performance MTD, QTD, and YTD 2018
Below is an updated look at the performance of various asset classes using key ETFs tracked in our Trend Analyzer tool. For each ETF, we show its total return month-to-date, quarter-to-date, and year-to-date.
While September has been an up month so far for the S&P 500 (SPY), we’ve seen some rotation out of the strategies that were working in 2018 prior to the start of the month. You’ll notice that areas like the Nasdaq 100, the Technology and Consumer Discretionary sectors, and small-caps are all down in September, but they’re also the areas that are still up the most year-to-date. Conversely, the Dow 30 (DIA) has been the weakest of the three big US indices (Dow, S&P 500, and Nasdaq 100) in 2018, but it’s doing the best of the three in September.
Outside of the US, we’ve seen big moves higher for Italy (EWI), Japan (EWJ), Mexico (EWW), Spain (EWP), and Russia (RSX), while India (PIN) and Australia (EWA) have both fallen. Brazil (EWZ) and China (ASHR) remain as the worst international performers on a year-to-date basis.
The commodities ETF (DBC) is pretty much flat on the month along with oil (USO) and gold (GLD), while Treasury ETFs are down across the board. The 20+ Year Treasury ETF (TLT) has been one of the worst performing asset classes in September with a drop of 3.37%.
US vs. Rest of World: Relative Strength Charts
Our weekly Global Macro Dashboard is a useful tool for macro or international investors looking for regional and/or country coverage. You can read more about the report here if you’d like to take a look.
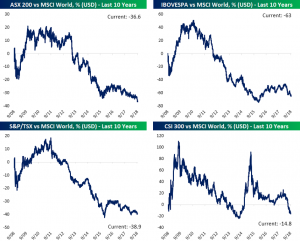
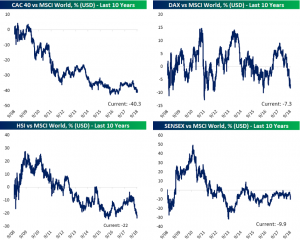
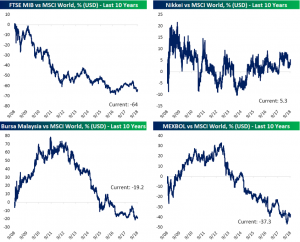
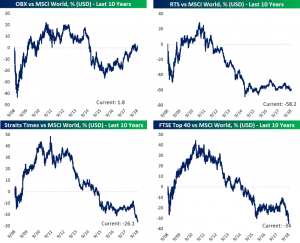
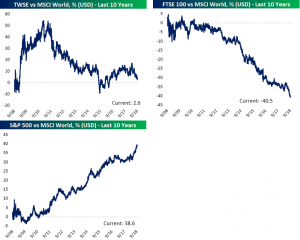
In the report, we provide 10-year relative strength charts of each country’s stock market versus the MSCI World index. This tells you how well each individual country’s stock market is performing versus the rest of the world.
US outperformance versus the rest of the world has been a major theme of 2018, and our country relative strength charts do a great job of highlighting this theme.
First, take a look below at the relative strength chart of the US (S&P 500) versus the MSCI World index. The US has been outperforming international equities for the entire bull market, but it has really ramped up its outperformance over the last few months.
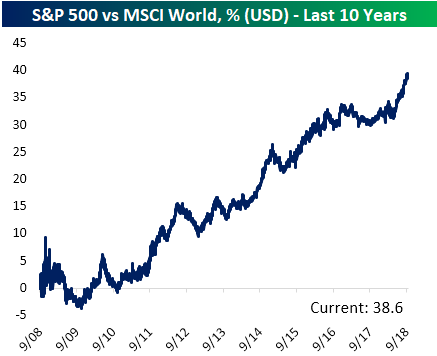
Of the 22 additional countries that we feature in our Global Macro Dashboard, you won’t find another relative strength chart that looks even remotely similar to the US. Nearly every country continues to see its relative performance versus the MSCI World index trend lower and lower. The US continues to be the place to be when it comes to stocks.

The Worst Week of the Year
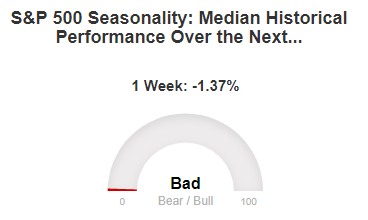
Our Stock Seasonality tool (available to Bespoke Premium and Bespoke Institutional members) lets users see how various indices, sectors, stocks, and ETFs typically trade throughout the calendar year. When the tool is opened, it automatically populates the S&P 500’s median change over the next week, month, and three months.
When we opened up the Stock Seasonality tool today, we were greeted with the gauge below showing absolutely brutal seasonal trends for the next trading week. Indeed, from September 19th through September 26th over the last 10 years, the S&P 500 has seen a median decline of 1.37%. As the gauge shows, that’s as bad as it gets compared to all other one-week periods throughout the year.
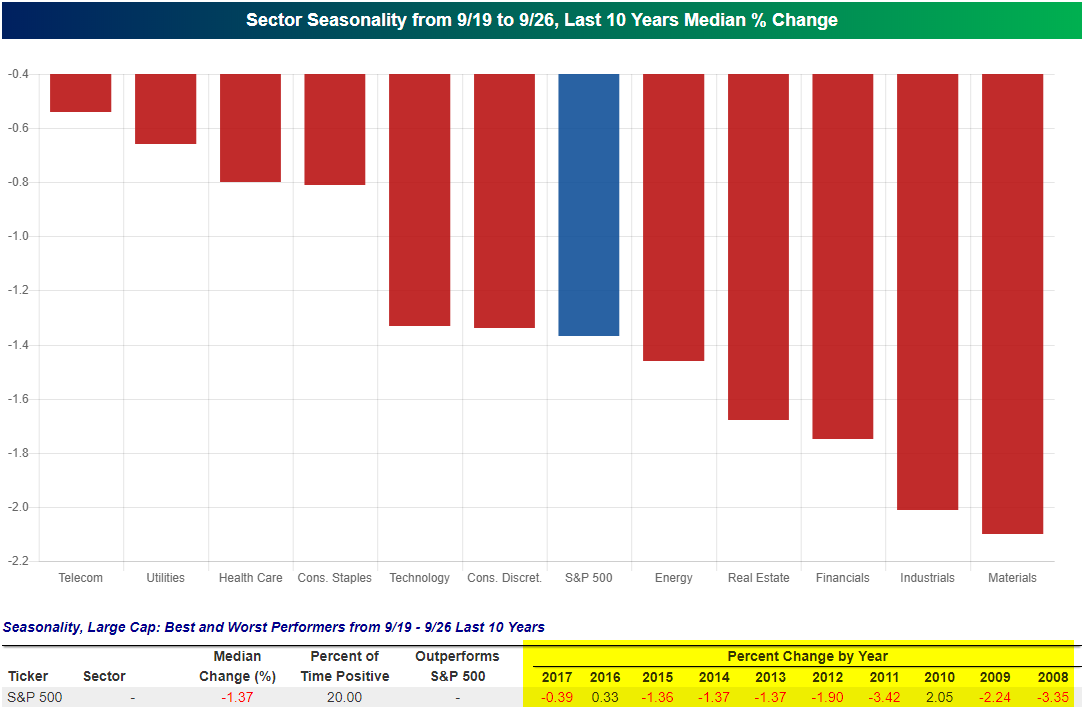
Below is another snapshot that you’ll find when opening our Stock Seasonality tool that shows median sector performance over the next trading week. Over the last ten years, every S&P 500 sector has seen a median decline, with Materials and Industrials falling the most at more than 2%.
For the S&P 500 as a whole, the index has only gained from 9/19 to 9/26 twice over the last ten years (2016, 2010), which is pretty bearish considering the index has been in a raging bull market since 2009.
Start a two-week free trial to Bespoke Premium to try out our Stock Seasonality tool today!
Bitcoin, Meet Tilray (TLRY)
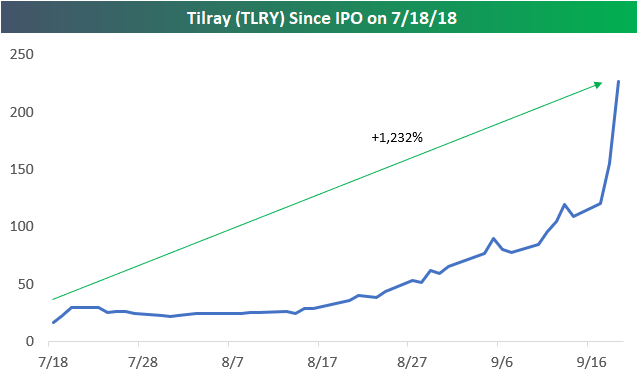
As mentioned in a post earlier, shares of cannabis drug maker Tilray (TLRY) have gone absolutely bananas in the short time it has been public. In the 47 trading days since its IPO, the stock is already up over 1,200%. In order to help put the stock’s surge in perspective, we wanted to compare its recent performance to the performance of bitcoin during its monster surge in 2017. For starters, consider this: during all of 2017, bitcoin rallied just over 1,400%. TLRY has done nearly that in two months!
The chart below shows the 25-trading day rolling performance of bitcoin throughout 2017 and into 2018. For practically all of 2017, bitcoin’s rolling return remained positive and when it went into negative territory, it rarely dipped very low or stayed there long. On the upside, though, there were multiple periods where the rolling 25-day return topped 100%, and at the height of the mania in late 2017, bitcoin actually rallied close to 200% in just five weeks! Pretty impressive, right?
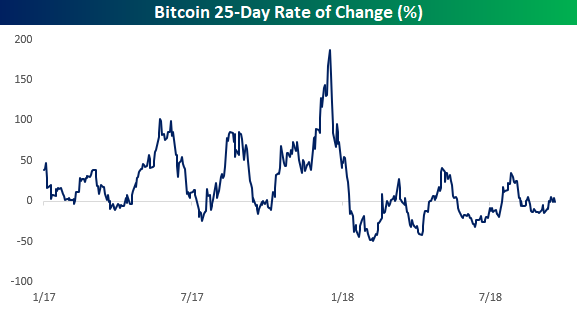
The chart below is the same one as above, except we have adjusted the y-axis to include the level that corresponds to TLRY’s current five-week return of +691%. Suddenly, bitcoin’s move doesn’t look quite as impressive, does it? In fact, at the peak of the bitcoin mania in 2017, its trailing 25-day return peaked out at 187%. That’s less than a third of TLRY’s gain over the last five weeks. Granted, bitcoin managed to post strong returns for a much longer period than TLRY has so far. In terms of the magnitude of short-term moves, however, bitcoin doesn’t hold a candle to TLRY.

Tilray (TLRY): Canadian Blue Chip?
Canadian-based Tilray (TLRY) is up 1,232% since it IPOd two months ago on July 18th.
Wait, say that again!? Yes, TLRY is up more than 1,200% since going public just two months ago!
What does TLRY do? It’s a cannabis drug-maker, of course.
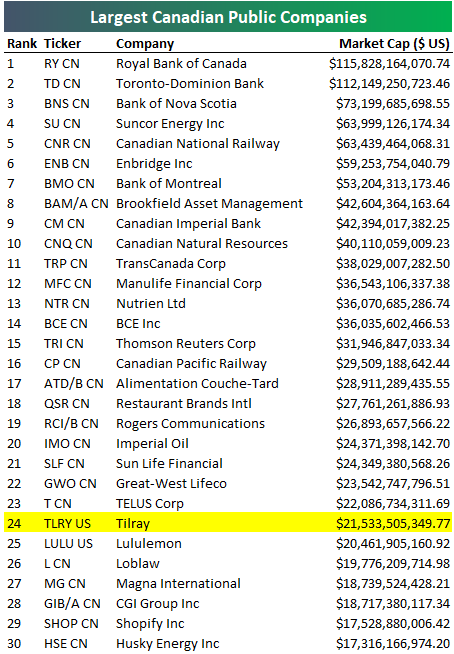
As the cannabis wave has swelled, Tilray’s massive gain over the last two months has left it with a market cap of $21.5 billion (USD). As shown below, this ranks Tilray as the 24th largest publicly traded company based in Canada. At $21.5 billion, TLRY’s market cap is now a billion dollars larger than lululemon (LULU), which is one of the most well known consumer brands based on Canada.
We have no comment on how or when this insane rally will end, except we’re confident that plenty of investors will end up losing their shirts.
Another Seasonal Trend Fails to Deliver
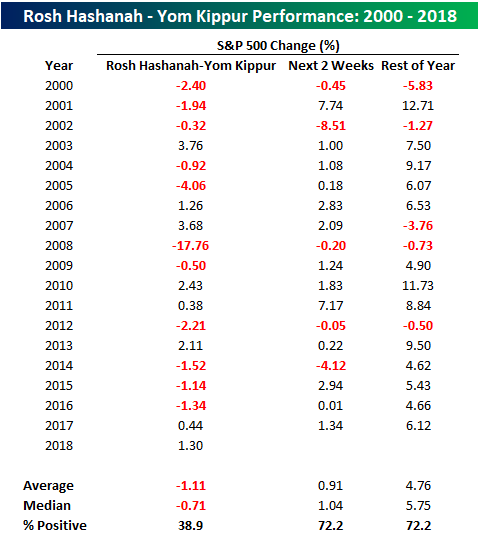
We pay close attention to historical trends in the market and believe that investors should be aware of them, and in certain cases incorporate them into their process, but we have also always contended that investing based solely on the calendar is not the wisest of investment strategies. This year has been a perfect example. Sell in May and go away? Nope. September swoon? Not quite. The latest seasonal trend not to work this year is the somewhat less well-known, sell Rosh Hashanah, buy Yom Kippur.
In recent history, this seasonal trend based on the holidays of the Jewish New Year and Day of Atonement has actually been pretty consistent. Going back to 2000, the S&P 500 has seen an average decline of 1.11% (median: -0.71%) during the ten-day period with positive returns less than 40% of the time (see table below). What’s more, being out of the market during this period also would have avoided the nearly 18% decline that took place during the Financial Crisis in 2008. While there are a number of theories as to why this trend has worked over time, the most likely probably has to do with the fact that the period always occurs somewhere between early September and early October which has historically been one of the worst times of the year for equities.
While it has worked relatively well in the past, in 2018, the sell Rosh Hashanah, buy Yom Kippur trade hasn’t worked out for anyone following it. Through early afternoon Wednesday (Yom Kippur ends today), the S&P 500 is up 1.3% since the start of Rosh Hashanah, which is its best showing during this period since 2013.
While the period between Rosh Hashanah and Yom Kippur has historically been weak for equities, the two weeks after Yom Kippur have been very positive. Since 2000, the S&P 500 has averaged a gain of 0.91% (median: 1.04%) with positive returns nearly three-quarters of the time. For the remainder of the year, the results are similarly as strong with an average gain of 4.76% (median: 5.75%).
With the S&P 500 bucking the typical trend over the last week and a half, does that mean we can expect the market to do the opposite going forward? It’s possible, but prior history doesn’t suggest it. In fact, in prior years where the S&P 500 traded up during this period, it saw even stronger returns going forward. In the seven years where the S&P 500 was up from Rosh Hashanah through Yom Kippur, it traded up an average of 2.35% (median: 1.83%) in the following two weeks with positive returns all seven times. For the remainder of the year, the S&P 500’s average gain was 6.64% (median: 7.50%) with gains in all but one period (2007).