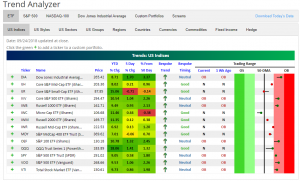
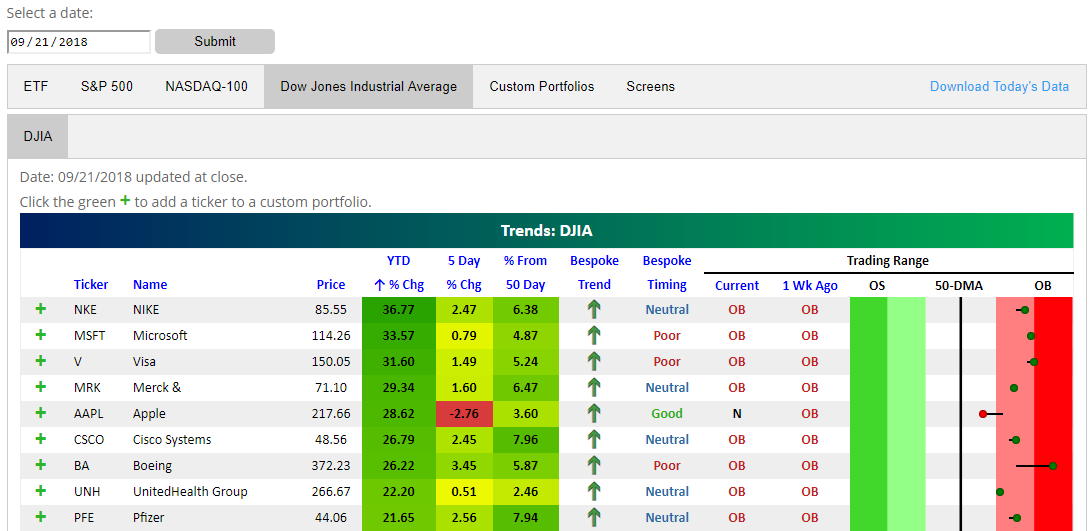
Trend Analyzer – 9/25/18 – Better and Worse
Markets were down on political news at the close yesterday with the Dow falling 0.68% and the S&P 500 down 0.35%. These price movements are making our Trend Analyzer resemble how it looked most of last week. Half of the major US Index ETFs are trading in neutral territory. The other half is overbought. Fortunately, with the exception of Core S&P Small-Cap (IJR) and S&P MidCap 400 (MDY), every ETF is above where it was one week prior. This is giving every neutral ETF a good timing rating.
Bespoke Morning Lineup – 9/25/18
Yesterday marked the end of an impressive streak for the S&P 500 Industrials sector where it had previously closed higher than it opened for 15 consecutive trading days! As shown in the chart below, before the current streak, the prior record for the longest stretch of daily closes above the open was nine trading days. That happened three prior times (April 2004, September 2009, and January 2018). Following those three periods, the sector’s performance was mixed to poor. One month after the day when the streak was broken, the sector was down all three times for an average decline of 2.5%. Not a major decline, but not positive either.

Start a two-week free trial to Bespoke Premium to see today’s full Morning Lineup report. You’ll receive it in your inbox each morning an hour before the open to get your trading day started.

The Closer — Gas Floats, Brazilian Jobs & Payments, Five Fed Teetering — 9/24/18
Log-in here if you’re a member with access to the Closer.
Looking for deeper insight on markets? In tonight’s Closer sent to Bespoke Institutional clients, we take a look at the very impressive run the natural gas market has been on. We also review some Brazilian macro data, before updating our Five Fed index of regional Fed manufacturing activity.

See today’s post-market Closer and everything else Bespoke publishes by starting a 14-day free trial to Bespoke Institutional today!
New S&P 500 Sector Weightings – What You Need to Know
The new GICS sector re-classifications finally took place today, and below are the details.
Sector classifications for public companies are determined by the Global Industry Classification Standard (GICS), which is maintained by S&P and MSCI.
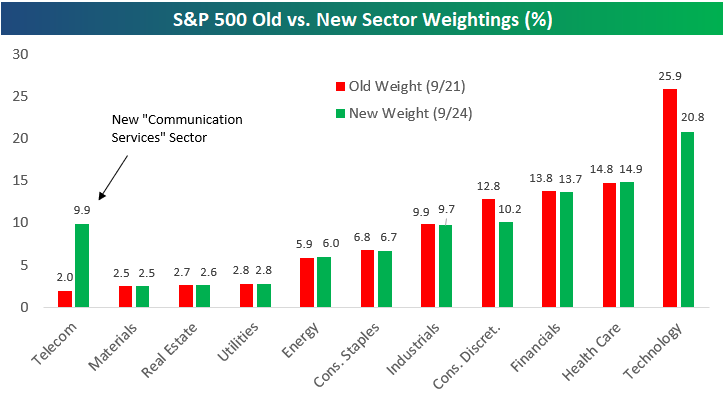
Below is a table showing S&P 500 sectors with both their new weightings and old weightings in the index. We also include the ETF that investors can use to gain exposure to each sector. As shown, the old Telecommunication Services sector is no more, and the new sector is called the Communication Services sector (ETF=XLC). The 3 Telecom stocks that made up just 1.98% of the S&P 500 as of last Friday are now part of the new Communication Services sector, which has a weighting of 9.93%. The only other sectors that are affected are Technology and Consumer Discretionary. Due to re-classifications, Technology’s weighting drops by 5.1 percentage points down to 20.84, while Consumer Discretionary’s weighting drops 2.68 percentage points down to 10.16%.
For Bespoke’s in-depth sector analysis, start a two-week free trial to Bespoke Premium.
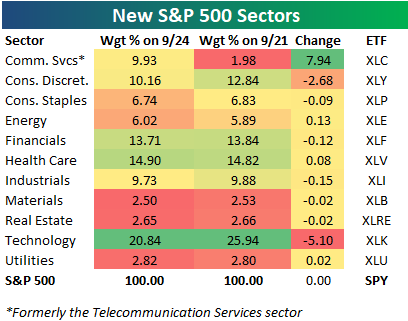
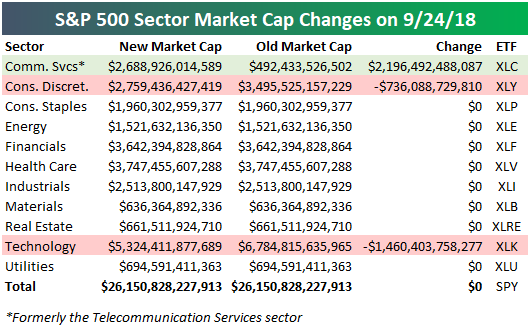
Below we chart the data in the table above:
In terms of size, the new S&P 500 Communication Services sector has a total market cap of $2.69 trillion, which is $2.2 trillion more than the old Telecommunication Services sector’s market cap.
The Consumer Discretionary sector now has a market cap of $2.76 trillion, which is down roughly $736 billion from where it stood last Friday. The Technology sector now has a market cap $5.3 trillion, which is down $1.46 trillion.
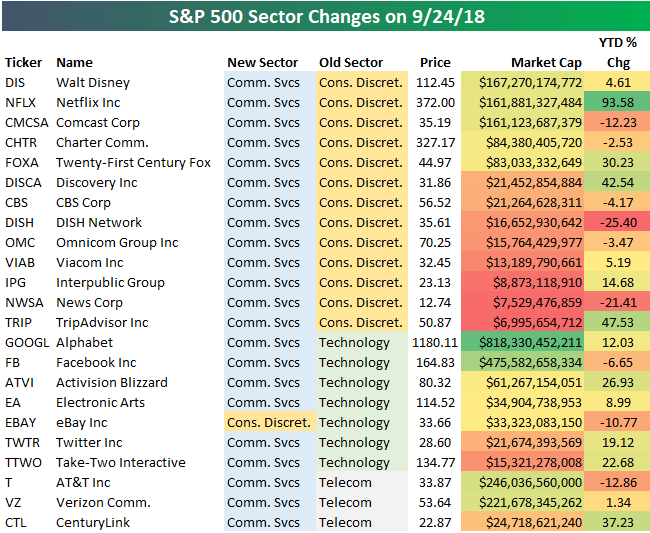
Below are the 23 S&P 500 companies that saw sector re-classifications. The main stocks shifting from Consumer Discretionary into Communication Services are Disney (DIS), Netflix (NFLX), and Comcast (CMCSA). Others making the same shift include Charter (CHTR), Twenty-First Century Fox (FOXA), CBS, Viacom (VIAB), News Corp (NWSA), and TripAdvisor (TRIP).
Six companies are shifting from Technology into Communication Services — Alphabet (GOOGL), Facebook (FB), Activision Blizzard (ATVI), Electronic Arts (EA), Twitter (TWTR), and Take-Two Interactive (TTWO). One Tech stock — eBay — is shifting into Consumer Discretionary (joining Amazon.com).
Finally, AT&T (T), Verizon (VZ), and CenturyLink (CTL) all shift from the old Telecom sector into Communication Services.
UST Yields vs S&P 500 Dividend Yields
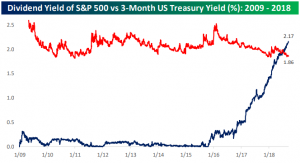
As interest rates have risen in the last year, we have seen a number of charts similar to the one below comparing the yield on the 3-Month US Treasury (UST) to the dividend yield of the S&P 500. For the vast majority of the current bull market (up until only a couple months ago) short-term interest rates have been below the dividend yield of the S&P 500. Since the FOMC began hiking rates over two years ago, short-term UST rates have risen. This year, they rose above the S&P 500 dividend yield; a key inflection point creating talk that the higher yield on cash makes UST more attractive than equities.
Relative to the current bull market, this may seem impressive. On a longer time horizon, though, this is not the case. Prior to 2009, instances where short-term Treasuries yielded less than the S&P 500 were few and far between. This cross in yields is by no means a red flag for equities, rather, it is a return to what has been historically normal.
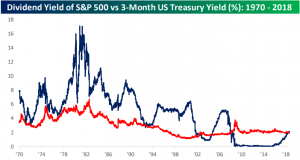
Chart of the Day: Brent Busts Out
Nike (NKE): Just Doing It on Earnings for Six Years
Nike (NKE) has been a beast lately. Since launching its new Colin Kaepernick campaign in conjunction with the start of the 2018 NFL season earlier this month, the stock has added $6 billion in market cap, traded to new all-time highs, and now leads the Dow 30 in year-to-date performance. This weekend Nike got another boost when Tiger Woods — maybe the most well-known athlete in the world and forever linked with Nike — won his first PGA Tour event in five years. Seriously, the company is on a roll.
Nike (NKE) likely won’t be making any big sports news on Tuesday, but investors will get to see how good of a quarter the company had when it releases earnings results after the close tomorrow. Historically, Nike has been a beast on earnings as well.
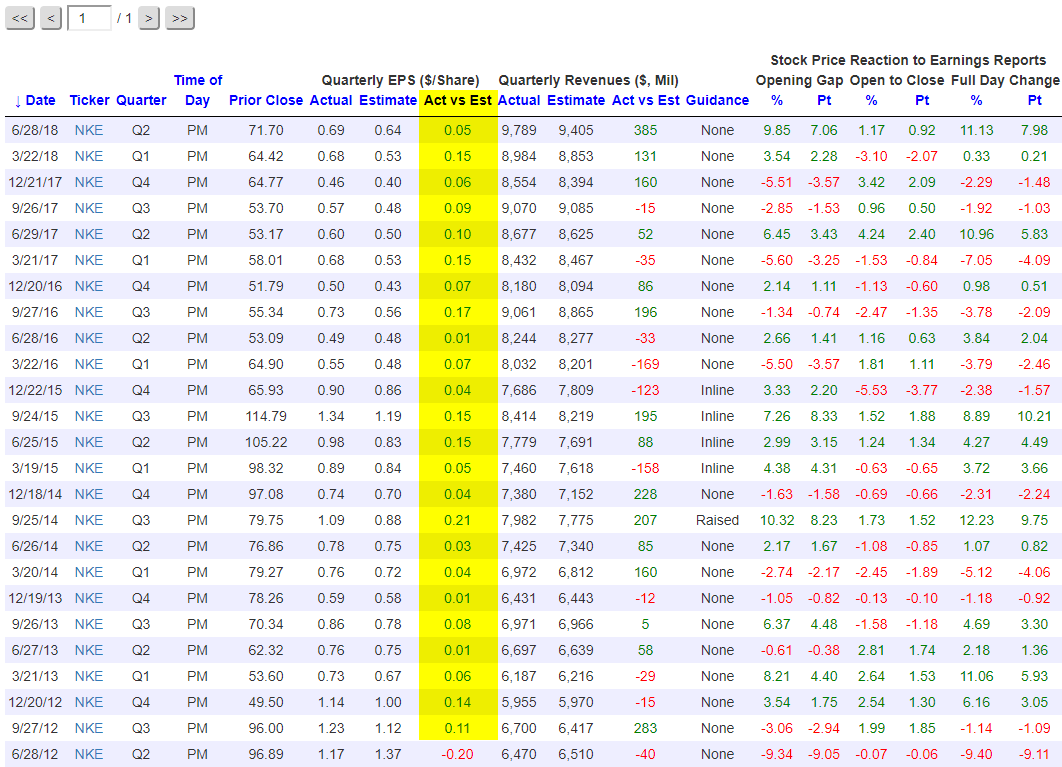
Our Interactive Earnings Screener lets users pull up historical quarterly earnings results for any company dating all the way back to 2001. (Be sure to check out the Screener at some point if you have yet to do so.) Below is a snapshot of Nike’s quarterly results from our Screener dating back to June 2012.
Highlighted in yellow in the snapshot below is the difference between Nike’s actual EPS number and its consensus analyst EPS estimate. As shown, Nike (NKE) has beaten earnings estimates for 24 consecutive quarters (6 years) dating back to September 2012! The last time Nike missed earnings was in June 2012. Back then, Colin Kaepernick was one year into his NFL career as Alex Smith’s back-up in San Francisco. Later that year Kaepernick would go on to replace an injured Smith in week 10, sparking a QB controversy under Coach Jim Harbaugh that ultimately led to Kaepernick keeping the job and taking the 49ers to Super Bowl 47 where they lost to the Baltimore Ravens.
On June 28th, 2012 when Nike last missed EPS estimates, Tiger Woods was beginning play in the AT&T National at Congressional in Bethesda, MD — a tournament he would go on to win by 2 strokes ahead of Bo Van Pelt. It was Tiger’s 3rd and final PGA Tour win of 2012 after going win-less since 2009 when his affair allegations first broke.
While Nike has managed to beat EPS estimates for 24 consecutive quarters, the company has only beaten revenue estimates 15 out of its last 24 quarters. The revenue misses have not impacted stock performance in reaction to earnings by much, however. Over Nike’s last 24 earnings reports, the stock has averaged a one-day gain of 2.11% on its earnings reaction days with positive returns posted 58% of the time. Over the same time frame, we’ve seen more than 64,000 quarterly reports across the US stock market, and the average stock has gained 0.01% on its earnings reaction day.
All of the earnings stats quoted in this article come from our Interactive Earnings Screener, which is available for use as part of our Bespoke Institutional package. It’s truly an invaluable tool for investors. Start a two-week Bespoke Institutional free trial to try it out today.
Leading Indicators Shows No Signs of Slowing
The analysis below is pulled from last Friday’s Bespoke Report newsletter. To read the full report, start a two-week free trial to any of our three membership levels.
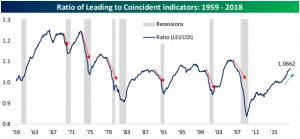
The Leading Indicators report released this past Thursday reinforced signals of a strong US economy. From this release, there do not appear to be signs of a looming recession. Below we show the ratio of Leading Indicators to Coincident Indicators over the past 60 years. Historically, this ratio has been a very good leading indicator of recessions. Typically, but not always, when the ratio peaks then begins to fall, a recession is around the corner. This does not mean that a recession is necessarily in the near future. In fact, the ratio usually peaks in excess of a year before a recession and typically rolls over by the time the recession starts. Last Thursday’s reading showed no signs of a reversal; rising to a cycle high of 1.0662.
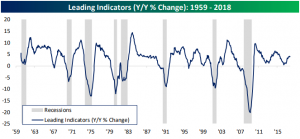
Another way of looking at this indicator is on a year-over-year basis. This tells much of the same story. Months or even years before a recession begins, the reading peaks then begins to decline. Right before a recession, it has never been on the rise.
August’s report came in at 6.41%, which is the second-highest level since July 2014. Since 1980, the earliest a recession came following a period where the y/y change in leading indicators was above 5% was 24 months. The average amount of time that elapsed from the last 5% or more reading to the earliest stages of a recession was 35 months. No matter which way you cut it, the Leading Indicators do not show signs of a slowing economy.
The analysis above is pulled from last Friday’s Bespoke Report newsletter. To read the full report, start a two-week free trial to any of our three membership levels.
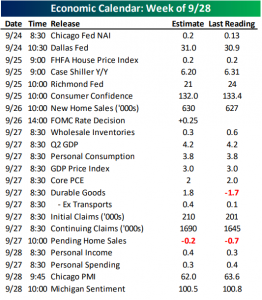
This Week in Economic Data
Last week was fairly quiet on the economic data front. This week is set to be busier with 22 US reports including an anticipated rate hike by the FOMC on Wednesday. Some releases worth mentioning are Consumer Confidence on Tuesday; followed by Michigan Confidence on Friday. Additionally, Thursday will be a busy day of economic data with the third release of Q2 GDP alongside Personal Consumption, Core PCE, Durable Goods, and Pending Home Sales. On Thursday we will also see if jobless claims continue to impress. Finally, after last week’s mixed manufacturing reports from the NY Fed and Philly Fed, Friday’s Chicago PMI release can hopefully provide some clarity to the overall manufacturing outlook of the US.
As always, you can see all of the day’s economic releases with our Economic Monitor.
The Dirty Dozen
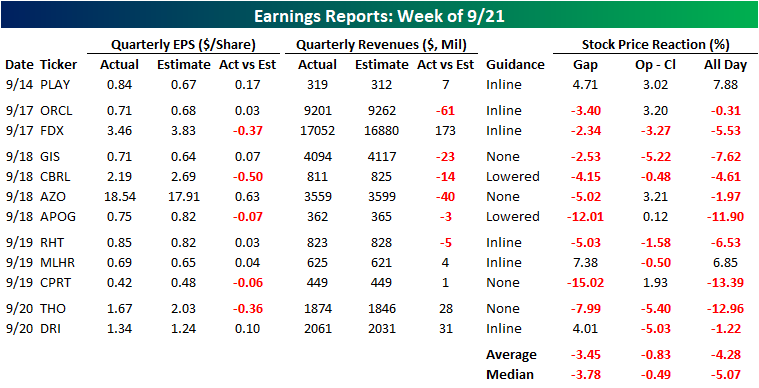
In numerous reports over the last several months for both clients and on the blog, we have repeatedly highlighted the positive impact of earnings and the reaction of investors to them as an important driver for the market. In recent quarters, the percentage of companies exceeding EPS forecasts has consistently been strong in the mid-60% range. Earnings season doesn’t really kick off for another two to three weeks, so it will be impossible until then to see if any of the strong earnings trends are shifting. That being said, early indications haven’t been positive. Using our Earnings Report Screener, we found that in what was an admittedly limited sample size, the twelve companies that reported earnings last week generally had weak results and even weaker stock price reactions.
As shown in the table below, only twelve companies reported earnings last week, but of those, just seven exceeded bottom line EPS forecasts, while only six beat on the top line. A number of these companies were small-cap companies, but FedEx (FDX) had a pretty notable EPS miss, while Oracle (ORCL) missed on the top line, which led both to decline on their earnings reaction days. Overall, stock price reactions were, to put it mildly, bad. Of the 12 companies reporting EPS last week, ten of them saw declines on their stock price reaction days for an average decline of 4.28% and a median drop of just over 5%. Again, it’s a limited sample size, but if Q3 earnings season comes in as bad as these early indications, it could be a long Fall.