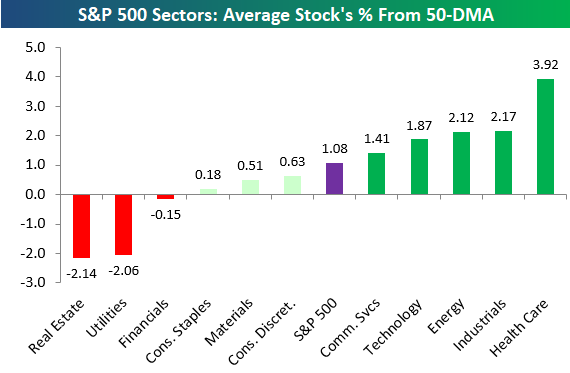
New S&P 500 Sector Breadth Levels
Below is a look at the average stock’s distance from its 50-day moving average using the new GICS sector re-classifications that were made earlier this week. As shown, the average stock in the broad S&P 500 is 1.08% above its 50-day moving average, while Health Care stocks are the most extended at +3.92%. Four other sectors have readings above the overall average — Industrials, Energy, Technology, and the new Communication Services sector.
On the downside, there are three sectors with negative readings. The average Real Estate stock is 2.14% below its 50-DMA, which is the weakest of any sector. Utilities and Financials are the two other sectors in the red.
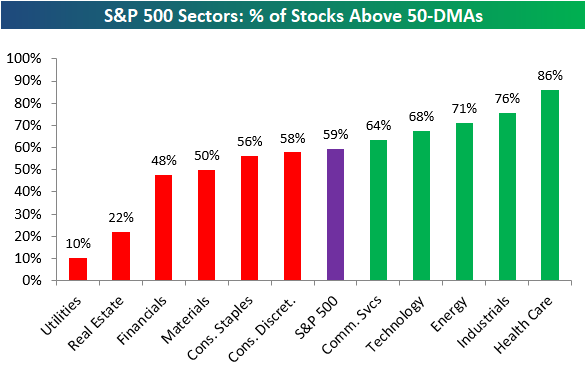
In terms of breadth, 59% of S&P 500 stocks are above their 50-day moving averages, and five sectors have stronger readings than that — Health Care (86%), Industrials (76%), Energy (71%), Technology (68%), and Communication Services (64%).
Just 10% of Utilities stocks are above their 50-day moving averages, which is by far the weakest breadth reading of any sector. Financials and Real Estate are the only other sectors with readings below 50%.
For Bespoke’s in-depth sector analysis, start a two-week free trial to Bespoke Premium.
Mexico Unemployment Improves Again
This morning, Mexican Unemployment for the month of August declined to a seasonally adjusted rate of 3.29% versus estimates for a reading of 3.33%. Coming off of July’s 3.35% and a June uptick to 3.4%, we have now seen a continual downtrend in unemployment over the course of the past several years. While this month’s reported data is by no means a record low, Mexico is closing back in on the May low when unemployment sat at its lowest level since May 2006. We are currently sitting right around pre-crisis levels, but are still well above the lows of ~2% from the early 2000s. This positive data comes on the backs of Mexico and the United States working to create a trade agreement to replace NAFTA, but that development is not likely to have an impact on hard data any time soon given the fact that the US and Mexico would have to withdraw from NAFTA for the bilateral agreement to go into effect.
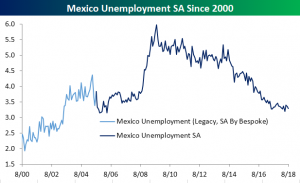
Note: in the graph above, data predating September 2005 is NSA legacy data that Bespoke has seasonally adjusted.
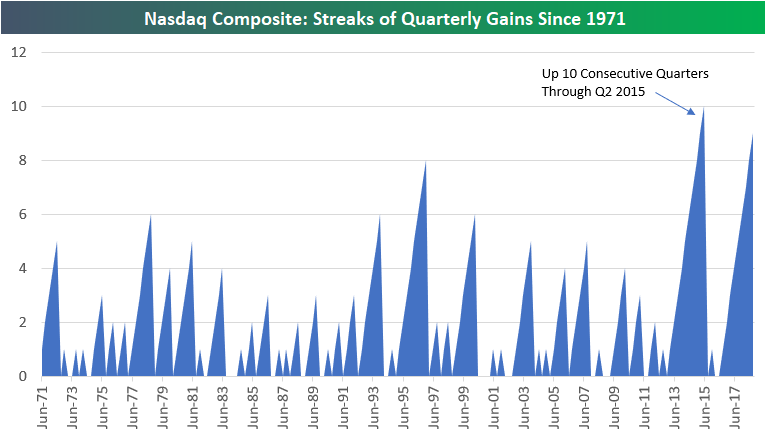
Nasdaq Up 9 Quarters in a Row…Again
The Nasdaq Composite is set to finish higher for the 9th consecutive quarter when exchanges close this Friday, September 28th. (With a QTD gain of more than 6%, it would take a dramatic plunge over the next two trading days for the quarter to end in the red.)
Below is a chart showing streaks of quarterly gains for the Nasdaq Composite since its inception in 1971.
Nine quarters of gains is not quite the longest streak on record, and it’s not even the longest streak of the last six years! The longest stretch of quarterly gains made it to ten from Q1 2013 through Q2 2015. Prior to that, the record was 8 quarters back in the mid-1990s (Q1 1995 through Q4 1996). Not even during the Dot Com boom of the late 1990s did we see such consistency of gains for the Nasdaq.
While the Nasdaq has been more consistent to the upside during this bull market than it was during its epic late-1990s rally, the size of the quarterly gains seen this time around don’t come close to matching the rallies seen back then. In the chart below, we show the quarterly price change for the Nasdaq going back to 1971. Yes, we’ve seen very nice quarterly gains of 5-10% many times during the current bull, but from 1997 through Q1 2000, the Nasdaq posted seven double-digit quarterly percentage gains, including a gain of 29.5% in Q4 1998 and a ridiculous 48.2% gain in Q4 1999. This period is nothing like the 1990s.
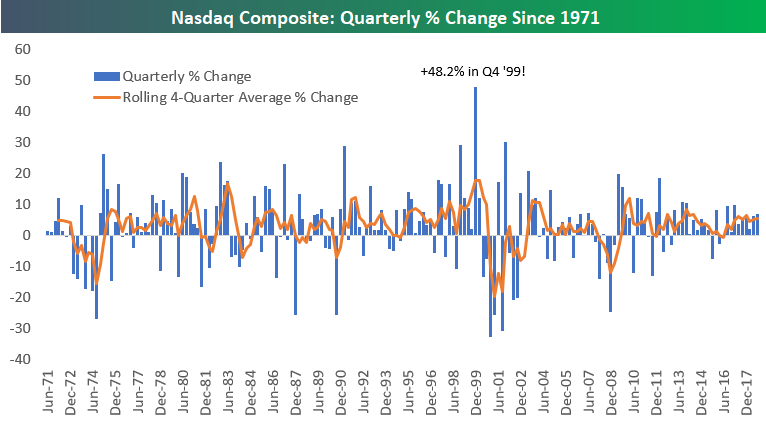
Chart of the Day: Nasdaq at 100 Again
Fixed Income Weekly – 9/26/18
Searching for ways to better understand the fixed income space or looking for actionable ideals in this asset class? Bespoke’s Fixed Income Weekly provides an update on rates and credit every Wednesday. We start off with a fresh piece of analysis driven by what’s in the headlines or driving the market in a given week. We then provide charts of how US Treasury futures and rates are trading, before moving on to a summary of recent fixed income ETF performance, short-term interest rates including money market funds, and a trade idea. We summarize changes and recent developments for a variety of yield curves (UST, bund, Eurodollar, US breakeven inflation and Bespoke’s Global Yield Curve) before finishing with a review of recent UST yield curve changes, spread changes for major credit products and international bonds, and 1 year return profiles for a cross section of the fixed income world.
This week we take a look at the basis swap market.

Our Fixed Income Weekly helps investors stay on top of fixed income markets and gain new perspective on the developments in interest rates. You can sign up for a Bespoke research trial below to see this week’s report and everything else Bespoke publishes free for the next two weeks!
Click here and start a 14-day free trial to Bespoke Institutional to see our newest Fixed Income Weekly now!
B.I.G. Tips — Checkup Time
Trend Analyzer – 9/26/18 – Back to Where We Were
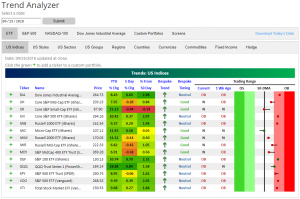
With many indices falling on yesterday’s close from shakey investor reactions to political news, more US Index ETFs are below where they were mid-week last week. Eight ETFs are still overbought while six are now neutral. Although—once again similar to last week—the ones that are currently overbought are not at extreme levels. Smaller and Mid-cap funds have taken these recent hits the worst. Core S&P Small-Cap (IJR) continues to lead the charge downward, with S&P MidCap 400 (MDY) and Russell Mid-Cap (IWR) not far behind. Fortunately, IJR is still the only ETF that has moved below its 50-DMA at this point.
Bespoke’s Global Macro Dashboard — 9/26/18
Bespoke’s Global Macro Dashboard is a high-level summary of 22 major economies from around the world. For each country, we provide charts of local equity market prices, relative performance versus global equities, price to earnings ratios, dividend yields, economic growth, unemployment, retail sales and industrial production growth, inflation, money supply, spot FX performance versus the dollar, policy rate, and ten year local government bond yield interest rates. The report is intended as a tool for both reference and idea generation. It’s clients’ first stop for basic background info on how a given economy is performing, and what issues are driving the narrative for that economy. The dashboard helps you get up to speed on and keep track of the basics for the most important economies around the world, informing starting points for further research and risk management. It’s published weekly every Wednesday at the Bespoke Institutional membership level.
You can access our Global Macro Dashboard by starting a 14-day free trial to Bespoke Institutional now!

Morning Lineup – Happy Fed Day
It’s a relatively quiet morning for US equities ahead of this afternoon’s expected rate hike from the FOMC. US futures are slightly higher but have been fading. In trade news, there is some optimism out there on reports that China plans to cut tariffs on up to 1,600 items beginning on November 1st. Read all about today’s news and events in our Morning Lineup below.
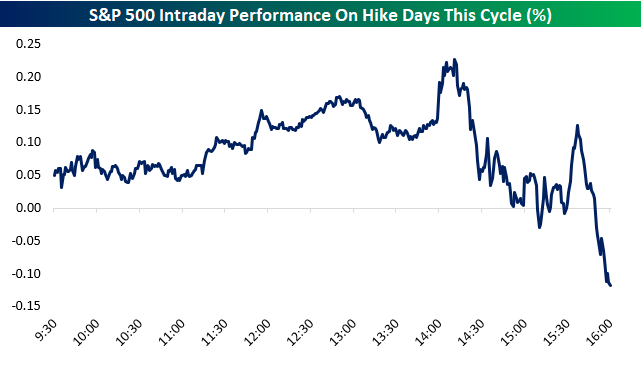
As mentioned above, today is also a Fed Day, and with that, we published our regular preview of the report in a B.I.G. Tips report yesterday. One chart we would like to highlight is a composite intraday chart of the S&P 500 on rate hike days over the last year. There have been 3 of them since last September, and the pattern that the S&P has taken on these days has been noteworthy.
As shown, the S&P has gotten off to a good start in the morning of these Fed Days, but afternoon trading has been a different story. After a drift lower from noon to 1:30 PM ET, we’ve seen the S&P catch a bid into the 2 PM rate announcement. From 2 PM to the close, however, we’ve seen the equity market sell-off pretty sharply to take the index into the red by 20+ basis points by the close of trading. It’s a small sample size, but something to keep in mind especially with futures already off their highs.
Start a two-week free trial to Bespoke Premium to see today’s full Morning Lineup report. You’ll receive it in your inbox each morning an hour before the open to get your trading day started.

The Closer — The Debt Is Fine, Global Trade & IP, Canada Update, And An SPV — 9/25/18
Log-in here if you’re a member with access to the Closer.
Looking for deeper insight on markets? In tonight’s Closer sent to Bespoke Institutional clients, we argue that US corporate debt is less worrisome than it’s been made out to be. We also take a look at July global trade and industrial production data updated today before reviewing Canadian macro and a development from the UN today that signals a much larger trend in the world of global macro.

See today’s post-market Closer and everything else Bespoke publishes by starting a 14-day free trial to Bespoke Institutional today!