Chart of the Day: Worst Starts to October for the Nasdaq
B.I.G. Tips – October Reversal
Global Equity Sell-Off
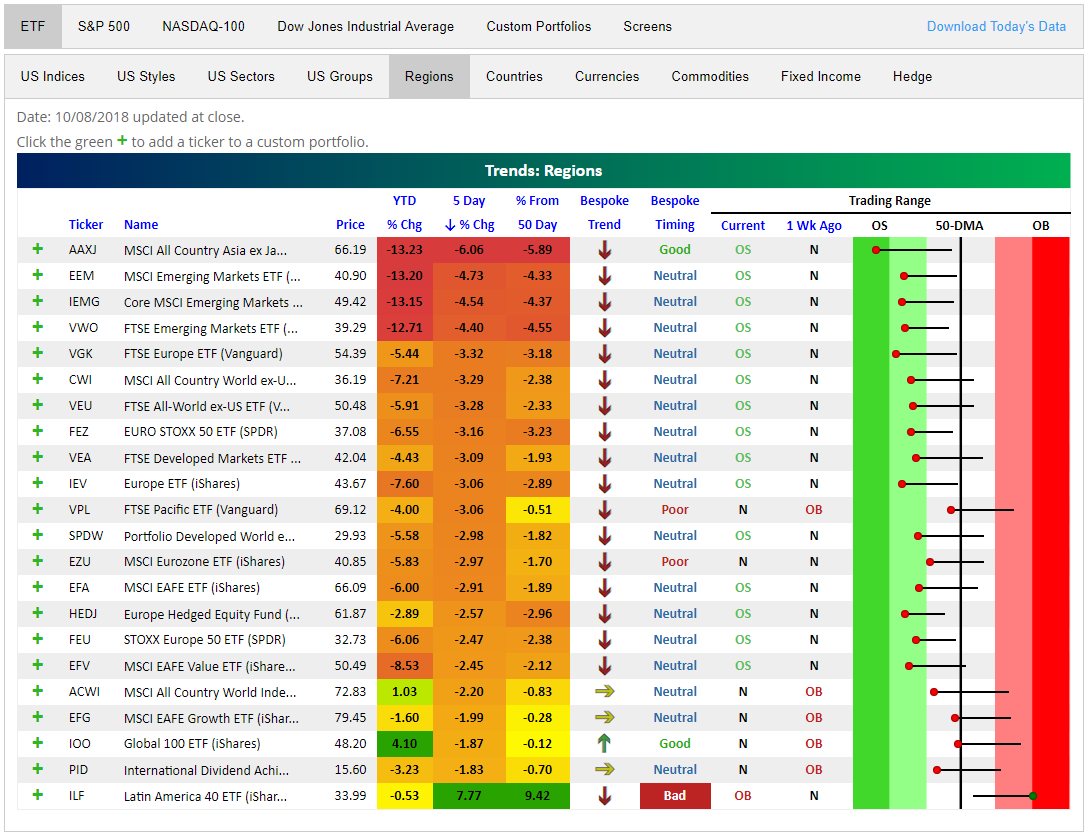
lt’s not exactly news that global markets have been significantly weaker than the US this year. Almost every single international ETF is down year to date; a few of which are down by double digit percentages. Only two have managed to edge out slight gains YTD. The Global 100 (IOO) has seen gains of 4.1% and the MSCI All Country World Index (ACWI) is up 1.03%. Unlike other ETFs in the Regions category of our Trend Analyzer, these two have US exposure that has helped them stay afloat. In the past week though, not even this has been a saving grace; just about every ETF is down well over 1%.
Emerging market ETFs are especially feeling the pain as they have each dropped over 4%. The MSCI All Country Asia excluding Japan (AAXJ) has had the worst performance of all. It has fallen 6.06% in the past 5 days! Looking at the long tails in the Trading Range section of the Trend Analyzer, you can see the large movements below the 50-DMA for most of the ETFs included in this group. This has pushed many deep into oversold territory. All the negativity aside, the Latin America 40 (ILF) has been gaining ground recently with a huge jump up yesterday thanks to Brazilian first round election results. Currently, it is up 7.77% since this time last week. While good, it may be getting overextended. It is the only overbought member of this group sitting 9.42% above its 50-DMA and our Trend Analyzer has given it a bad timing rating based on its extreme overbought reading.

Growth Groups Move to Extreme Oversold
The US has had a rough go of it the past week, which we can explore using our Trend Analyzer. The past few days have seen many indices close lower; namely, the growth groups. Even though many have seen significant gains YTD—US Medical Devices (IHI) is up 24.02% and Retail ETF (RTH) is up 18.4%—in the past week, there has been a rotation out of these names. These groups are plummeting now as the market takes a breather. Even though it is one of the strongest ETFs on the year, IHI has fallen the most over the past 5 days out of all US groups. S&P Biotech (XBI) and the Semiconductor ETF (SMH) are not far behind. All three of these are down over 5% in the past week. Impressive to note though, even falling as much as it did, IHI has not entered its respective oversold territory. Unfortunately, this is not the case with the rest. These large moves since the beginning of October have pushed most growth ETFs deeply oversold.
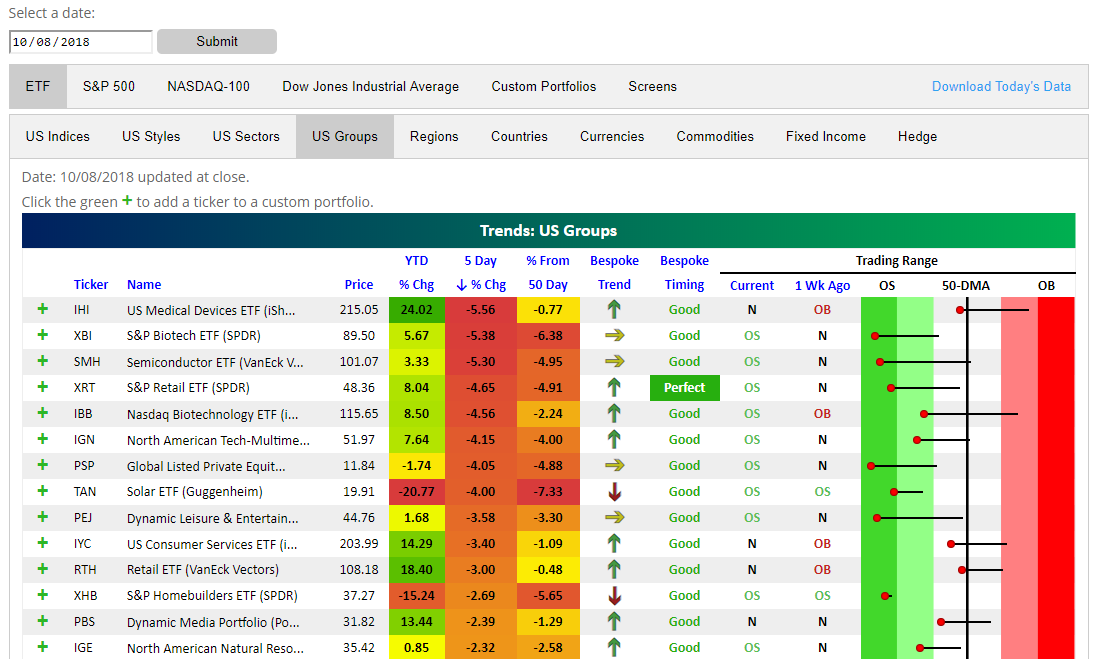
Investors seem to be rotating into Financials and Energy as well as safe assets like gold and real estate. This comes on the back of rising rates and oil prices over the past week. The S&P Regional Banking (KRE) has had the strongest gains of 2.16% over the past 5 days. Insurance (KIE), Exchanges (IAI), Financial Services (IYG), and Mortgage Real Estate (REM) have each seen gains following news of higher rates. Right behind KRE for the largest gains is Junior Gold Miners (GDXJ) rising 1.75% over the same time. This is one of the worst underperformers on the year as gold has fallen consistently. Gold Miners (GDX) while not seeing as large of gains over the past week is seeing a similar pattern. Fears of what’s around the corner seem to have had investors shift out of growth and into safer assets like gold, while higher rates are making financials more attractive.
Morning Lineup – Growth Shrinks
Futures are trading lower again this morning as rising interest rates and weakness in Europe are keeping a lid on any gains in the US. Worries over earnings are also a concern as we head into earnings season.
Earnings season hasn’t even started, but already we may have one company that will serve as a microcosm for all the concerns that investors have heading into the period. Last night, PPG Industries (PPG) lowered guidance for the quarter citing factors like rising input costs, weaker demand from the auto sector for its paints, softening demand from China due to trade tensions, the stronger dollar hurting foreign demand and weakness in emerging markets. If you were to sum up all of the concerns that investors have that could possibly have a negative impact on company results in Q3, PPG mentioned them!
Growth stocks have been taking it on the chin over the last three days, and once again we find ourselves in a situation where they are sharply underperforming value stocks in the short term. Over the last three trading days, the S&P 500 Growth index is underperforming the S&P 500 Value index by over 2.5%. So far this year, this is only the third time that the S&P 500 Growth index has underperformed Value by more than two percentage points over a three trading day period. The last two occurrences were in late April and late July.
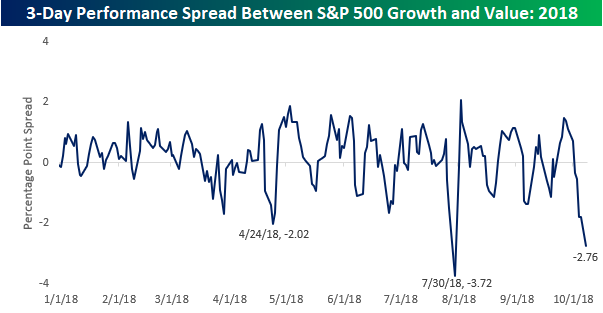
This is the third time this year that growth has underperformed value by over 2% in 3 days.
Start a two-week free trial to Bespoke Premium to see today’s full Morning Lineup report. You’ll receive it in your inbox each morning an hour before the open to get your trading day started.

The Closer — Support, Steepening, Sell Vol, Brazil Beckons — 10/8/18
Log-in here if you’re a member with access to the Closer.
Looking for deeper insight on markets? In tonight’s Closer sent to Bespoke Institutional clients, with economic data nowhere to be seen we focus exclusively on markets with a review of price action (and what it suggests for upcoming returns) in the Stoxx 600, Brazilian real, and VIX futures.

See today’s post-market Closer and everything else Bespoke publishes by starting a 14-day free trial to Bespoke Institutional today!
2.5 Years and $570 Billion Ago
It hasn’t been a good few weeks for Amazon.com (AMZN). After breaching the trillion-dollar market cap level in early September, the stock has been under a fair amount of selling pressure, pulling back about 9% in the span of a month. As a result of this pullback, AMZN recently broke down and closed below its 50-DMA for the first time since late April. While the stock is down 9% from its high, though, it’s still more than 14% above its 200-DMA (1,629).
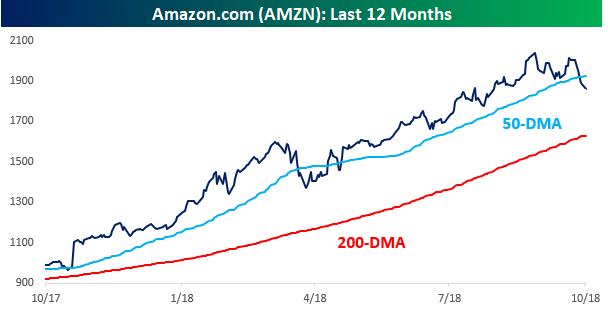
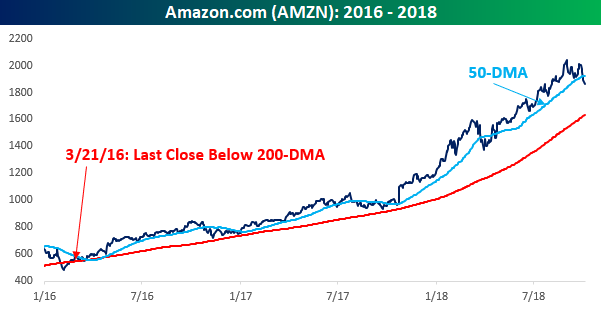
A close below the 200-DMA for AMZN would be something we haven’t seen in quite some time. The last time AMZN closed below its 200-DMA was 643 trading days and $570 billion in market cap ago. That’s right, AMZN hasn’t closed below its 200-DMA in more than two-and-a-half years (March 2016)!
With AMZN still more than 14% above its 200-DMA, its streak of daily closes above the 200-DMA doesn’t appear to be in jeopardy of ending anytime real soon. At 643 trading days and counting, the current streak is already easily the longest in the stock’s history. Since the company’s IPO in the late 1990s, there have only been four prior streaks where AMZN closed above its 200-DMA for more than 300 trading days, and not a single one of those streaks reached the 400 trading day point. In other words, the current streak is more than a year longer than the next closest streak!
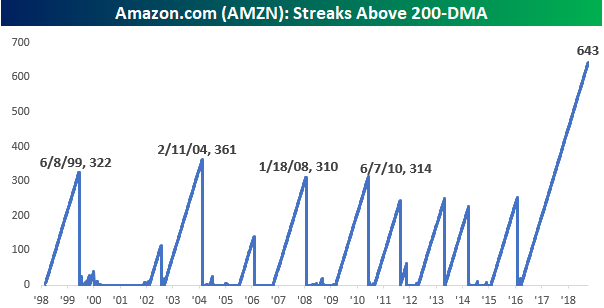
Chart of the Day: Upside Economic Surprises on the Horizon
Trend Analyzer – 10/8/18 – Long Tails
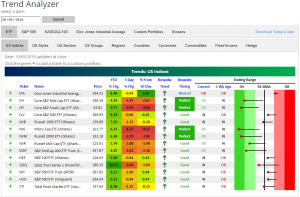
We are starting off this week with the S&P down 1% so far in October. After more downward moves on Friday, every one of the major US Index ETFs has fallen from this time last week. The large-cap Dow (DIA) has been the best performer in this group, and it is now the only one overbought (but just barely). Of the others, there are 7 neutral and 6 oversold. As you can see in the Trading Range section of the Trend Analyzer, each ETF has a long tail indicating large movements over the past week. Small-caps such as the Micro-Cap (IWC), Core S&P Small-Cap (IJR), Russell 2000 (IWM), and Nasdaq (QQQ) are all down over 3%, with IWC down the most at 4.27% since 5 days ago. These ETFs have moved deep into oversold territory with the rest of the group following in their footsteps.
Morning Lineup – Change is in the Air
Up here in the Northeast, Autumn seemed to literally come right before our eyes this weekend as the solid green blanket of foliage still in place Saturday morning gave way to the annual mosaic of yellows, oranges, and reds by Sunday afternoon. It really came quick!
In the market last week, we also saw some big shifts in performance as sectors like Consumer Discretionary, Technology, and Consumer Staples all sold off and dropped below their 50-day moving averages, while sectors like Financials and Energy moved in the other direction. Whether or not this is part of a longer-term cyclical shift remains to be seen, but the picture is no longer as green as it once was.

Start a two-week free trial to Bespoke Premium to see today’s full Morning Lineup report. You’ll receive it in your inbox each morning an hour before the open to get your trading day started.