EM Currencies Eye A Breakout
Declines in emerging market currencies and other financial markets in EM have been a big driver of investor angst so far this year. Since April 18th, our equally-weighted index of EM currency performance versus the US dollar has dropped 11.8%; adjusted for interest rate differentials, it’s a slightly less painful but still large 9%. Despite global equity market weakness this week, EM currencies are starting to break out of their downtrend. While still tentative, a shift in trend to sideways price action instead of persistent declines would be a big deal for global asset markets, especially for equity markets outside the US.
FAANG+ Flush
This week has been a pretty brutal one for growth stocks. One of the best ways to see this is the performance of the NYSE FAANG+ Index, which has flat-out collapsed. The index is slightly broader than the traditional FAANG (Facebook, Amazon, Netflix, and Alphabet, formerly Google) index, and it currently includes Apple (AAPL), Nvidia (NVDA), Twitter (TWTR), Alphabet (GOOGL), Facebook (FB), Amazon (AMZN), Netflix (NFLX), Tesla (TSLA), Baidu (BIDU), and Alibaba (BABA). As shown in the chart below, yesterday’s close brought the group’s decline to more than 18%, its second-worst drawdown since inception back in 2014. The length of the drawdown is also notable at 78 trading days, also the second-longest in the history of the index.
Biggest Earnings Reports to Watch Next Week
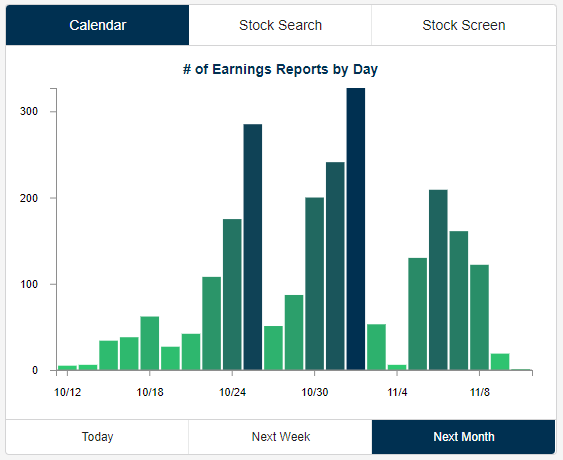
Earnings season began this week, but as shown in the chart below, things don’t really pick up until next week and beyond. Next week, companies with a combined $5.5 trillion in market cap will report Q3 numbers, while $11.2 trillion in market cap will report the following week.
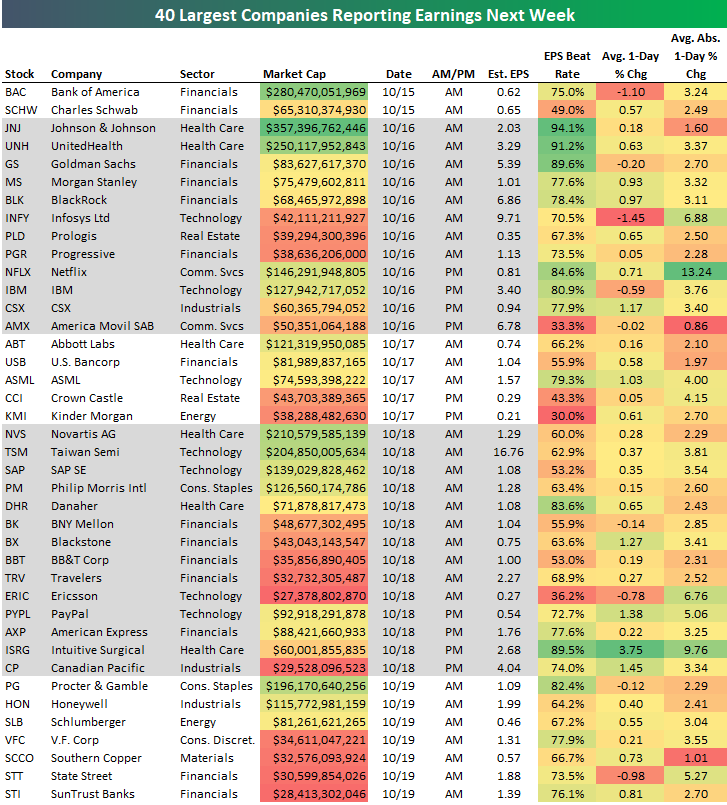
From our Earnings Calendar tool, below is a list of the 40 largest companies set to report their Q3 numbers next week. For each company, we include key info like its historical earnings beat rate, its average one-day price change in reaction to earnings, and its average absolute one-day price change in reaction to earnings. The average absolute number tells you how volatile a stock normally is on its earnings reaction day.
On Monday we’ll hear from two more big Financial sector firms — Bank of America (BAC) and Charles Schwab (SCHW). Johnson & Johnson (JNJ), Goldman (GS), UnitedHealth (UNH), and Morgan Stanley (MS) are set to report on Tuesday morning, while Netflix (NFLX) and IBM will headline Tuesday after the close. Netflix is by far the most volatile of the big companies reporting earnings next week with an average absolute move of +/-13.24% on its earnings reaction days.
Wednesday is relatively slow on the earnings front as Abbott Labs (ABT) is the only $100+ billion company reporting that day. On Thursday we’ll hear from PayPal (PYPL), American Express (AXP), and Intuitive Surgical (ISRG) after the close. Finally, Procter & Gamble (PG), Honeywell (HON), and Schlumberger (SLB) will round out the week with reports on Friday morning.
Of the names listed, JNJ, UNH, GS, ISRG, and NFLX have the highest earnings beat rates, while CSX, BX, PYPL, ISRG, and CP have historically experienced the biggest gains on their earnings reaction days.
Start a two-week free trial to Bespoke Institutional to use our popular Earnings Screener tool.
Morning Lineup – Way Oversold
It’s a much different picture for the equity market this morning than it was yesterday, with futures indicating a sharply higher open. Just to reiterate our point from yesterday, though, we continue to expect violent moves both up and down throughout the trading day. On a positive note, JPMorgan, Citi, and Wells Fargo are all currently trading up on earnings. Hopefully, that initial positive reaction can hold.
After yesterday’s big decline, the S&P 500 closed 3.77 standard deviations below its 50-DMA, which is the most oversold reading for the index since August 2015! As shown in the chart below, occurrences of the S&P 500 trading 3.5 standard deviations or more below its 50-DMA are few and far between in the index’s history. Since 1928, there have only been 18 such occurrences.

Start a two-week free trial to Bespoke Premium to see today’s full Morning Lineup report. You’ll receive it in your inbox each morning an hour before the open to get your trading day started.

The Closer — Distribution Day, Bonds Need Longs, EMFX Rally — 10/11/18
Log-in here if you’re a member with access to the Closer.
Looking for deeper insight on markets? In tonight’s Closer sent to Bespoke Institutional clients, we argue for duration longs in the wake of weaker than forecast CPI and a strong long bond auction. We also take a look at the huge intraday sell program that hit stocks this afternoon and what similar occurrences have meant for stocks going forward. Finally, we note performance in EMFX is sending a much different signal than other markets at present.

See today’s post-market Closer and everything else Bespoke publishes by starting a 14-day free trial to Bespoke Institutional today!
Bespoke’s Sector Snapshot — 10/11/18
We’ve just released our weekly Sector Snapshot report (see a sample here) for Bespoke Premium and Bespoke Institutional members. Please log-in here to view the report if you’re already a member. If you’re not yet a subscriber and would like to see the report, please start a two-week free trial to Bespoke Premium now.
Below is one of the many charts included in this week’s Sector Snapshot, which shows overbought/oversold levels for the S&P 500 and its major sectors. Most sectors are now as oversold as they have been in years.
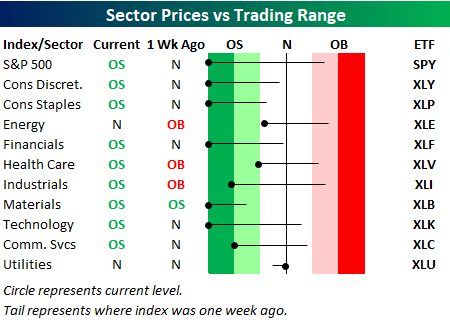
To find out what this means and to see our full Sector Snapshot with additional commentary plus six pages of charts that include analysis of valuations, breadth, technicals, and relative strength, start a two-week free trial to our Bespoke Premium package now. Here’s a breakdown of the products you’ll receive.
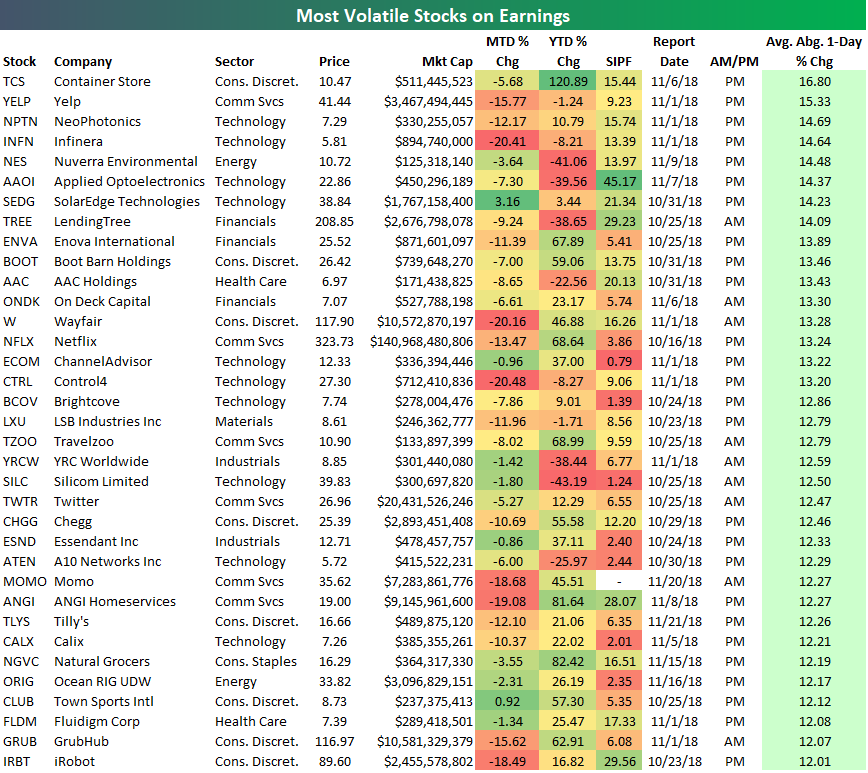
Bespoke’s Most Volatile Stocks on Earnings
In late September we started to notice that stocks that were reporting earnings were falling sharply in reaction to the news. This did not portend well for the upcoming earnings season that begins this week. We viewed the share-price weakness for stocks that reported earnings in September as a sign of things to come.
Given how weak equities have been so far in October, it appears that the market took notice of the earnings weakness in September as well. We’ve seen a sharp sell-off in stocks — particularly growth stocks that are volatile on earnings — ahead of their upcoming report dates, which suggests to us that the market is pricing in earnings weakness. For bulls, the hope now is that the re-pricing of shares to much lower levels ahead of earnings has actually gone a bit overboard.
Below is our regularly updated list of the most volatile stocks on earnings. To make the list, a stock must trade for more than $5/share and have at least 10 quarterly reports in our Earnings Screener database.
The 35 stocks below all average a move of at least +/-12% on their earnings reaction days, so you can expect big volatility when they report in the upcoming weeks and months.
We mentioned above that stocks have been selling off sharply ahead of their earnings reports this season. Well, the 35 stocks in the table below have averaged a decline of 9% so far this month! We’d call that a pretty sharp sell-off, and it shows just how spooked investors are ahead of this earnings season. Again, the only hope for investors now is that the selling has been exhausted, which should lead to gains when the actual earnings news event occurs.
The Container Store (TCS) is the most volatile stock on earnings with an average absolute one-day change of 16.8%. Yelp (YELP) ranks second, followed by NeoPhotonics (NPTN) and Infinera (INFN). Other notables on the list include Wayfair (W), Netflix (NFLX), Travelzoo (TZOO), Twitter (TWTR), GrubHub (GRUB), and iRobot (IRBT).
For each stock, we also include its MTD and YTD change along with its short interest as a percentage of float. Stocks that have gotten crushed and have high short interest levels are the most ripe for a big upside move provided the earnings are decent when they’re released in the coming weeks. Stocks that haven’t fallen very much recently that have low short interest levels are the most ripe for a big sell-off in reaction to earnings should the numbers not impress.
Start a two-week free trial to Bespoke Institutional to use our popular Earnings Screener tool.
B.I.G. Tips – Three International Ideas
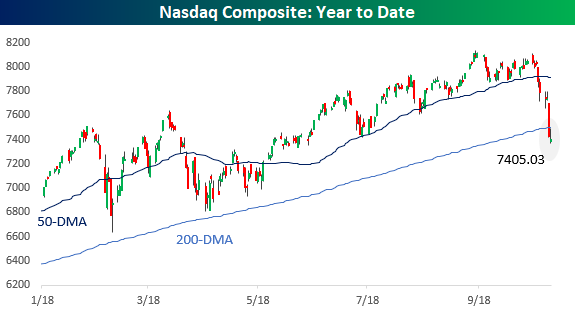
Big Test for Nasdaq
After breaking down below its 200-DMA yesterday, the Nasdaq faces a big test this morning as it tries to bounce back. In early trading, the index got as high as 7,493 – just eight points short of its 200-DMA – before pulling back. We’ve seen a number of historical examples where after selling off and falling below a major moving average, an index tries to quickly bounce back above that level only to be met with another wave of selling. We may have just seen another example of that, but there’s still a lot of time left in the day. Therefore, it will be important to watch and see if the index can quickly bounce back and re-take its 200-DMA. A rally back above 7,500 would be a moral victory for the bulls, while anything below that level will indicate that the sellers still have the upper hand.
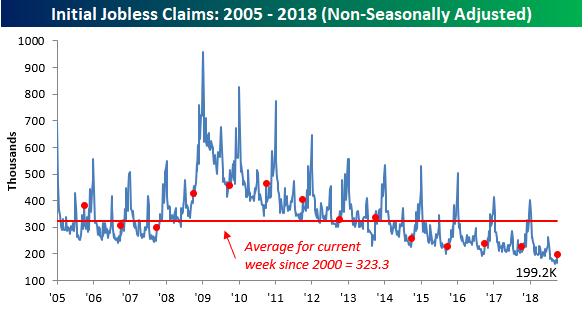
Jobless Claims Tick Higher
Jobless claims came in higher than expected this week but still remain right near their lows of the cycle. While economists were expecting first time claims to come in at a level of 207K, the actual reading came in at 214K. Despite the higher than expected reading, claims have still been at or below 300K for a record 188 straight weeks, at or below 250K for 53 straight weeks, and at or below 225K for 14 straight weeks. By all accounts, claims remain low.
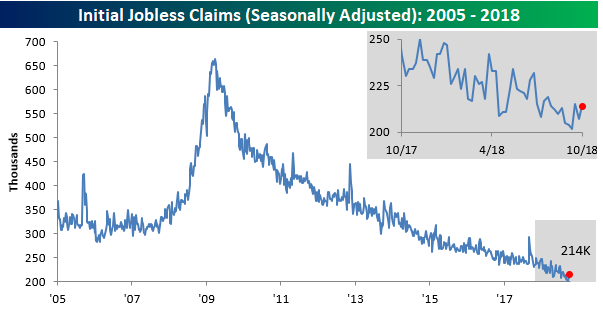
The four-week moving average for claims increased from 207K up to 209.5K. That’s just 3.5K above the cycle low of 206K from mid-September, but based on the recent readings, it doesn’t look as though we will challenge that low anytime soon.

On a non-seasonally adjusted (NSA) basis, jobless claims also ticked higher but managed to stay below 200K. At 199.2K, this week’s reading was the lowest for the current week of the year since 1969 and more than 120K below the average of 323.3K for the current week of the year dating back to 2000. Signs of a pickup in claims still aren’t showing up.