The Closer: Breaking Out Of A Bottom, Capacity Concerns, Workers Wanted — 10/16/18
Log-in here if you’re a member with access to the Closer.
Looking for deeper insight on markets? In tonight’s Closer sent to Bespoke Institutional clients, we discuss what types of stocks have led the rally off the bottom from last Thursday, as well as the technical developments over the last few sessions that make this rally look even more attractive. As far as economic data today, industrial production was solid, and oil production continues to impress despite relatively low capacity utilization in manufacturing. Finally, we dive into the blow-out job openings number reported today by the BLS.

See today’s post-market Closer and everything else Bespoke publishes by starting a 14-day free trial to Bespoke Institutional today!
Industrial Production Beats Estimates
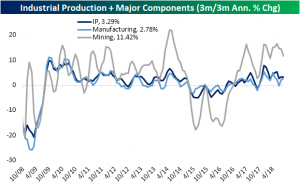
Industrial production growth in September was forecasted to fall to 0.2% from August’s reading of 0.4% MoM. The release for September came in higher than expectations at +0.3%. On a 3m/3m annualized basis, September’s data is still below where it has been for most of the year though. Mining has continued to be a key driver in the aggregate production measure this year. Even with over a 3% decline from the prior period, mining production rose 11.42% on a 3m/3m annualized basis. A big portion of this mining production comes from strength in oil and gas. Manufacturing saw a nice bounce thanks to much stronger automotive production.
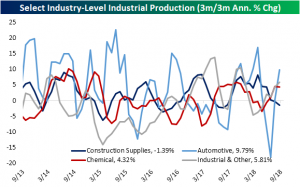
On the industry level, we have seen a substantial recovery of autos. As one of the major components that make up aggregate industrial production, it is a good sign to see this industry picking up steam. Only a couple months ago—back in July—the industry was at a multiyear low of -18.01% annualized on a 3m/3m basis. Since then, it has climbed all the way back to 9.79% through September. This comes on the back of September’s stronger than expected auto sales that was released earlier this month. This could bode well for the automotive industry which has been soft since the end of 2017.
Unfortunately, the strength in autos for this month was not reflected in construction supplies which fell again to -1.3% annualized 3m/3m. This is nothing new for this year as many housing and construction data points have been consistently weak.
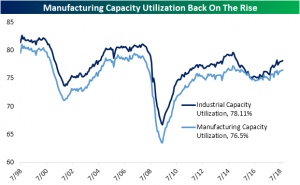
After bottoming out in 2016, both industrial and manufacturing capacity utilization have been on the move upwards. Industrial capacity utilization has yet to take out its high from back in April, but it has seen consistent moves higher over the course of the past few months. Today’s release forecasted capacity utilization to increase to 78.2%. Instead, September’s release came inline with August at 78.1%. Manufacturing utilization, on the other hand, did surpass its high in September. It is now at its highest level since July 2015. On a longer time frame though, capacity still has not reached pre-recession levels.
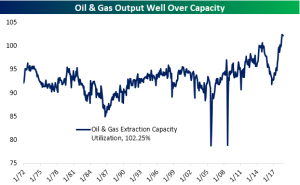
Despite a very small downtick for September—moving to 102.25% from 102.28%—oil and gas are still producing at levels over capacity. As international trade tensions surrounding these products mount, it should not come as any surprise that US producers are working overtime to make up the difference.
Bespoke Stock Scores — 10/16/18
Chart of the Day: Small Cap Mean Reversion
Homebuilder Sentiment Unexpectedly Jumps
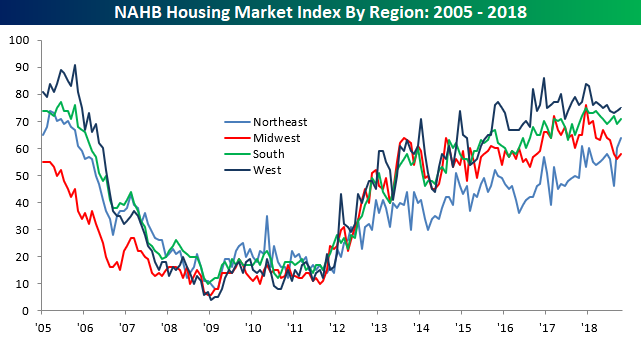
Lately, it seems that there hasn’t been a whole lot of positive data coming out of the residential housing sector, but this morning we actually received some good news for a change. According to the National Association of Homebuilders (NAHB), homebuilder sentiment for the month of October unexpectedly increased from 67 up to 68 versus estimates for a decline to 66. In spite of this month’s increase, the index is still off of its high of 74 that was hit right at the end of 2017 when the GOP tax plan was passed.

Breaking out this month’s report by sales, traffic, and regions shows gains across the board. As shown in the table below, Traffic saw a big surge rising from 49 back into positive territory at 53. From a regional perspective, sentiment improved in all four regions of the country, but for the second straight month, homebuilders in the Northeast saw the biggest boost to sentiment and it is the only region of the country where sentiment is at a high for the cycle. Finally, some good news out of the housing sector!

Morning Lineup – Another Rally Attempt
US equity futures are attempting to rally again this morning after yesterday’s last hour decline of nearly 1% erased all the positive goodwill from the rebound earlier in the day. The pace of earnings reports is finally starting to pick up, and based on this morning’s results, at least, the news has been good. Of the 12 companies that have reported, 11 have exceeded EPS forecasts and just three missed revenue estimates. The big question now is, can stocks finally rally on what at the surface look like good results?
Looking ahead at market seasonal trends, the gauges below are from our Stock Seasonality tool and show the S&P 500’s median historical return over the upcoming week, month, and quarter during the last ten years. In that span, the upcoming week and month have seen median gains of 0.48% and 1.18%, respectively. Relative to all other one week and one month periods over the last ten years, these returns are pretty much in line with the norm. Looking out over the next three months, though, it doesn’t get much better than the S&P 500’s median gain of 6.11% which ranks right up there with the best three month periods of the calendar over the last decade.

Start a two-week free trial to Bespoke Premium to see today’s full Morning Lineup report. You’ll receive it in your inbox each morning an hour before the open to get your trading day started.

Trend Analyzer – 10/16/18 – Holding Pattern
Today there is more of the same that we have seen this past week in our Trend Analyzer Tool. Every major US Index ETF with the exception of the Dow (DIA) remains extremely oversold after most markets again finished Monday slightly lower. The recent volatility has now erased YTD gains for three of the members of this group. The Russell Mid-Cap (IWR) ETF is currently down the most YTD at 1.06%. Core S&P Mid-Cap (IJH) is down 0.53% YTD, while the S&P MidCap 400 (MDY) which is down a quarter of a percent. Also important to note is that the Micro-Cap ETF (IWC) and the Russell 2000 (IWM) are both now trending sideways after breaking their uptrends on this downturn.

The Closer: Relative Trends, Deficit Spend, Canada Quarterly Improvement — 10/15/18
Log-in here if you’re a member with access to the Closer.
Looking for deeper insight on markets? In tonight’s Closer sent to Bespoke Institutional clients, we take a look at relative performance for two sectors versus the broad market as well as the ongoing break above resistance for our EMFX index. We also review the monthly budget numbers from the US Census, where the deficit was much smaller than typical thanks to a huge decline in outlays. Finally, we break down quarterly numbers from the BoC on the business outlook and availability of credit in Canada.
See today’s post-market Closer and everything else Bespoke publishes by starting a 14-day free trial to Bespoke Institutional today!
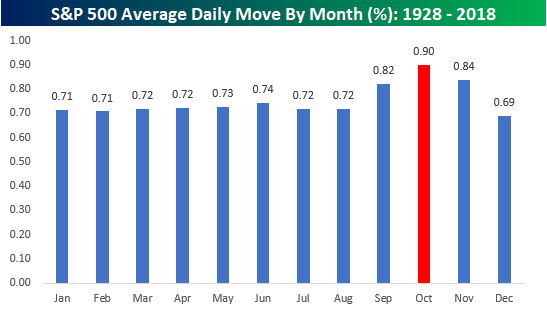
A Calmer Than Normal October
October has historically been the most volatile month of the year for equity markets, so the fact that volatility has picked up so far this month is to be expected. What may come as a surprise to many, though, is that so far at least, this October has been less volatile than average. The chart below shows the S&P 500’s average daily move by month going back to 1928, where October’s average daily move of +/-0.90% is clearly the largest of any month. With this October nearly half over, though, the average daily move so far has actually been just +/-0.77%. If the market is even going to see ‘average’ volatility this month, things are going to have to get a lot more active!