Bank of the Ozarks (OZK) Leads Regional Banks Down
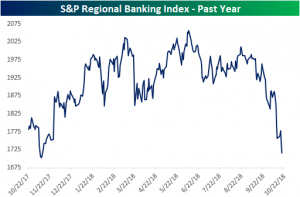
The S&P Regional Banks have gotten battered once again today, down 3.01%. But that is purely a continuation of what has been a rough Fall. The index has fallen 16.58% from its high back in early June and has fallen 7.05% since the start of October. The stocks in the index are down an average of 8.31% MTD. As shown below, the chart for regional banks has completely rolled over.
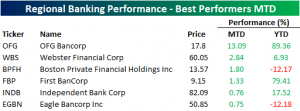
Of all 126 regional banks included in the index, only 6 have managed to see any gains MTD. Two of these, Independent Bank Corp (INDB) and Eagle Bancorp (EGBN), have not even edged out a full percentage point gain. OFG Bancorp (OFG) is an anomaly managing to rise 13.09% on the month (and 89% on the year). But again, these are outliers and not the norm for the industry.
On the other end of the spectrum, the worst performers for October are a much scarier picture. As shown below, some of the worst performers of the index so far this month are down double digits for both this month and this year. Leading the charge downward is one of the country’s most aggressive lenders, Bank OZK (OZK) — formerly known as Bank of the Ozarks. This bank was mentioned Sunday morning in our Brunch Reads in an article out of Bloomberg from Friday. The article highlighted investors moving away from the stock following a horrific earnings report. Earnings dropped 23% versus estimates of a rise of 20%. The reason behind this poor earnings report is the changing interest rate environment. Just three months ago things looked much different.
The names behind OZK are not much better. Opus Bank (OPB) is down just over 25% YTD, and 23.51% MTD. Third worst in the industry is Texas Capital Bancshares which has fallen 20.7% MTD and 27.66% YTD.
We’ll be watching the performance of regional banks closely from here given their extreme weakness recently. The rise in mortgage rates and weakening housing indicators put them at significant risk if things start to get worse.
No Cause for Concern for ECB Rates
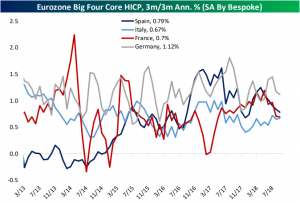
While global conditions have been less than optimal, inflation in the Eurozone should not be a point of concern at the moment, especially in its impact on the regions monetary policy. The four countries in the chart below account for about 80% of the Eurozone, and only one of which (Germany) has a 3m/3m annualized harmonized index of consumer pries (HICP) growth over 1%.
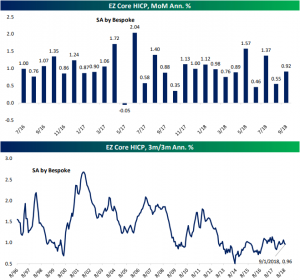
These low inflation rates should ease any worries over near-term rate hikes. The ECB targets an inflation rate of “below but close to” 2%. This means that while the bank may slowly tighten its policy over the next year or two given the state of other aspects of the economy, there will be no rush to do so on account of inflation. For the Eurozone as a whole, the picture is similar to the big four. As shown in the chart below, the broader MoM core HICP has not risen over 1% annualized for 6 of the last 8 months.
2018 Dogs of the Dow
Below is a check-up on the performance of the “Dogs of the Dow” strategy so far in 2018. For those unfamiliar with the strategy, it’s a simple portfolio allocation and re-balance at the start of each year into the 10 highest yielding stocks in the Dow Jones Industrial Average.
As shown in the table, the 2018 Dogs are currently up an average of 4.77% YTD on a total return basis compared to a total return of 5.11% for the 20 non-Dogs. Coming into the month, the non-Dogs were outperforming the Dogs by a much wider margin, however. With investors shifting out of cyclicals and into more defensive names, the lower-yielding non-Dogs have fallen 4.61% in October, while the Dogs are down just 0.61%. If it weren’t for IBM’s 13.91% drop this month due to another bad earnings report, the Dogs would actually be up 87 basis points MTD.
Merck (MRK) and Pfizer (PFE) have been the best performing Dogs of the Dow this year with total returns of more than 25%. Apple (AAPL) and Microsoft (MSFT) have been the best performing non-Dogs with gains of more than 30%.
If we were to re-balance the strategy now, Merck (MRK) would be removed and JP Morgan (JPM) would enter the Dogs. Note that IBM is now the highest yielding stock in the Dow at 4.82%!
B.I.G. Tips – Death by Amazon – 10/22/18
Chart of the Day: Homebuilders Keep Falling, Now Down 38% From Highs
Watches and Casinos Point to Global Slowing
The US economy has maintained its robust growth this year but the broader global economy cannot boast the same health. Among many others, indicators like Japanese exports, Swiss exports, and German industrial orders are all either in retreat or decelerating at a significant pace.
On top of these more mainstream releases, there are some more obscure indicators that we like to track as well. These data points have a history of accurately reflecting the cyclical behavior of the global economy. For starters, commodity prices through the Bloomberg Commodity Spot index is up 4.5% YoY (3m average). This is one of its slowest paces since 2016 when energy bottomed. An additional indicator comes out of a casino-heavy resort town in China named Macau. Macau gaming revenue growth has also slowed to its slowest pace since late 2016. This indicates tighter spending by Chinese consumers at the high end of the spectrum. Another indicator is the value of Swiss watch exports. The YoY growth rates for these luxury items are closely linked to the global economic cycle. Swiss watch exports have fallen by 7.7% since peaking in June. One final variable is world trade value in USD. This data point is released at a pretty significant lag, but still shows much of the same story. Fortunately, the global economy is still experiencing growth, but the pace has become increasingly subdued.
Down 15%+ in 15 Days
October is still only a little more than 15 trading days old, but there are already 31 stocks in the S&P 500 that are down over 15% on the month. The table below lists each of those 31 names, and while it’s not uncommon to see volatile stocks from the Technology or Consumer Discretionary sectors topping the list of worst performers during a market decline, not a single one of the ten worst performers so far this month comes from either sector. As shown in the table, the sectors represented in the list of ten worst performers are Industrials, Health Care, and Materials, and the stocks are all down well over 20% already this month!
The worst performing Technology stock on the list is Advanced Micro (AMD), which is down just under 20%, while Newell (NWL) is the worst performing stock from the Consumer Discretionary sector with a decline of 16.4%. Looking at this overall list of names, it’s cyclical stocks which dominate with eight stocks from the Industrials sector alone. Meanwhile, no stocks from the Consumer Staples, Financials, Real Estate, or Utilities sectors made the list. So much weakness in a number of large-cap cyclical stocks has been a big reason why the ratio of cyclicals to defensives has pulled back so far over the last month.
This Week’s Economic Indicators – 10/22/18
Economic data released last week was pretty mixed. Major industrial releases including Empire and Philly Manufacturing as well as Industrial Production all came in better than expected. Housing, on the other hand, continued to leave a lot to be desired. Starts/permits and existing home sales missed, but fortunately, the NAHB sentiment index came in much more positive. Employment data from JOLTS and jobless claims all reaffirmed a very tight labor market.
Turning to this week, economic data will be back-end loaded. Things will start off quiet with only Chicago National Activity and Richmond Fed Manufacturing Indices released today and Tuesday. Things begin to pick up on Wednesday when Mortgage Applications and the FHFA House Price Index will both be released. More housing data will be released later in the day Wednesday with new home sales, which is forecast to see a huge decline. Markit PMIs will also come out Wednesday morning. The Fed Beige Book will round out the day Wednesday afternoon.
Thursday will be the busiest day this week with trade balance data, wholesale and retail inventories, durable goods, and jobless claims all coming out at 8:30 AM. As new home sales are expected to see a major decline the day before, existing home sales are estimated to come in unchanged from last month. Finally, the fourth input of our Five Fed Manufacturing Composite Index comes in with the Kansas City Fed’s Manufacturing Index; the last index (Dallas Fed) will come out the following week.
Preliminary GDP data will finish off the week on Friday. GDP and Personal Consumption are forecasted to fall alongside the GDP Price Index and Core PCE.
Trend Analyzer – 10/22/18 – Changing Trends
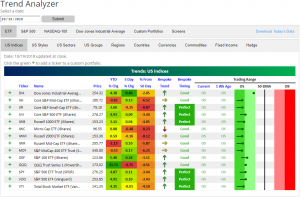
Our Trend Analyzer continues to show weakness for equities after another volatile week last week. Every one of the major US Index ETFs remain oversold. While this is mostly the same as the start of last week, these ETFs are not as extremely oversold as they were. Even though this is a good sign, the Mid-Cap ETFs—IJH, IWR, and MDY—are still sitting lower YTD.
It’s important to note that on a 6-month time frame, five of the members of this group have recently broken their uptrends. Four are trending sideways and the Micro-Cap (IWC) is now in a downtrend. As it currently stands IWC is still positive for the year, but if this downtrend continues, it may not be long before it more closely resembles one of the mid-caps. This simply reflects the greater trend that we have seen over the past month of rotation out of smaller sized companies.
Morning Lineup – Chinese Stocks Surge
China’s biggest stock rally in more than two years has US stocks looking to open higher, and the real strength is in the Nasdaq, where futures are indicating a gain of 0.7%. Economic data is relatively light today, and while there hasn’t been much in the way of earnings reports yet today, the pace will really pick up in the days ahead.
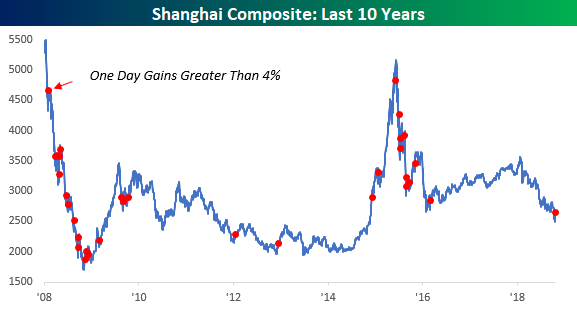
The big gain for Chinese equities overnight is definitely a welcome bullish move from an area of the world that currently keeps investors up at night, but looking back over the last ten years, we would note that 4% moves in Chinese equities haven’t typically come during periods of market strength. The red dots in the chart below show all occurrences of one-day moves of 4% or more for the Shanghai Composite since the start of 2008. While there were exceptions, most of the 32 prior instances came during the downward moves in 2008 and then in 2015.
Start a two-week free trial to Bespoke Premium to see today’s full Morning Lineup report. You’ll receive it in your inbox each morning an hour before the open to get your trading day started.
