B.I.G. Tips – A Look Around the Globe
Strong Cyclicals Breadth Bodes Well
In our nightly global macro note The Closer last night, we noted strong breadth among the 27 GICS Level 3 Industries that we classify as cyclical. As-of yesterday’s close, all 27 were up on the year, with performances ranging from +30% gains for Construction Materials, Consumer Finance, and Building Products to weaker sub-2% gains from Distributors and Diversified Financial Services. Below, we show price returns by industry. Start a two-week free trial to Bespoke Institutional to access The Closer and the rest of Bespoke’s suite of Institutional products.
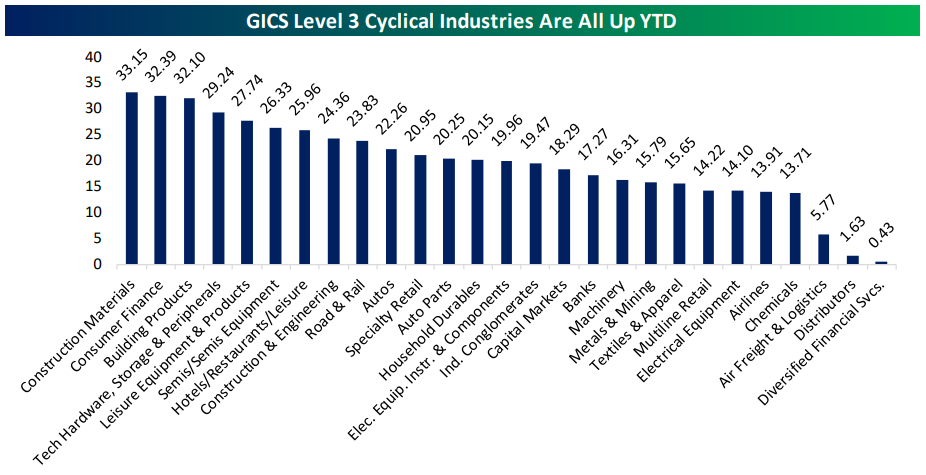
The strong cyclicals breadth bodes well for returns the rest of the year. Since 2004 (full data for all 27 industries starts in that year) there has never been stronger breadth at this part of the calendar. Generally speaking, strong cyclicals breadth is a positive sign for returns the rest of the year. There have been 8 previous years where at least two-thirds of cyclical industries were up through July 22nd. The market as a whole was up through the end of the year in seven of those eight instances, suggesting smooth sailing through the end of 2019.
How Are Stock Prices Reacting to Earnings?
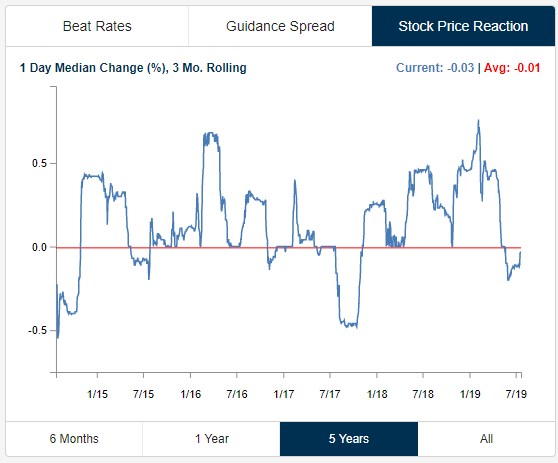
In our view, how a stock reacts to its earnings report is the ultimate arbiter of how good or bad the report actually was. To get a read on the overall market, we keep track of the median one-day price change for all stocks that have reported earnings on a rolling three-month basis. Over the last three months, the median one-day price reaction to earnings has been nearly flat at -0.03%, so we’d say earnings have been “market neutral” over the last quarter.
Below is a chart showing the rolling 3-month trend for earnings reactions over the last five years. As you can see, the trend swings from positive to negative and back to positive quite a bit, so we’d categorize this as a mean reverting indicator. Earlier this year in Q1 when the market was bouncing back from a horrific Q4 2018, stocks were trading extremely positive in reaction to earnings. In fact, we saw the highest reading over the last five years towards the end of Q1 when stocks were experiencing a median one-day price change of roughly 0.75% in reaction to their earnings reports. Since that peak, however, we’ve seen price reactions to earnings drift lower. At the end of June, the reading had dipped negative, meaning companies were experiencing declines more often than gains in reaction to earnings, but over the last few weeks, we’ve started to see price reactions improve.
Now that we’re entering the thick of the Q2 reporting period, a continued move higher for stocks reporting earnings would go a long way in causing an overall market breakokut. Stay on top of the most recent earnings trends by starting a two-week free trial to Bespoke Institutional.
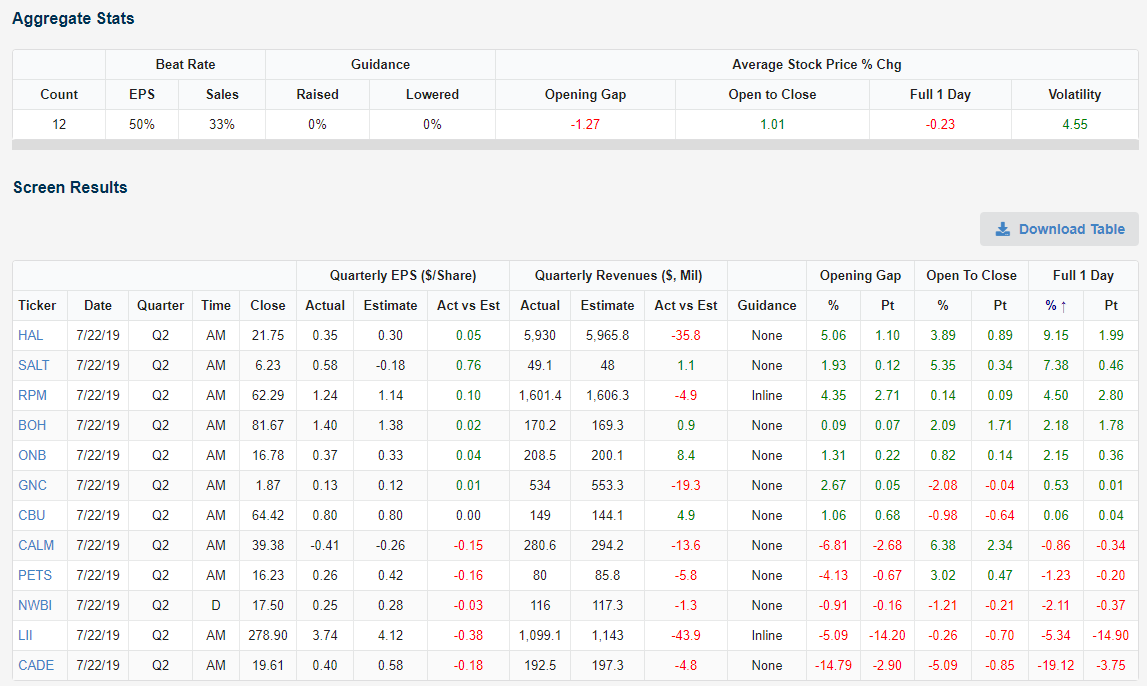
Beats and Misses — HAL, SALT, RPM, CADE
Below is a quick rundown of earnings results from Monday, July 22nd. Of the twelve companies that reported their Q2 numbers, 50% beat EPS estimates, one reported inline, and five missed. Just 33% of companies beat sales estimates. On the day, the average stock that reported traded lower by 0.23%. Halliburton (HAL) was the day’s biggest earnings winner with a gain of 9.15%. Scorpio Bulkers (SALT) gained the second most at +7.38%, followed by RPM International (RPM) at +4.5%. Cadence Bancorp (CADE) was by far the biggest earnings disappointment yesterday with a one-day drop of 19.12%. Stay on top of the most recent earnings trends by starting a two-week free trial to Bespoke Institutional.
Morning Lineup – Revenues Revving
Yesterday morning, we noted that the earnings results weren’t kicking off the week on a positive note. Thankfully, that trend changed since the close yesterday. Not only have results in Europe, and more importantly the reactions to those earnings, been encouraging, but here in the US the tone has been positive as well. Of the nearly 60 companies that have reported since the close yesterday, over two-thirds (67%) have managed to exceed EPS forecasts and an impressive 62% have topped revenue estimates.
In economic data today, the focus will be on housing with the FHFA House Price Index at 9 am eastern and then Existing Home Sales at 10 am. Already this morning, though, earnings from Pulte (PHM) were positive and the stock is trading up 1.5% on the results. Also at 10, we’ll get the July release of the Richmond Fed and see if that will show the same type of rebound that we saw in the Empire and Philly Fed Manufacturing reports.
Read today’s Morning Lineup to get caught up on news and stock-specific events ahead of the trading day including a discussion of earnings results from the US and Europe overnight and economic data out of Japan.
Bespoke Morning Lineup – 7/23/19

As noted in this morning’s commentary of the Morning Lineup, the dollar is trading higher for the third straight day today and appears to be showing signs of breaking out of its May-July downtrend. With the dollar’s strength, we would expect to see companies with international exposure underperforming. As shown in the chart below, though, that hasn’t been the case in the last few days. While our index of S&P 500 Domestics (red line) is about 1% off its recent high, the Internationals Index (blue line) has been moving sideways and remains right near its highs.

Start a two-week free trial to Bespoke Premium to see today’s full Morning Lineup report. You’ll receive it in your inbox each morning an hour before the open to get your trading day started.
The Closer – Cyclical Breadth, Chicago Fed, FX Activity, Ag Alert – 7/22/19
Log-in here if you’re a member with access to the Closer.
Looking for deeper insight on markets? In tonight’s Closer sent to Bespoke Institutional clients, we begin with a look at the very strong breadth of the cyclical GIC Level 3 Industry Groups so far in 2019. Then turning to economic data, we cover the Chicago Fed’s National Activity Index which is consistent with slower growth. Next, we show some developments in the foreign exchange markets including EURJPY sitting at support, the plunge of GBP since May, and the coiling of USDMXN. One final note covers the very slow pace of corn exports this year.

See today’s post-market Closer and everything else Bespoke publishes by starting a 14-day free trial to Bespoke Institutional today!
Netflix: Red is the New Black
Last Thursday was a really bad day for Netflix (NFLX) when the stock fell more than 10% after reporting weaker than expected subscriber growth in Q2. The stock hasn’t really been able to re-gain its footing since then either as it also traded lower on both Friday and Monday. While it’s no surprise that NFLX has been weak since its earnings report, the stock was also weak heading into the report with a losing streak of five trading days. In total, NFLX has traded lower on each of the last eight trading days. Over this time period, the stock has seen an intraday peak to trough decline of over 20%, which is significant even for a volatile stock like NFLX.
As far as eight-day losing streaks are concerned, they don’t come often for NFLX. Since the company’s IPO in 2002, there have only been five other losing streaks of eight or more days, and the most recent was more than five years ago in March 2014, and that was also the longest losing streak in the stock’s history at 11 days. Besides that period, there has only been one other streak that lasted more than eight trading days, so if Netflix finishes in the red today and tomorrow, it will truly be one of the stranger things that have happened in the stock’s history.

In the table below, we have listed each of the prior eight-day losing streaks for NFLX in its history. For each period, we have listed the eighth day of the losing streak and then how the stock performed over the following one week, one month, and three months. The only time that NFLX saw a negative one week return was following the streak that lasted eleven trading days, and the overall average one week return was a gain of 11.9% (median: 8.2%). One month later, the stock saw an average gain of 16.4% (median: 26.9%) with gains three out of five times. Finally, three months after the eighth day of the losing streak, NFLX was higher all five times for an average gigantic gain of 63.2% (median: 46.6%). One note of caution here, however, is that with a market cap of $135 billion, Netflix is not the same company or stock it was fifteen, ten, or even five years ago. While it is still volatile now, it is nowhere near as volatile as it once was, so don’t expect anything in the vicinity of a 63% (or even a 46%) move in NFLX over the next three months. NFLX shareholders would willingly take a quarter of that at this point. Earnings season is about to get really busy, so stay on top of the latest trends and moves by starting a two-week free trial to Bespoke Institutional to access our interactive Earnings Explorer and receive ALL of our premium equity research.
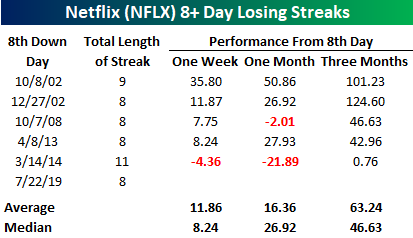
Chart of the Day: Unlucky Seven for Chicago Fed NAI Index
Biggest Winners and Losers of Earnings Season So Far
The two charts below are available to our subscribers on our Earnings Explorer page. They show the rolling 3-month earnings and sales beat rates for US stocks reporting earnings. Monitoring these charts is a good way to track how companies are doing relative to expectations over time. As shown, the earnings beat rate has bounced a bit over the last month after trending lower over the prior 10 months dating back to the middle of 2018. The sales beat rate hasn’t bounced as much, but it has stabilized around its long-term average of 56.45%. Start a two-week free trial to Bespoke Institutional to access our interactive Earnings Explorer and receive ALL of our premium equity research.
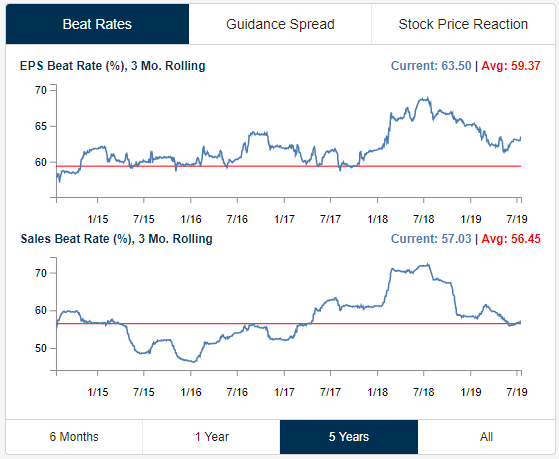
Last week, 123 companies reported their Q2 earnings results, and 70% of them reported stronger than expected EPS. But while the bottom-line beat rate was strong at 70%, the top-line sales beat rate was much weaker at 56%.
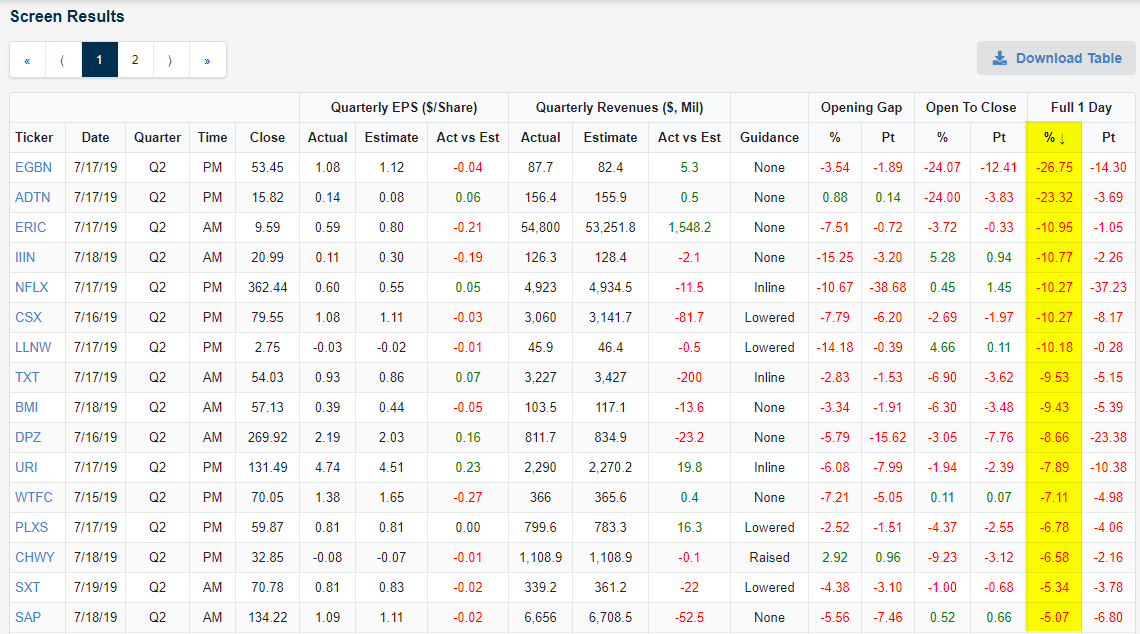
The average stock that reported last week traded well in reaction to the news, gaining an average of 0.56% on its earnings reaction day. There were 20 stocks that gained more than 5%, and we have provided a snapshot of them from our website below. Seattle Genetics (SGEN) was the biggest earnings winner last week with a gain of 19.11% last Wednesday. CrowdStrike (CRWD) was the second biggest winner with a gain of 14.8% last Friday. Skechers (SKX), Gentex (GNTX), and Marten Transport (MRTN) round out the top five with one-day moves of more than 9.2%. Other notables on the list of last week’s biggest earnings winners include Cintas (CTAS), Philip Morris International (PM), State Street (STT), and Union Pacific (UNP).
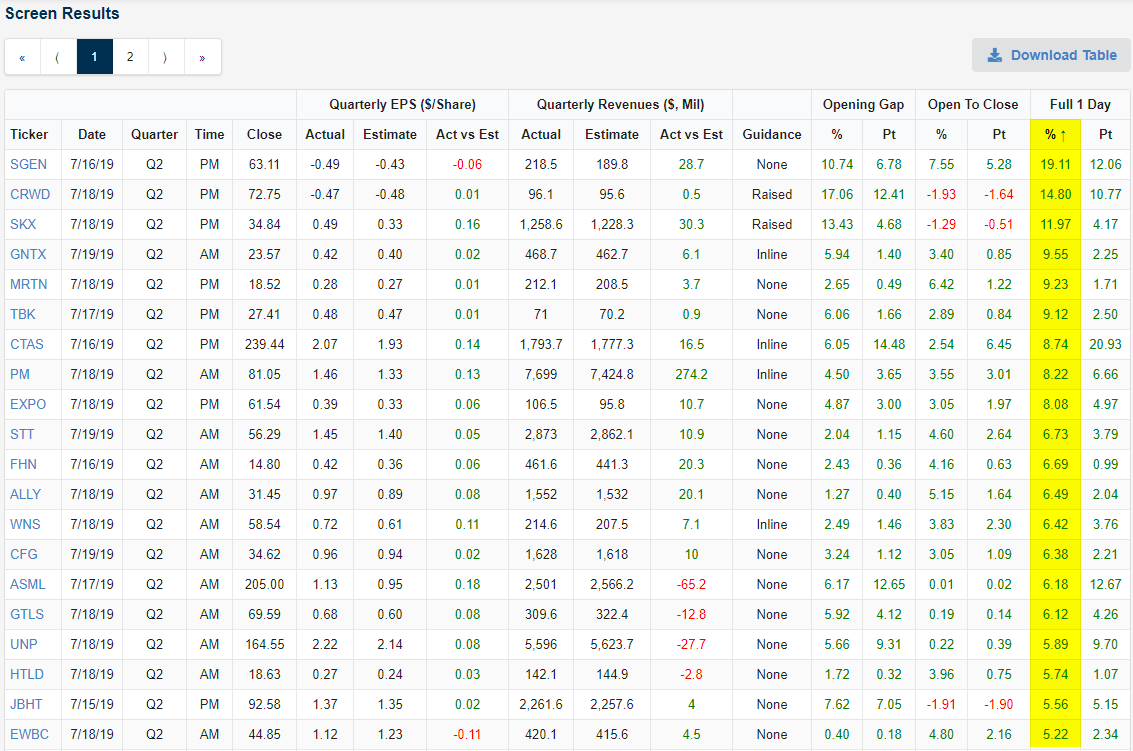
Eagle Bancorp (EGBN) was last week’s biggest earnings loser with a one-day decline of 26.75% on Thursday. ADTRAN (ADTN) was second worst with a decline of 23.32%, followed by Ericsson (ERIC) and Insteel Industries (IIIN). Netflix (NFLX) was the 5th biggest loser on earnings last week with its one-day drop of 10.27%. CSX and Limelight Networks (LLNW) were the other two stocks that fell more than 10%. (Subscribers can use our Earnings Explorer to see the list of biggest earnings winners and losers over any time frame.)
Key Earnings Reports This Week — AMZN, GOOG, FB — 7/22-7/26
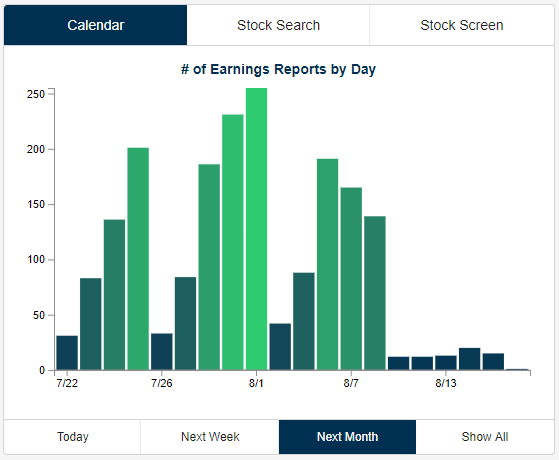
As shown in the chart below of the number of companies reporting earnings by day over the next month, the next three weeks will be the busiest of the Q2 reporting period. (This chart is updated daily at our Earnings Explorer page. Our Earnings Explorer shows upcoming report dates and key earnings stats for all US companies set to report over the next 30 days. To access the Earnings Explorer, start a two-week free trial to Bespoke Institutional.
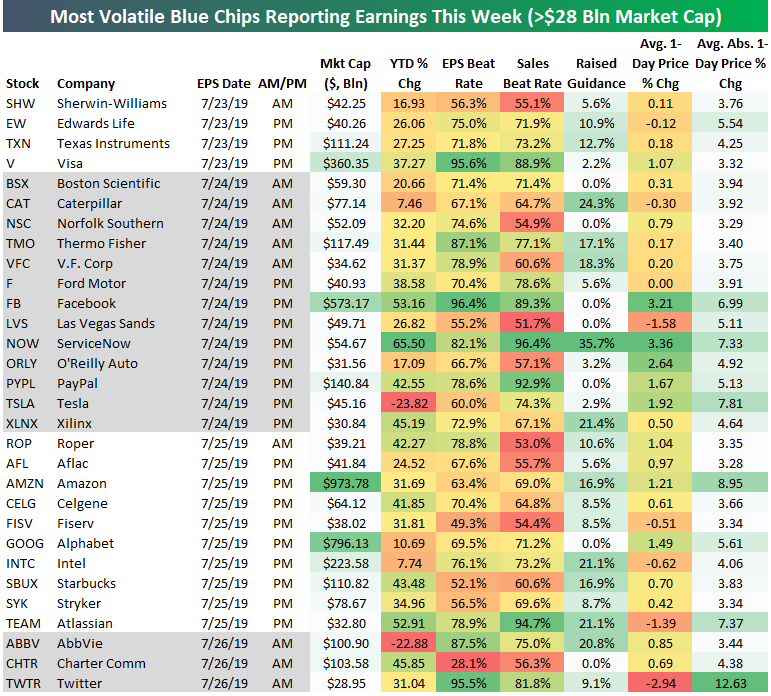
Below we’ve compiled a list of the most volatile large-cap companies (>$28 billion market cap) set to report earnings this week. Each of the stocks listed has historically experienced an average one-day price change of more than +/-3.25% on its past earnings reaction days. For each stock, we include its expected report date, market cap, and year-to-date performance (%). We also include its historical earnings and revenue beat rate (% of time it has beaten consensus analyst estimates) as well as the percentage of the time it has raised guidance. Finally, we show its average one-day share price reaction to earnings reports throughout history and its average absolute one-day price change (earnings volatility).
There are no big reports scheduled for today, but tomorrow we’ll hear from Texas Instruments (TXN) and Visa (V) after the close. Visa (V) has one of the strongest EPS beat rates at 95.6%. Visa has historically averaged a one-day gain of 1.07% on its earnings reaction day (which would be Wednesday this week given that it reports Tuesday after the close).
Wednesday and Thursday will be extremely busy, led by Facebook (FB) and Tesla (TSLA) on Wednesday after the close and Amazon (AMZN), Alphabet (GOOG), and Intel (INTC) on Thursday after the close. Twitter (TWTR) reports Friday morning ahead of the open.
Along with Visa, both Facebook (FB) and Twitter (TWTR) have historically beaten EPS estimates more than 95% of the time. Atlassian (TEAM), PayPal (PYPL), and ServiceNow (NOW) are the three stocks on the list with the strongest revenue beat rates. ServiceNow (NOW) has also raised guidance more often than any of the stocks listed.
In terms of share price reactions, Facebook (FB) and ServiceNow (NOW) stand out as they have historically averaged a one-day gain of more than 3% following earnings. On the downside, Twitter (TWTR) has historically averaged a decline of 2.94% on its earnings reaction days. TWTR is also the most volatile of the stocks listed with an average absolute one-day change of more than 12%.
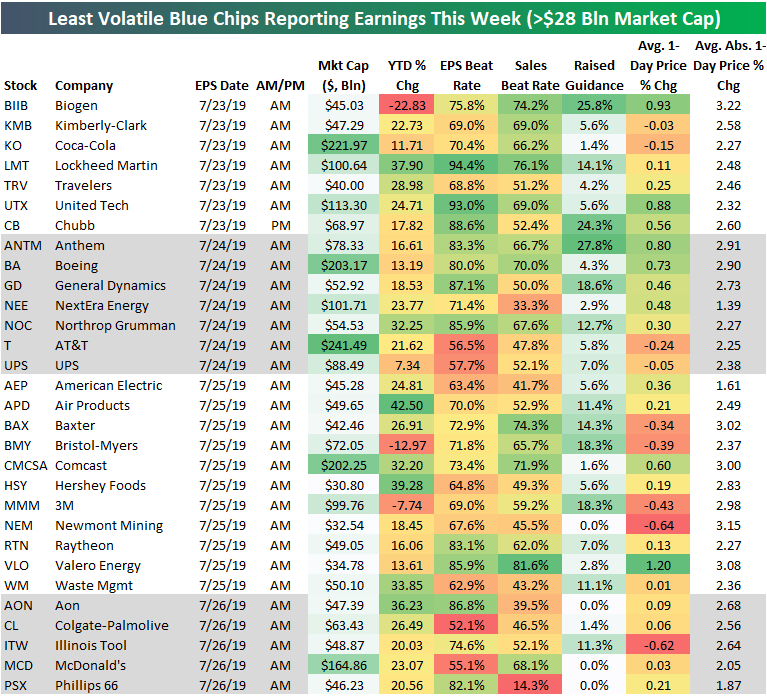
The stocks above are the most volatile of the large caps reporting earnings this week. Below is a list of the large caps that are the least volatile on their earnings reaction days. This list is littered with Dow 30 stocks including Coca-Cola (KO), Travelers (TRV), United Tech (UTX), Boeing (BA), 3M (MMM), and McDonald’s (MCD).
Tomorrow morning we’ll hear from Biogen (BIIB), Coca-Cola (KO), Lockheed Martin (LMT), Travelers (TRV), and United Tech (UTX). On Wednesday we’ll get reports from Boeing (BA), Northrop Grumman (NOC), AT&T (T), and UPS all ahead of the open. Hershey (HSY), 3M (MMM), and Raytheon (RTN) are a few of the big names reporting on Thursday, and then McDonald’s (MCD) will be the biggest of the least volatile blue-chips reporting on Friday morning. Start a two-week free trial to Bespoke Institutional to access our interactive Earnings Explorer and receive ALL of our premium equity research.