B.I.G. Tips – Netflix 10% Downside Gaps
Claims Back Up But Still Low
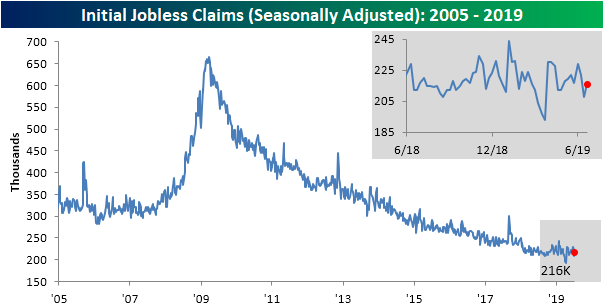
Last week, the Department of Labor’s weekly Initial Jobless Claims came in at 209k, which was the lowest level since April’s multi-decade low print of 193K. This week, that 209K was revised even lower to 208K while this week’s data met expectations by rising to 216K. This leaves claims still at the lower end of the past year’s range. Seasonally adjusted claims have been at or below 300K for 228 weeks and at or below 250K for 93 weeks.
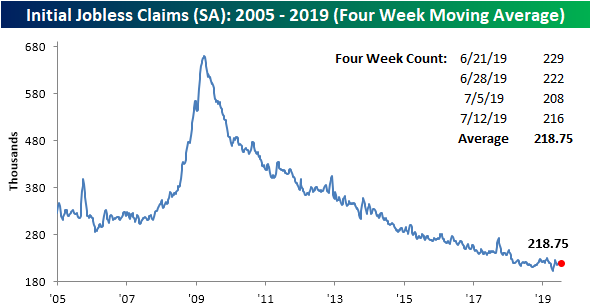
The four-week moving average for seasonally adjusted claims saw only a slight change falling from 219K down to 218.75K. This is as mid-June’s print of 217K rolled off the average to be replaced by this week’s 216K. This was the smallest absolute change in the moving average of 2019 and the smallest move since a 0.25K increase in October of last year.
On a non-seasonally adjusted basis, as could be expected due to seasonal factors, claims rose to 243.5K from 232K last week. A week over week increase is common for this time of the year. As shown from the red dots in the chart below, this week of the year has frequently marked a short term peak for non-seasonally adjusted claims throughout the current cycle. Granted, more recently in 2017 and 2018, that peak was actually the previous week of the year. Given this, this week’s NSA data saw a year-over-year increase but the 243.5K was still below the 2018 seasonal peak of 264.9K. In other words, the YoY increase can be taken with a grain of salt. Start a two-week free trial to Bespoke Institutional to access our interactive economic indicators monitor and much more.
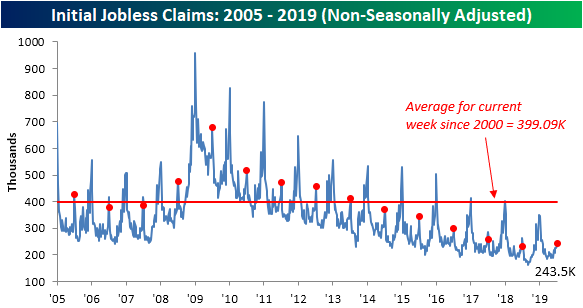
Chart of the Day: Railroad Earnings Send Mixed Signals
Philly Fed Special
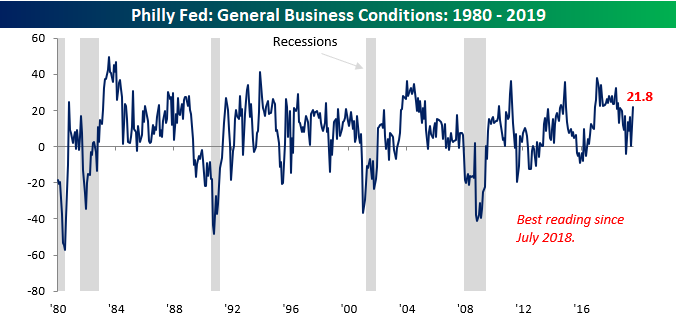
After just barely holding onto positive territory in June, sentiment in the manufacturing sector came booming back in the month of July. In Thursday’s release of the July Philadelphia Fed Manufacturing report, overall sentiment surged from 0.3 up to 21.8. That’s the highest reading for the index since July 2018, but more importantly, it was also the largest m/m gain for the index since June 2009. For some perspective, the last two times the headline index for the Philly Fed report showed a m/m increase of 20 points or more were in January 2012 (two months after the end of a recession) and in June 2009 (the month that recession ended). Surges like July’s don’t normally occur when the economy is on the cusp of a recession.
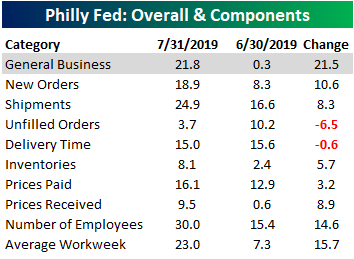
Breadth among the various components of this month’s report was also solid. Of the report’s nine subcomponents, only two declined in July’s report, and three saw double-digit increases. Two components that were especially strong were Average Workweek and Number of Employees. In the Philadelphia region, at least, employment appears to be very strong.
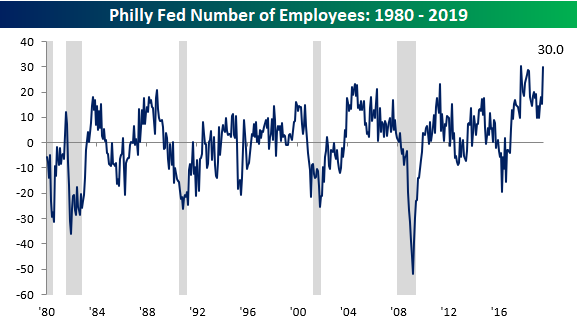
Employment is so strong in fact that the index of Number of Employees has only been higher in one other month spanning the 50-year history of the index. The only other time it was higher was October 2017.
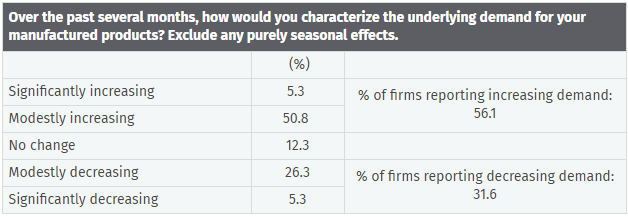
This month’s special question also suggests a solid backdrop for manufacturing firms in the Philadelphia region. When asked about the underlying demand trends for their products, more than half reported increased demand, while less than a third are experiencing weaker demand. Start a two-week free trial to one of Bespoke’s premium research services for coverage of economic, earnings, and market trends.
The Bespoke 50 Top Growth Stocks
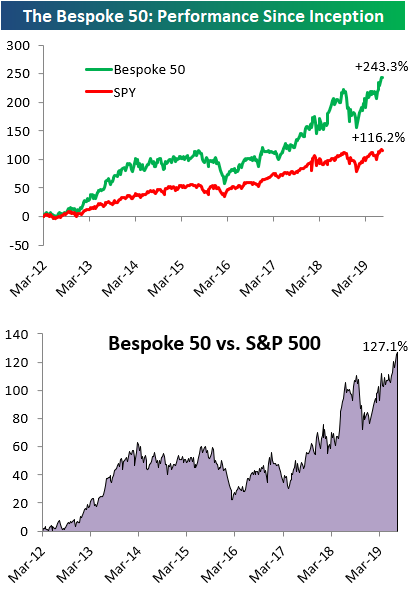
Every Thursday, Bespoke publishes its “Bespoke 50” list of top growth stocks in the Russell 3,000. Our “Bespoke 50” portfolio is made up of the 50 stocks that fit a proprietary growth screen that we created a number of years ago. Since inception in early 2012, the “Bespoke 50” has beaten the S&P 500 by 127.1 percentage points. Through today, the “Bespoke 50” is up 243.3% since inception versus the S&P 500’s gain of 116.2%. Always remember, though, that past performance is no guarantee of future returns. To view our “Bespoke 50” list of top growth stocks, please start a two-week free trial to either Bespoke Premium or Bespoke Institutional.
Pre-Market Earnings Movers: NFLX Down Big; NVS, EBAY, PM Trading Higher
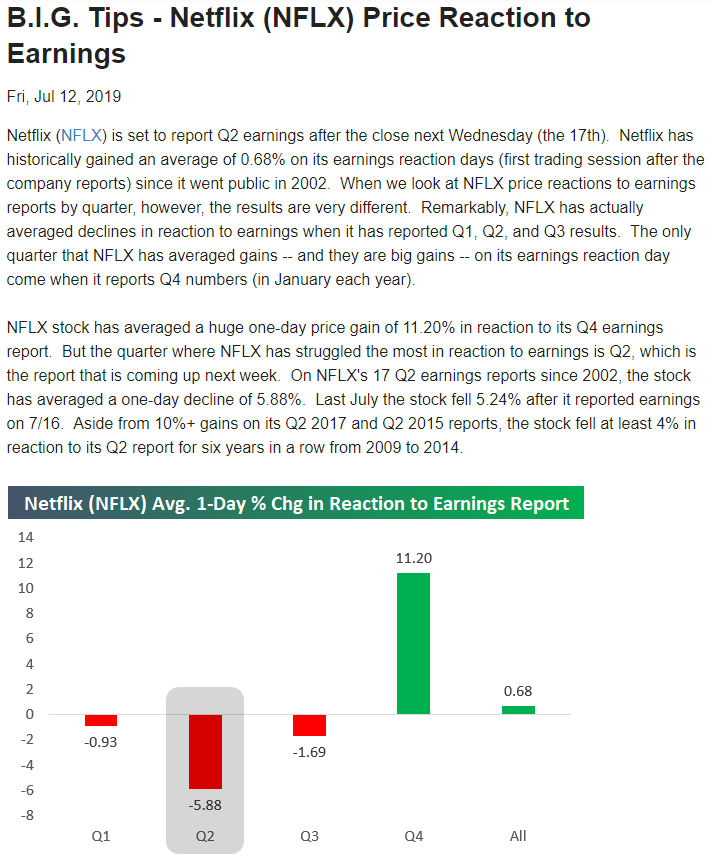
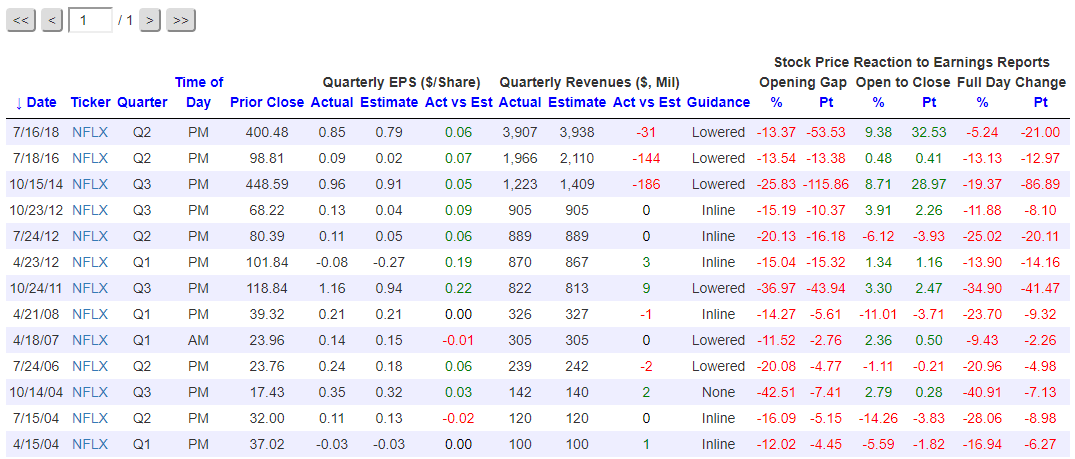
Netflix (NFLX) is trading down sharply in pre-market trading after reporting Q2 earnings after the close yesterday. (Here’s a snapshot of a report we sent subscribers last week noting that Q2 earnings are typically weak for NFLX.) The stock is set to open lower by 11% when markets open for trading this morning. Big gaps up or down of 10%+ are nothing new for NFLX. Since the company went public, this will be the 14th time that NFLX has gapped down 10%+ in reaction to earnings. When looking at how the stock might trade from the open to the close today following its gap lower, note that in the past the stock has traded higher from the open to the close 8 out of 13 times. As shown below, this same reaction happened a year ago when NFLX reported its Q2 2018 numbers. The stock opened down 13.37% on July 17th last year, but traders that bought at the open that day saw a huge gain of 9.38% from the open to the close.
A total of 46 stocks have reported earnings since the close yesterday. Of those 46 stocks, 67% posted better than expected EPS, while just 56% posted better than expected sales.
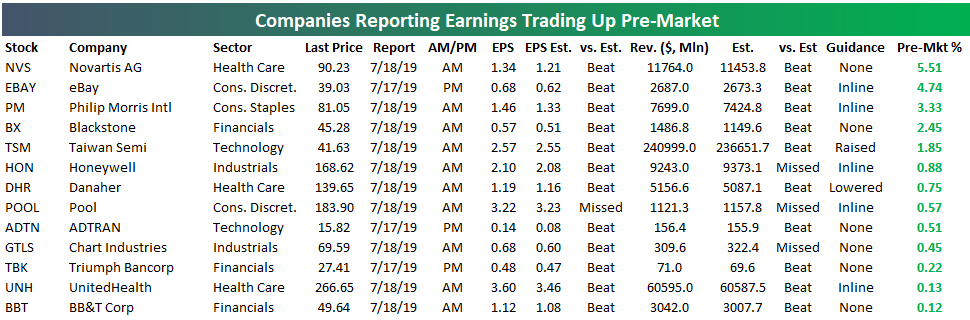
Below we show the stocks that reported earnings since yesterday’s close that are trading up in the pre-market. Novartis (NVS) is set to open higher by 5.5% after beating on both the top and bottom line. eBay (EBAY) is set to open up the second most this AM with an expected gap higher of 4.74%. Philip Morris International (PM) is trading up 3.33% pre-market following big beats on EPS and revenues. If PM opens up more than 3%, it will be its biggest gap up on earnings since its April 2015 report when it opened up more than 5%. Other notables on the list of earnings winners ahead of the open include Blackstone (BX), Honeywell (HON), and Danahar (DHR). (Note that this is a snapshot of where stocks were trading pre-market at 8:30 AM ET, so prices could still change quite a bit before the 9:30 AM ET open.)
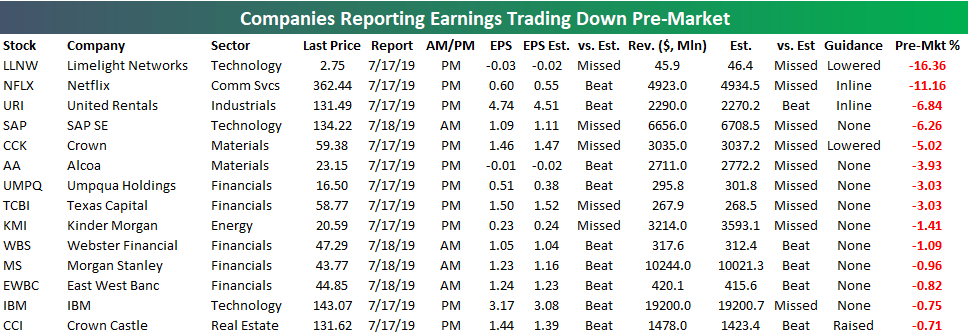
While Netflix (NFLX) is the most notable loser on earnings this morning, Limelight Networks (LLNW) is actually set to open down even more with an expected gap of -16.36%. LLNW reported a reverse earnings triple play by missing EPS estimates, missing revenue estimates, and lowering guidance.
United Rentals (URI), SAP, Crown (CCK), and Alcoa (AA) are other notable stocks set to open down this morning following earnings reports. Need earnings info for stocks you care about most? Start using our Earnings Explorer tool now with a two-week free trial to Bespoke Institutional.
Bespoke’s Morning Lineup – Stocks and Bonds Still Neck and Neck
The earnings flow is now in full swing and Netflix (NFLX) is the early leader for the title of the biggest flop as the stock is down over 10% after missing subscriber growth forecasts. In other earnings news, of the roughly 50 companies that have reported since the close yesterday, two-thirds have exceeded EPS forecasts while slightly more than half have managed to top revenues estimates. This morning’s economic slate kicks off at 8:30 with Jobless Claims and the Philly Fed report while Leading Indicators will be released at 10:00 am.
Read today’s Morning Lineup to get caught up on news and stock-specific events ahead of the trading day and a further discussion of recent earnings reports from around the world.
Bespoke Morning Lineup – 7/18/19

It may sound hard to believe given the recent gains in the equity market, but over the last 12-months, the S&P 500 and long-term Treasuries have had nearly identical returns. The chart below os from page two of our Morning Lineup and shows the relative strength of the S&P 500 versus the US Long Term Treasury future. When the line is rising, it indicates that stocks are outperforming bonds, while a falling line indicates periods where bonds outperformed stocks. With the line currently right at 0.0 through yesterday’s close, after the last twelve months, it has been a dead heat between the two.

Start a two-week free trial to Bespoke Premium to see today’s full Morning Lineup report. You’ll receive it in your inbox each morning an hour before the open to get your trading day started.
The Closer – Media Outperforms, International Data, Beige Book, Housing Starts – 7/17/19
Log-in here if you’re a member with access to the Closer.
Looking for deeper insight on markets? In tonight’s Closer sent to Bespoke Institutional clients, we kick things off with a look at media stocks which have been outperforming in both the US and across the pond in Europe. We also show the top 20 stocks in the S&P 500 so far this year. Next, show economic data out of Canada and France including the strength in the two countries’ manufacturing sectors. We then recap today’s release of the Fed’s Beige Book before finishing with looks at this morning’s housing starts and EIA data.

See today’s post-market Closer and everything else Bespoke publishes by starting a 14-day free trial to Bespoke Institutional today!
Fixed Income Weekly – 7/17/19
Searching for ways to better understand the fixed income space or looking for actionable ideas in this asset class? Bespoke’s Fixed Income Weekly provides an update on rates and credit every Wednesday. We start off with a fresh piece of analysis driven by what’s in the headlines or driving the market in a given week. We then provide charts of how US Treasury futures and rates are trading, before moving on to a summary of recent fixed income ETF performance, short-term interest rates including money market funds, and a trade idea. We summarize changes and recent developments for a variety of yield curves (UST, bund, Eurodollar, US breakeven inflation and Bespoke’s Global Yield Curve) before finishing with a review of recent UST yield curve changes, spread changes for major credit products and international bonds, and 1 year return profiles for a cross section of the fixed income world.
In this week’s report we review the resumed decline in global developed market yields and curve flattening.

Our Fixed Income Weekly helps investors stay on top of fixed income markets and gain new perspective on the developments in interest rates. You can sign up for a Bespoke research trial below to see this week’s report and everything else Bespoke publishes free for the next two weeks!
Click here and start a 14-day free trial to Bespoke Institutional to see our newest Fixed Income Weekly now!
EBAY, IBM Earnings After the Close
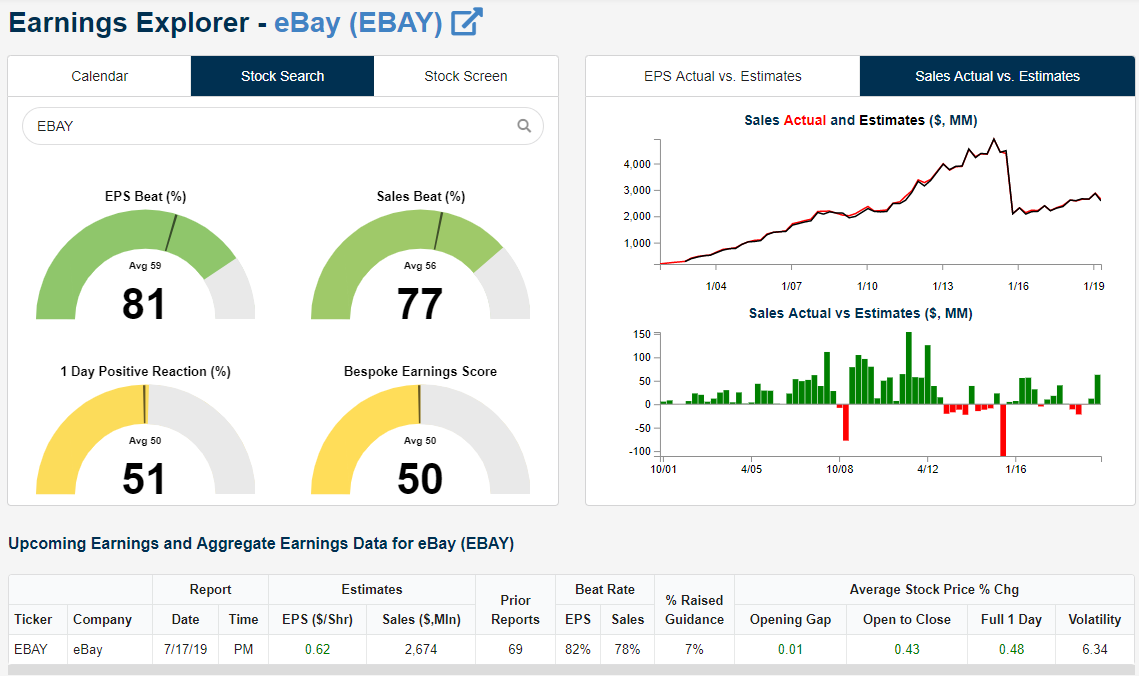
Along with Netflix (NFLX), both eBay (EBAY) and IBM are also reporting Q2 earnings after the close of trading this evening. If you’re interested in our analysis of Netflix earnings, start a two-week free trial to Bespoke Premium and read our recent BIG Tips report on the subject. Below are snapshots of both eBay and IBM from our popular Earnings Explorer tool that’s fully available to Bespoke Institutional subscribers.
As shown, eBay has historically beaten consensus analyst EPS estimates 81% of the time, while it has beaten sales estimates slightly less at 77%. In terms of eBay’s stock price reaction to earnings, the stock has gained on the first trading day following quarterly earnings just a notch above half the time. The likelihood that EBAY will rise or fall in price in reaction to earnings has basically been a coin flip throughout the stock’s history. Be sure to check out some of the other stats included in the snapshot of eBay. You can find this same info for nearly every publicly traded US stock in our Earnings Explorer tool.
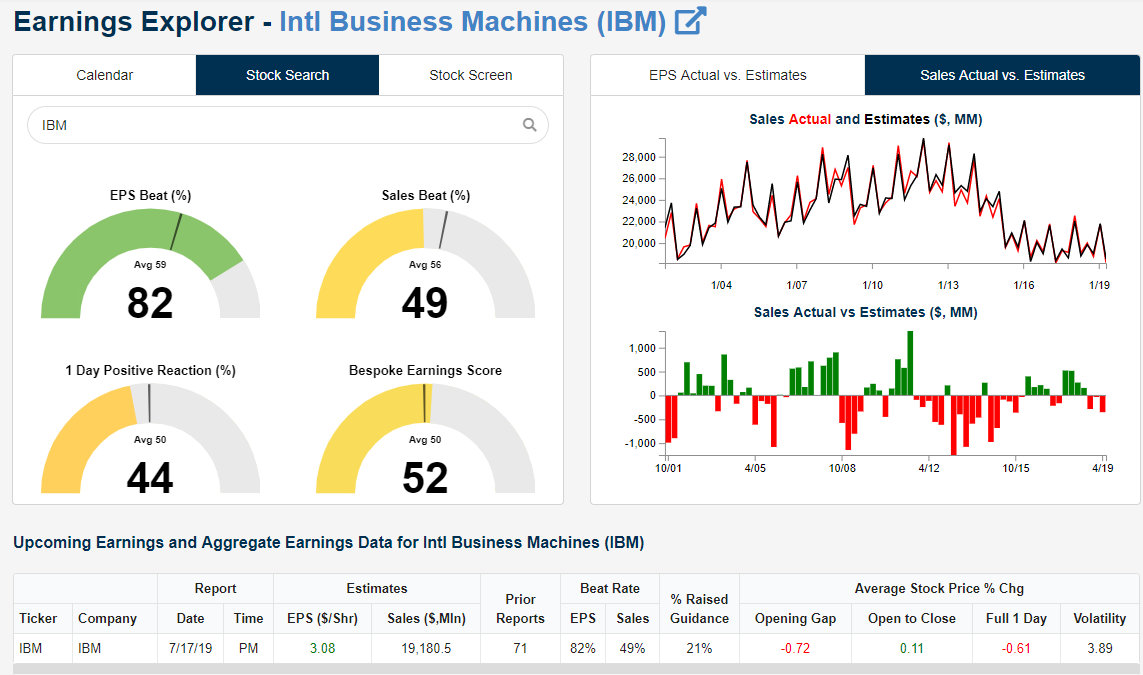
At 82%, IBM has an even stronger EPS beat rate than EBAY, but its sales beat rate is much weaker at just 49%. And IBM’s stock price has only posted gains on its earnings reaction days 44% of the time since 2002. Notice the slowdown in sales that IBM has seen over the last few years in the top right chart below.
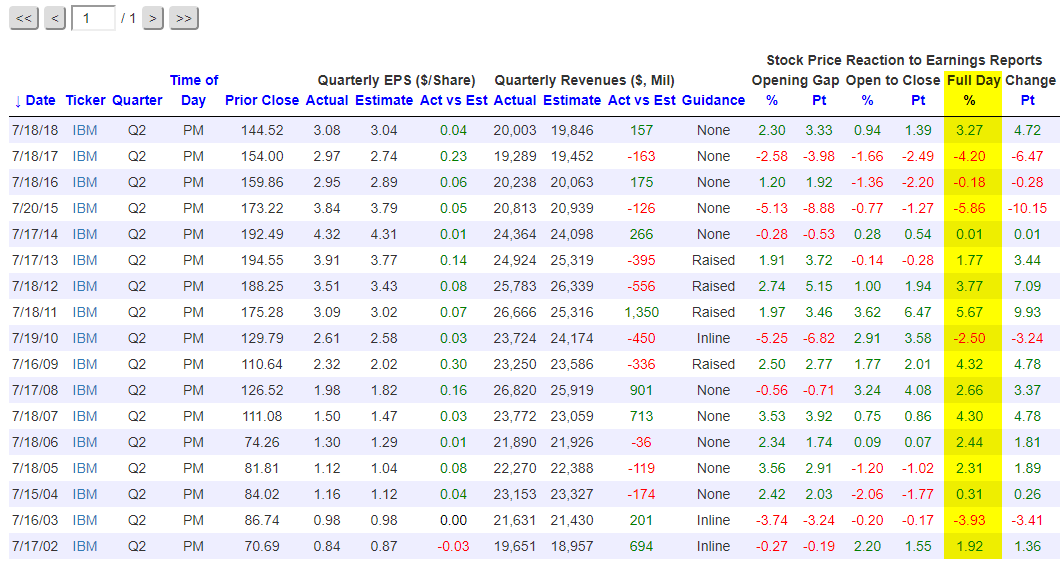
When you look up an individual stock in our Earnings Explorer tool, we also provide detailed info for every single quarterly earnings report that each company has posted over the last 17+ years. Users can break the reports up by quarter so that we can look specifically at IBM’s historical Q2 reports for example. Below is a snapshot of IBM’s historical Q2 reports. We’ve highlighted the stock’s one-day price reaction to the earnings reports as well. As shown, when IBM reported earnings last July, the stock gained 3.27%. But the stock fell on its Q2 earnings day in each of the three prior years.
Overall, however, IBM has actually averaged a gain of more than 1% on its Q2 earnings reaction day when you look at all of its reports since 2002.
Need earnings info for stocks you care about most? Start using our Earnings Explorer tool now with a two-week free trial to Bespoke Institutional.