B.I.G. Tips – Earnings Season Summary and Top Triple Plays
We’ve just published a B.I.G. Tips report that provides a full summary of the ongoing earnings season along with the newest edition of our Top Triple Plays. This season we identified 22 earnings triple plays that have attractive price charts right now.
What is a triple play? When a stock reports quarterly earnings, it registers a “triple play” when it beats analyst EPS estimates, beats analyst revenue estimates, and raises forward guidance. We coined the term back in the mid-2000s, and you can read more about it at Investopedia.com. We consider triple plays to be the cream of the crop of earnings season, and we’re constantly finding new long-term buy opportunities from this basket of names each quarter. You can track the newest earnings triple plays on a daily basis at our Triple Plays page if you’re a Bespoke Premium or Bespoke Institutional member.
To read our newest report and see the triple plays that we think look the best right now, start a two-week free trial to Bespoke Premium!

Bespoke’s Morning Lineup – A Mild Hangover
Thursday’s rally in US equities helped cap off one of the most impressive rebounds in recent memory as the S&P 500, Nasdaq, and even the Russell 2000 erased all of their losses from Monday. After the massive party, we look to be closing out the last day of the week with a bit of a hangover. Markets in Asia were mixed overnight, but Europe is broadly lower with declines of over half of one percent. US futures are also indicating a similar decline at the open, while treasury yields are modestly lower across the board. Oil is still down 4% on the week but is up more than 5% from its lows on Wednesday, while gold remains above $1,500 per ounce. Continue reading in today’s Morning Lineup.
Bespoke Morning Lineup – 8/9/19

The Closer – Round Trip – 8/8/19
Log-in here if you’re a member with access to the Closer.
Looking for deeper insight on markets? In tonight’s Closer sent to Bespoke Institutional clients, we give a quick update on the technicals of the S&P 500 this week, showing the double bottom made over the past few sessions. We also show where the S&P now sits within its trading range, the relative strength of the sectors since the Fed’s rate cut, and recent price action in semis. We finish with a look at this week’s Initial Jobless Claims and AAII sentiment survey before one final note on earnings.

See today’s post-market Closer and everything else Bespoke publishes by starting a 14-day free trial to Bespoke Institutional today!
Bespoke’s Sector Snapshot — 8/8/19
The Bespoke 50 Top Growth Stocks
Every Thursday, Bespoke publishes its “Bespoke 50” list of top growth stocks in the Russell 3,000. Our “Bespoke 50” portfolio is made up of the 50 stocks that fit a proprietary growth screen that we created a number of years ago. Since inception in early 2012, the “Bespoke 50” has beaten the S&P 500 by 131.8 percentage points. Through today, the “Bespoke 50” is up 244.3% since inception versus the S&P 500’s gain of 112.5%. Always remember, though, that past performance is no guarantee of future returns. To view our “Bespoke 50” list of top growth stocks, please start a two-week free trial to either Bespoke Premium or Bespoke Institutional.
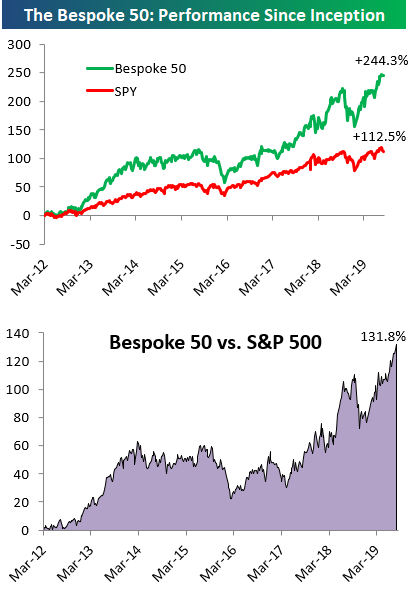
Chart of the Day: Big Spikes in Bearish Sentiment
Can You Be Surprised With Roku (ROKU)?
Roku (ROKU) is the second best performing stock in the Russell 1000 today with a gain of more than 20%. The catalyst for this move is a strong earnings report after the close yesterday. ROKU is also one of ten stocks that reported a triple play in the past 24 hours. On top of raised guidance, ROKU also reported revenues of $250.1 million compared to estimates of $223.36 million, representing a 59.5% growth rate from a year ago and the second-highest sales figure for any quarter in the stock’s history.
While the larger than 20% move may jump out, looking through the stock’s earnings history in our Earnings Explorer tool, for ROKU it is actually more or less par for the course. ROKU has been one of the most volatile stocks on earnings, averaging a move on its earnings reaction day of +/-24.47%. The company has also reported two other triple plays in its seven prior reports; once in its first-ever report in November of 2017 and again last quarter. Both of these saw extremely positive reactions with a 54.94% full-day gain in 2017 and 28.11% gain last quarter. If ROKU manages to hold onto this 20% gain through the close, it will mark the third straight quarter with an over 20% gain in response to earnings.

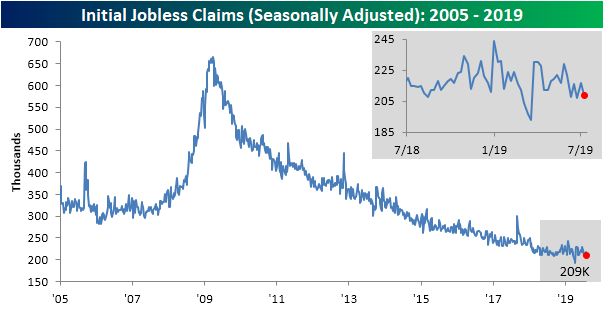
Small Claims Change
Today’s initial jobless claims release was expected to come in unchanged from last week’s reading of 215K. Instead, claims fell to 209K while last week’s data was revised up to 217K. After reaching recent highs in June, initial jobless claims been in a tight range between 208K and 217K all summer with this week’s print being at the low end of this range. Claims also held onto their record streaks below 250K and 300K at 96 and 213 weeks, respectively.
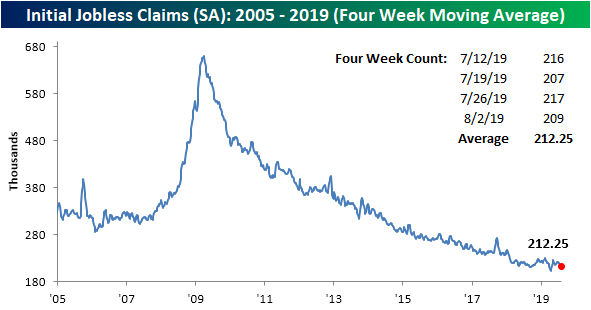
Despite the lower reading this week in the seasonally adjusted number, the four-week moving average actually moved up ever so slightly to 212.25K compared to 212K last week. Even with the increase, though, the four-week moving average remains right near its lows for the cycle.
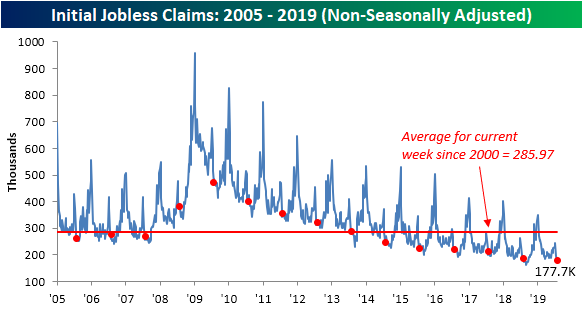
On a non-seasonally adjusted basis, claims also saw a very small change only falling 0.2K to 178.7K. That is the smallest week-over-week change for any week since last October. For the current week of the year (31st week), this was the smallest absolute change week over week since 1986 when it rose by 0.2K. In the history of the data, the current week of the year has averaged a decline of 16.65K as the indicator is usually still working off of its seasonal peak from a few weeks prior. Despite the minor move lower, at the current level, unadjusted claims are now at the lowest levels since the post-recession cycle lows reached last September. Overall, although it continues to reaffirm labor market strength, this week’s release also further epitomizes the slower pace of improvement that we have recently seen in the labor market. Start a two-week free trial to Bespoke Institutional to access our interactive economic indicators monitor and much more.
Austria.com
Following recent moves in financial markets in the last few days, there are some pretty nutty looking charts out there, but one that sticks out more than most others is the performance of the Austrian 100-year bond. Launched in late 2017 with a yield of 2.1%, there were more than a few people who laughed at the fact that anyone would lend money to any government for a hundred years at an annual coupon of just 2.1%. Well, the only people laughing now are the ones who bought it. Since inception, the Austrian 100-year has seen a rally of 84.1% and that doesn’t even include the precious 2.1% coupon. Just this year, the bond has rallied 58%, and since the end of Q2, it has rallied 18.5%. It’s up almost 8% in August alone!
Today, the rally in fixed income has run out of steam and the price of the bond is down nearly 4%. If those losses hold, it would be the worst one-day decline for the bond since May 2018. Is this the beginning of the end in the fixed income rally? Who knows. And while we would probably stay away from a security like this, we stayed away back when it launched too. Start a two-week free trial to Bespoke Premium to access Bespoke’s most actionable research reports.

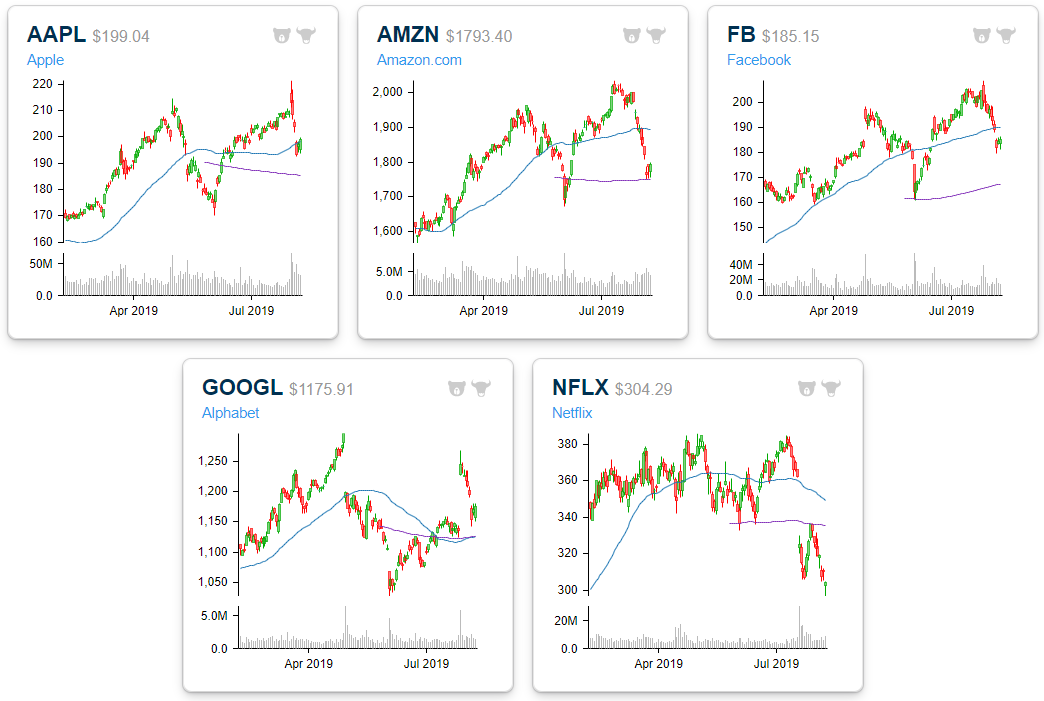
Where FAANG Sits
For those keeping score, Apple (AAPL) has been the worst performing FAANG stock over the past week with a decline of 6.57%. Netflix (NFLX) is down the second most at -5.79%, while Alphabet (GOOGL) has held up the best with a drop of 3.47%. All five have of course moved lower within their trading ranges over the last week, but NFLX is the most oversold, while Amazon (AMZN) is also trading just into oversold territory. Even with its recent drop, Apple (AAPL) has managed to hang above support at its 50-day moving average. Start a two-week free trial to Bespoke Premium to access Bespoke’s most actionable research reports.

Below is a look at six-month price charts for the five widely-followed FAANG names. While AMZN has broken below its 50-day moving average, it has managed to hold above support at its 200-day this week. Netflix, on the other hand, is well below both its 50-DMA and its 200-DMA, and the last time it tested its 200-DMA, it failed miserably.