Chart of the Day: Rates Lower, Stocks Higher
Trend Analyzer – 8/12/19 – Back Under
Friday’s declines brought the major US index ETFs back below their 50-day moving averages. Although these ETFs closed out the week lower, only the Russell 2000 (IWM) and Micro-Cap ETF (IWC) were down over 1%. IWC, in particular, continues to be the weakest of these major indices. Falling 2.2% last week, it is once again approaching extreme oversold territory. IWC is also still the only one to show a downtrend in our Trend Analyzer.
Using our Chart Scanner, you can see the fake-out of a break above the 50-DMA for the major index ETFs. Small caps are also looking to move below their 200-DMAs as IWC has already done so. As previously mentioned, although only IWC is in a downtrend in our Trend Analyzer, other small caps like the Core S&P Small-Cap ETF (IJR) and the Russell 2000 (IWM) have made a series of lower lows in the past six months. But the major distinction is last week’s declines did not bring IJR or IWM to a new low. Similarly, for the rest of the major index ETFs, which currently sit between their 50 and 200-DMAs, the recent volatility has also marked higher highs and higher lows. In other words, while the past couple of weeks have seen dramatic movements, they have yet to do any real damage to recent trends. Start a two-week free trial to Bespoke Institutional to access our Trend Analyzer, Chart Scanner, and much more.

Bespoke’s Morning Lineup — 8/12/19
Equity futures were higher overnight but have since sold off ahead of the open. The S&P 500 SPY ETF is currently trading down 0.50% in the pre-market. The 10-Year Treasury yield has fallen another 5 basis points down to 1.68%, causing the yield curve (10s/3s) to further invert. Protests in Hong Kong continue to strengthen, causing the Hong Kong airport to cancel all flights today.
Bespoke’s Morning Lineup is the best way to start your trading day. Read it now by starting a two-week free trial to Bespoke Premium. CLICK HERE to learn more and start your free trial.

The Bespoke Report – 8/9/19
This week’s Bespoke Report newsletter is now available for members.
In this week’s newsletter, we provide our thoughts on where the market is headed after a volatile week that basically ended up flat. To read the Bespoke Report and access everything else Bespoke’s research platform has to offer, start a two-week free trial to one of our three membership levels. You won’t be disappointed!

Next Week’s Economic Indicators – 8/9/19
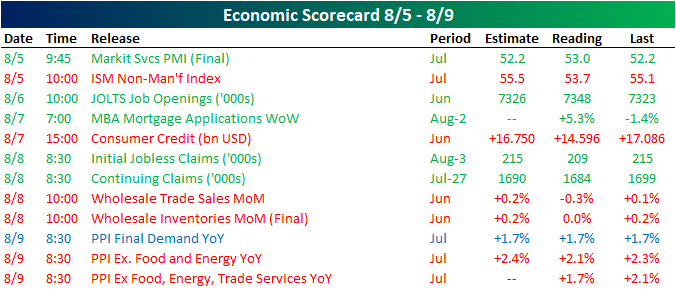
It was a quiet week in economic data with only 12 releases. Half of these came in worse than expected or versus the previous period while another five saw improvements. The remaining release met expectations. Markit and ISM PMIs kicked things off on Monday with some mixed results. Both showed growth, but whereas the Markit release beat expectations and improved from June, the ISM reading was both worse than expectations and lower than the prior month. Labor data was strong this week as the JOLTS report, initial jobless claims, and continuing claims all surpassed forecasts. Headline PPI on Friday met expectations but the core readings were both worse than anticipated.
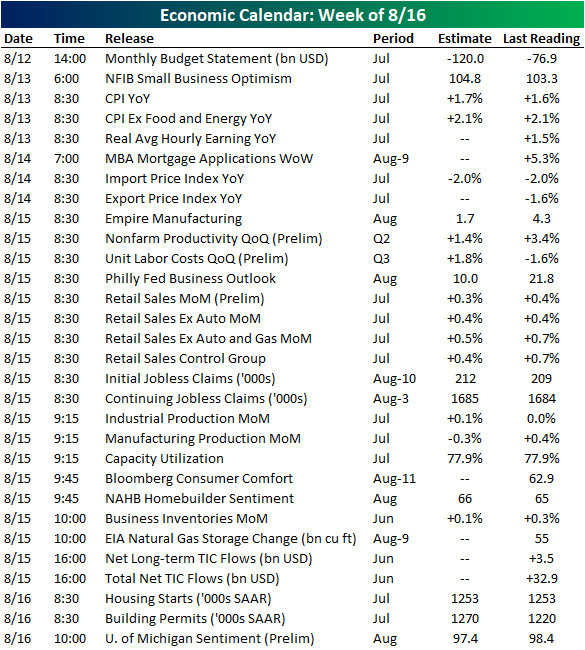
Economic data ramps up next week with 30 releases on the docket. The budget statement starts off the week as the only release on Monday. On Tuesday, NFIB releases July’s reading on small business optimism. The indicator is expected to tick up to 104.8 from 103.3 in June. Following the July CPI release later that morning, export and import price indices are scheduled for Wednesday. A majority of next week’s data—a total of 19 releases—is crammed into Thursday. In manufacturing data, we will get releases from the Empire Manufacturing Index and the Philadelphia Fed’s Business Outlook. Industrial production for July is also due to release on Thursday. Last month industrial production was flat month-over-month. Retail sales figures are also scheduled to release on Thursday and are forecasted to slow versus June. Finally, after the NAHB’s Homebuilder Sentiment Index releases Thursday morning, housing starts and building permits will round out the week on Friday. Homebuilder sentiment and building permits are both expected to improve. No change is expected in starts. Start a two-week free trial to Bespoke Institutional to access our interactive economic indicators monitor and much more.
The Closer: End of Week Charts — 8/9/19
Looking for deeper insight on global markets and economics? In tonight’s Closer sent to Bespoke clients, we recap weekly price action in major asset classes, update economic surprise index data for major economies, chart the weekly Commitment of Traders report from the CFTC, and provide our normal nightly update on ETF performance, volume and price movers, and the Bespoke Market Timing Model. We also take a look at the trend in various developed market FX markets.

The Closer is one of our most popular reports, and you can sign up for a free trial below to see it!
See tonight’s Closer by starting a two-week free trial to Bespoke Institutional now!
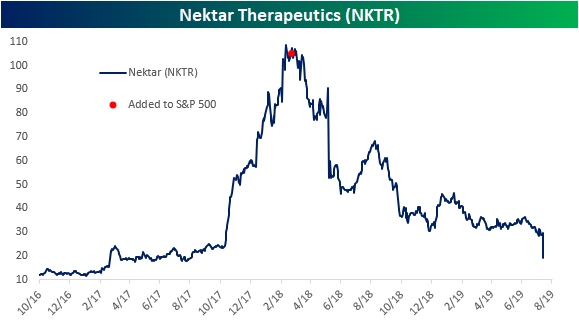
Nektar Therapeutics (NKTR) Falls Victim to the Index Curse
Nektar Therapeutics (NKTR) is a biotechnology firm that partners with drug-makers like Bristol-Myers Squibb (BMY), Pfizer (PFE) and AstraZeneca (AZN) to improve upon pre-existing drugs and treatments. Once these products are approved by regulators, the company generates revenues through royalties. After yesterday’s close, NKTR reported second-quarter earnings. The company reported revenues of $23.32 million which was below estimates of $26.65 million.
Today, the stock is trading 32.4% lower but the drop wasn’t entirely due to earnings. NKTR also announced that one of its pipeline drugs being developed with BMY had manufacturing errors that caused issues in its clinical trials. This resulted in multiple analyst downgrades; tacking on another of many negative catalysts the stock has seen in the last year. In addition to this most recent issue, in late July, the company had disclosed delays concerning another drug after the FDA considered opioid regulation changes.
The last year and a half has been tough for NKTR, but what’s even worse is that all of the problems for the stock started to happen right when it was added to the S&P 500 in March 2018. NKTR has now been in the S&P 500 for 352 trading days and during that time it has averaged a daily decline of 0.36% with the stock dropping from $105.01 to below $20 today. That’s a decline of over 70%. For comparison, in the same number of days leading up to its inclusion to the S&P 500, NKTR had averaged a daily gain of 0.7% and had increased 740.8%. Talk about a bad case of the index curse! Start a two-week free trial to Bespoke Institutional to access our interactive economic indicators monitor and much more.
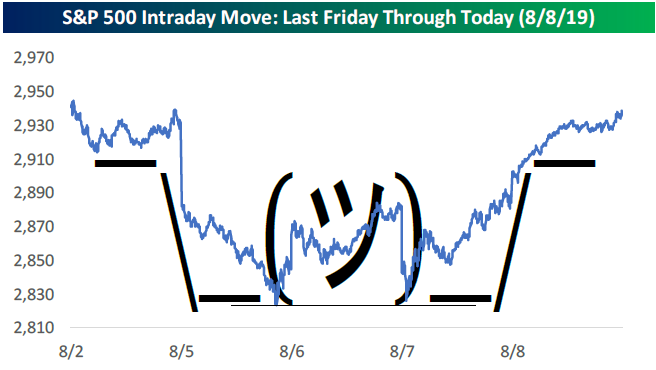
Perfect “Shrug” Pattern Emerges for the S&P 500
The S&P 500 ripped higher by nearly 2% yesterday on no significant news, and when combined with gains seen over the prior two days, the index gained back all of its losses from Monday’s 3% drop.
The technicals show a near perfect double bottom formed from the intraday lows on Monday and Wednesday. The 2,830 level proved to be very strong support that saw buyers step in just when things looked their bleakest this week.
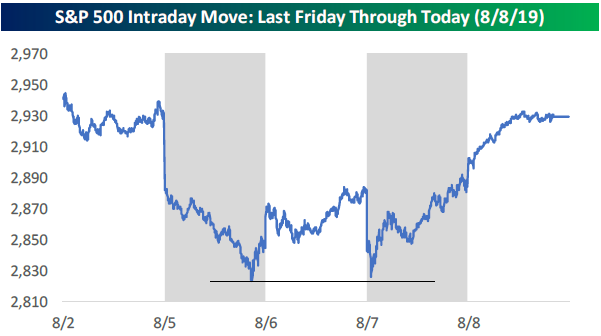
To throw some levity into the mix, the intraday chart of the S&P 500 over the last week has amazingly formed a perfect “shrug” pattern from the famous emoji that you’ve likely seen before in texts or on social media (especially if you have teenage kids)! A picture is certainly worth 1,000 words. Talk about the perfect description of this market! Start a two-week free trial to Bespoke Premium to get Bespoke’s best equity market research.
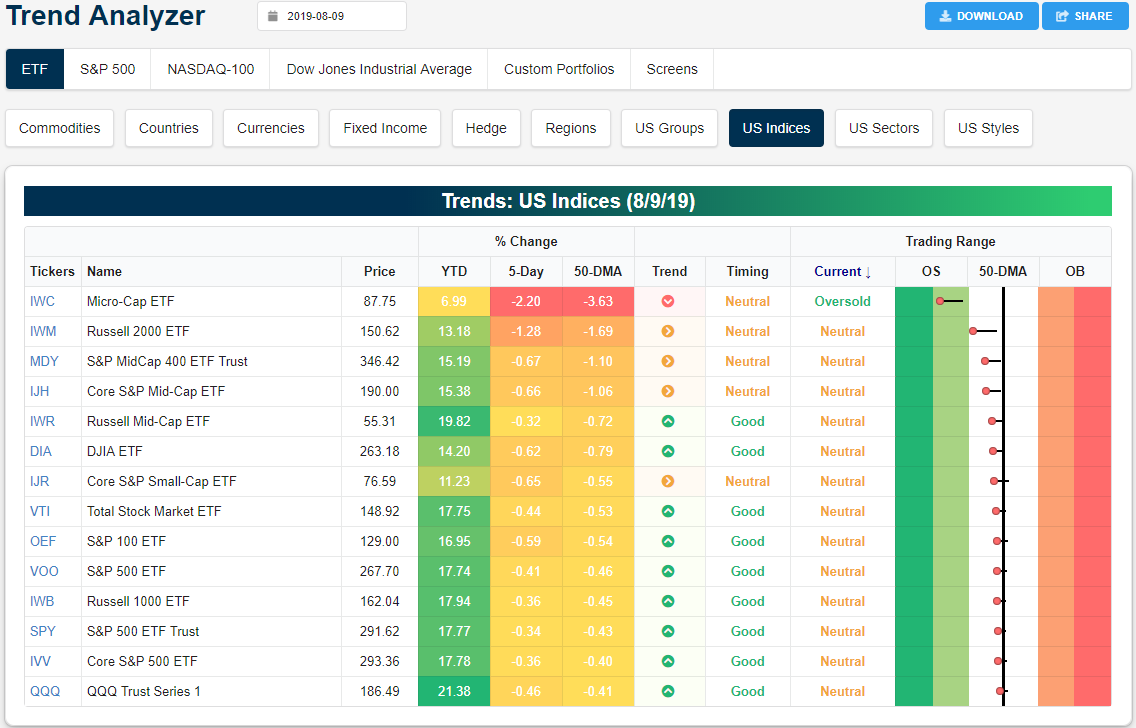
Trend Analyzer – 8/9/19 – Rebound
Equities are still lower than they were at the end of last week, but the past few days have seen a massive rebound which has eliminated most of the past week’s declines. Yesterday’s rally brought most of the major index ETFs back above their 50-DMAs. Only the Dow (DIA), Micro-Cap (IWC), and Russell 2000 (IWM) did not manage to break back above these levels. While IWM and DIA are both less than 0.4% away from their 50-day, IWC has much more progress to make until it does the same as it sits 2.39% below its moving average. IWC is also the only ETF of this group that is oversold and in a downtrend. Other major index ETFs have held onto their uptrends and are still showing good timing scores.
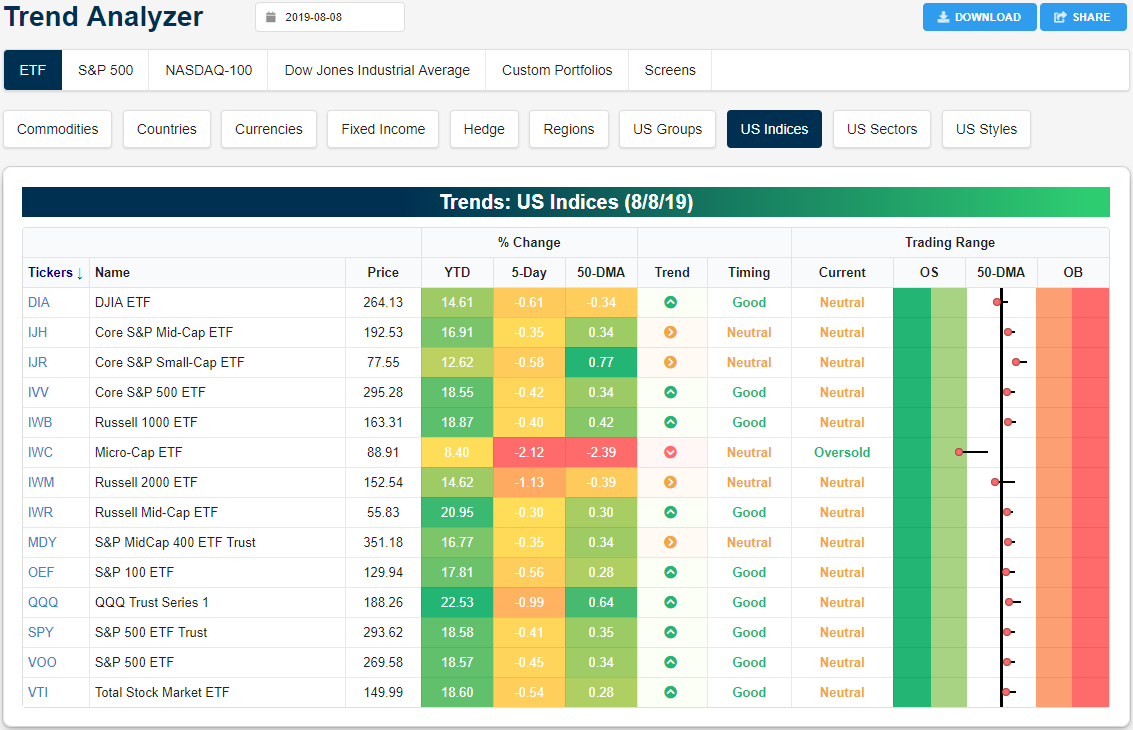
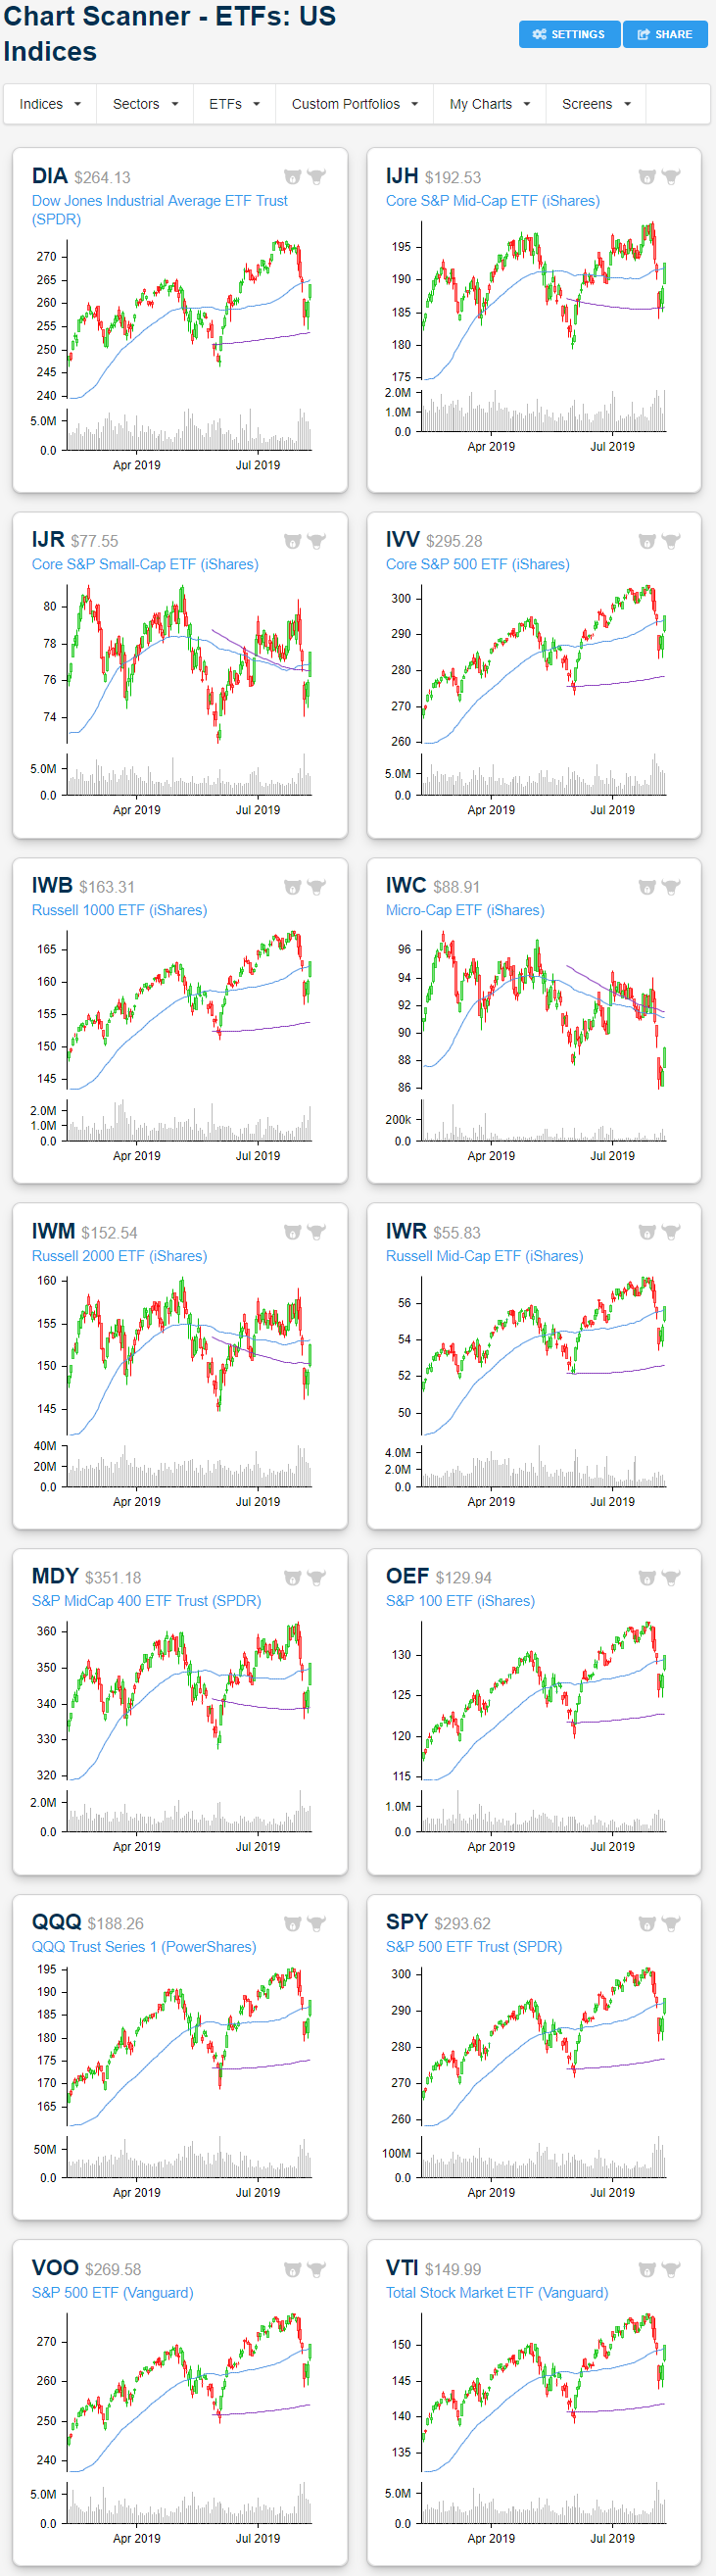
While the past week’s price action has been volatile, from a purely technical standpoint the past few days’ gains have marked a higher low on a longer-term chart for many of these ETFs. The Dow (DIA) and mid-cap ETFs like the Core S&P Mid-Cap (IJH) and S&P MidCap 400 (MDY) all found logical support close to the 200-DMA. On the other hand, IWC’s bottom earlier this week marked a lower low. Start a two-week free trial to Bespoke Institutional to access our Trend Analyzer, Chart Scanner, and much more.
B.I.G. Tips – Earnings Season Summary and Top Triple Plays
We’ve just published a B.I.G. Tips report that provides a full summary of the ongoing earnings season along with the newest edition of our Top Triple Plays. This season we identified 22 earnings triple plays that have attractive price charts right now.
What is a triple play? When a stock reports quarterly earnings, it registers a “triple play” when it beats analyst EPS estimates, beats analyst revenue estimates, and raises forward guidance. We coined the term back in the mid-2000s, and you can read more about it at Investopedia.com. We consider triple plays to be the cream of the crop of earnings season, and we’re constantly finding new long-term buy opportunities from this basket of names each quarter. You can track the newest earnings triple plays on a daily basis at our Triple Plays page if you’re a Bespoke Premium or Bespoke Institutional member.
To read our newest report and see the triple plays that we think look the best right now, start a two-week free trial to Bespoke Premium!