The Closer: End of Week Charts — 9/6/19
Looking for deeper insight on global markets and economics? In tonight’s Closer sent to Bespoke clients, we recap weekly price action in major asset classes, update economic surprise index data for major economies, chart the weekly Commitment of Traders report from the CFTC, and provide our normal nightly update on ETF performance, volume and price movers, and the Bespoke Market Timing Model. We also take a look at the trend in various developed market FX markets.

The Closer is one of our most popular reports, and you can sign up for a free trial below to see it!
See tonight’s Closer by starting a two-week free trial to Bespoke Institutional now!
DocuSign (DOCU) No Longer Flawless On Earnings But…
DocuSign (DOCU) reported after the close yesterday and for the first time since the company went public back in April of 2018, it did not report an earnings triple play. Although revenues grew 41% YoY to $235.61 million (~$15 mm above estimates) and the company raised guidance, EPS was 3 cents below analyst estimates. As shown in our Earnings Explorer below, before this report DOCU had been flawless on earnings. Despite the strong fundamental picture from these past quarters, the stock price reaction has consistently been negative. Only after the first earnings report as a public company did the stock finish the next day higher, and even then, it fell from open to close.
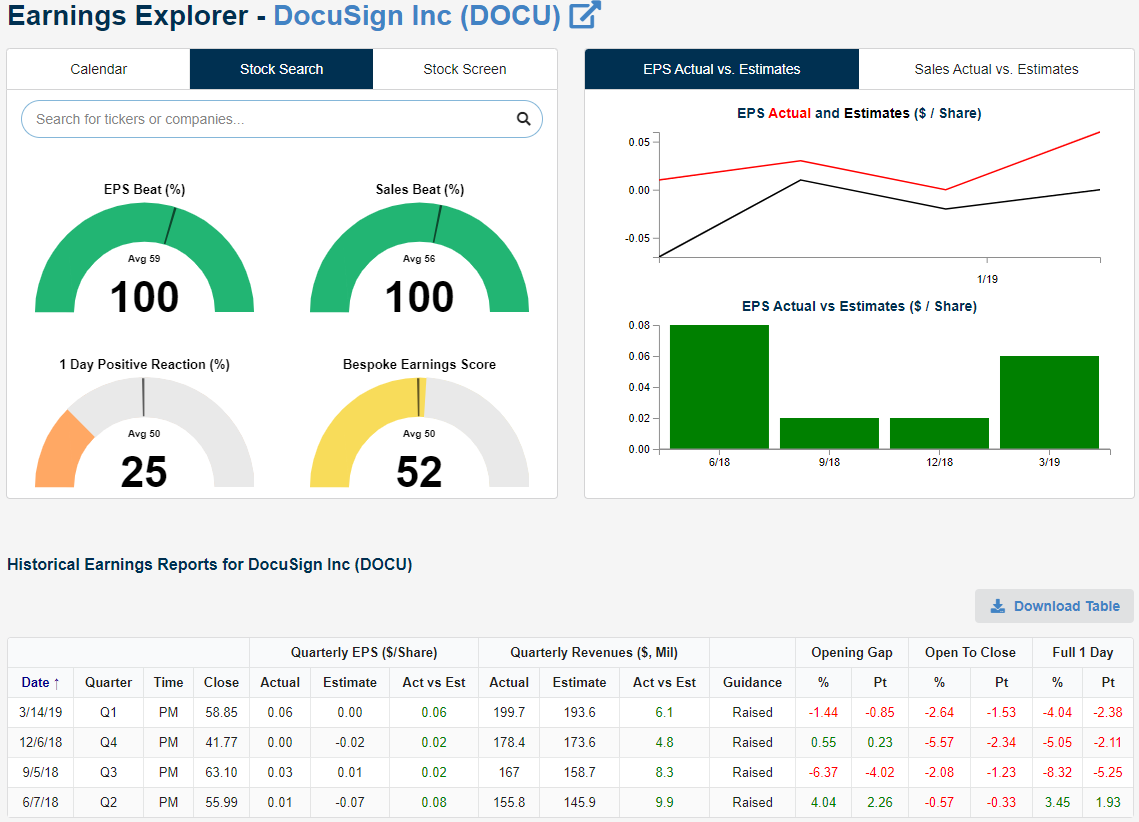
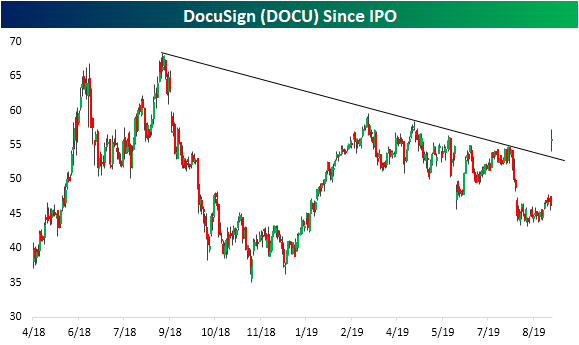
Given this somewhat confusing disconnect between strong results and the stock’s reaction, it almost seems to make sense that DOCU rallied today despite missing EPS for the first time. DOCU broke a streak of three straight moves lower on earnings with a gap up of 20.4% at the open. Intraday the stock has more or less held onto these gains but experienced swings of a few percentage points in both directions. At the highs of the day, it was up 3.3% from the open and at today’s lows, it was down 2.9% from the open. Regardless of the indecisive intraday price action, the massive gap up has brought the stock back up to levels last seen at the end of May and above the past year’s downtrend line. The stock is also now trading above its 50 and 200-day moving averages for the first time since the beginning of August. Start a two-week free trial to Bespoke Institutional to access our interactive Earnings Explorer and much more.
Economic Surprise Index Turns Positive
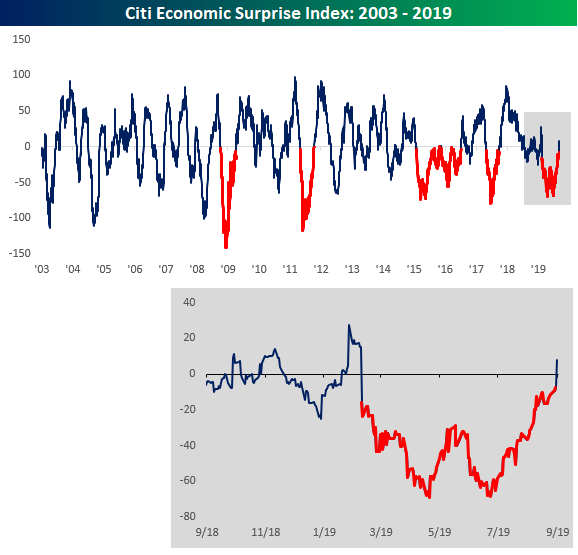
When it comes to economic reports, one trend that has seemingly been in place all year is that the vast majority of data points have come in short of expectations. The fact that economic momentum has been slowing is one thing, but when the economy consistently comes up short relative to expectations, it sets a tone that things are quickly deteriorating. That’s never a good thing, but thankfully, there are signs that the tide is turning.
The Citi Economic Surprise Index measures the pace at which economic indicators are coming in ahead of or below consensus forecasts. When the index is negative, it means that the majority of reports are coming in below expectations, while a positive reading indicates that most data is coming in ahead of expectations. The chart below shows the index going back to 2003, and the parts where the line is red indicate periods where the index was negative for at least 100 trading days. The most recent period of negative readings was one of the longest ever at 140 trading days and just the 6th streak of 100 or more trading days (during the period from 2015 to 2016 there were actually two separate streaks although it looks like just one long streak in the chart). The fact that this index is now positive indicates that economists have finally ratcheted down estimates enough to be in line with actual conditions on the ground. Start a two-week free trial to Bespoke Institutional to access our interactive economic indicators monitor and much more.
Canadian Employment Growth At Cycle High
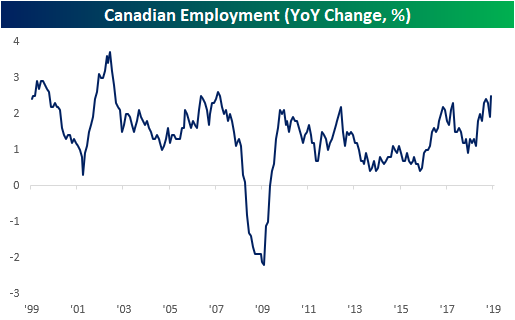
While today’s Nonfarm Payrolls report in the US may have disappointed with only 130K added jobs compared to estimates of 160K, our neighbors north of the border got a very strong reading on their labor market. The number of employed persons in Canada grew by 81.1K in August with most of the added jobs being part-time work. This smashed estimates for a 20K increase and was a nice rebound from the prior month’s decline of 24.2K. Since August of last year when YoY growth was just 0.9%, the Canadian labor market has been growing more rapidly with the most recent reading showing a 2.5% increase from last year. That is the highest year-over-year growth rate of the cycle and the strongest since November 2007, right before the onset of the Financial Crisis. Start a two-week free trial to Bespoke Institutional to access our interactive economic indicators monitor and much more.
Next Week’s Economic Indicators – 9/6/19
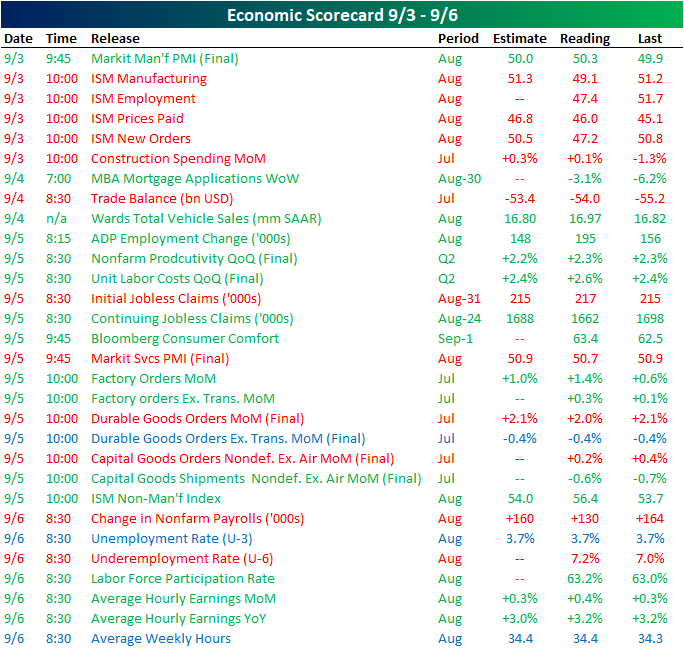
Despite a shortened week from the Labor Day holiday, there was a heavy slate of economic data with a total of 30 releases. Half of these came in better than estimates or the prior period’s reading while another 13 missed or weakened. Three indicators were in line with estimates. There was a lot of manufacturing data this week including readings from Markit and the ISM, Factory Orders, Durable Goods, and Capital Goods. The ISM reading was the most strikingly negative of these as it showed a contractionary reading. The ISM and Markit service counterparts, on the other hand, showed healthier levels, but the Markit PMI did miss estimates. Labor data also was a major focus this week and the overall results were pretty mixed. ISM employment, initial jobless claims, and today’s NFP report all disappointed, but the ADP employment change, continuing claims, and labor force participation rate came in stronger than expected. Similarly, each indicator for wages including quarterly unit labor costs and average earnings showed improvements.
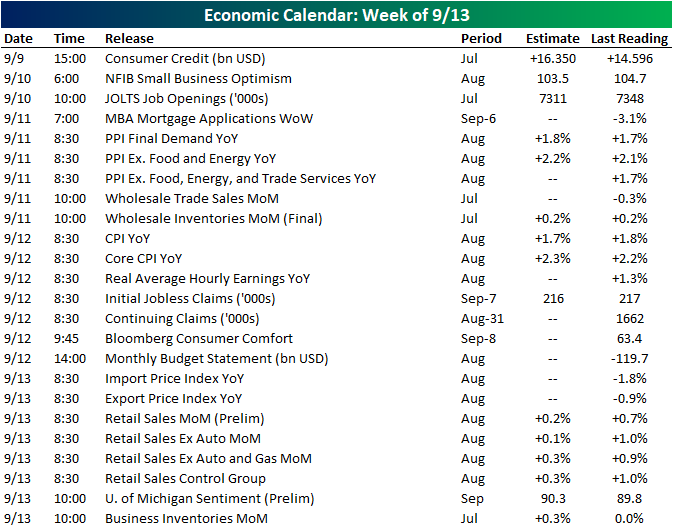
It will be slightly less busy next week with only 24 releases scheduled. Following up on this week’s labor data, the JOLTS report is due out Tuesday morning and is expected to show fewer job openings than June. Inflation indicators like PPI, CPI, and export and import prices make up a considerable portion of next week’s data. Core estimates for both PPI and CPI are forecasted to show higher price inflation in August. In addition to preliminary consumer sentiment, on Friday we will also get a reading on retail sales for August. For both core and headline readings, this indicator is expected to slow significantly MoM compared to July. Start a two-week free trial to Bespoke Institutional to access our interactive economic indicators monitor and much more.
Trend Analyzer – 9/6/19 – Stocks No Longer Oversold
For the first time since August 1st, not a single major index ETF in our Trend Analyzer is oversold. This comes as the Micro-Cap ETF (IWC) finally closed within one standard deviation of its 50-DMA yesterday. As with other small caps like the Russell 2000 (IWM) and Core S&P Small-Cap ETF (IJR), even though IWC has worked off of its oversold levels, it has still yet to move back above its 50-DMA. IWC is also the only index ETF currently in a downtrend. Granted, the trends of the other major indices still leave a lot to be desired considering only the S&P 500 is in an uptrend.

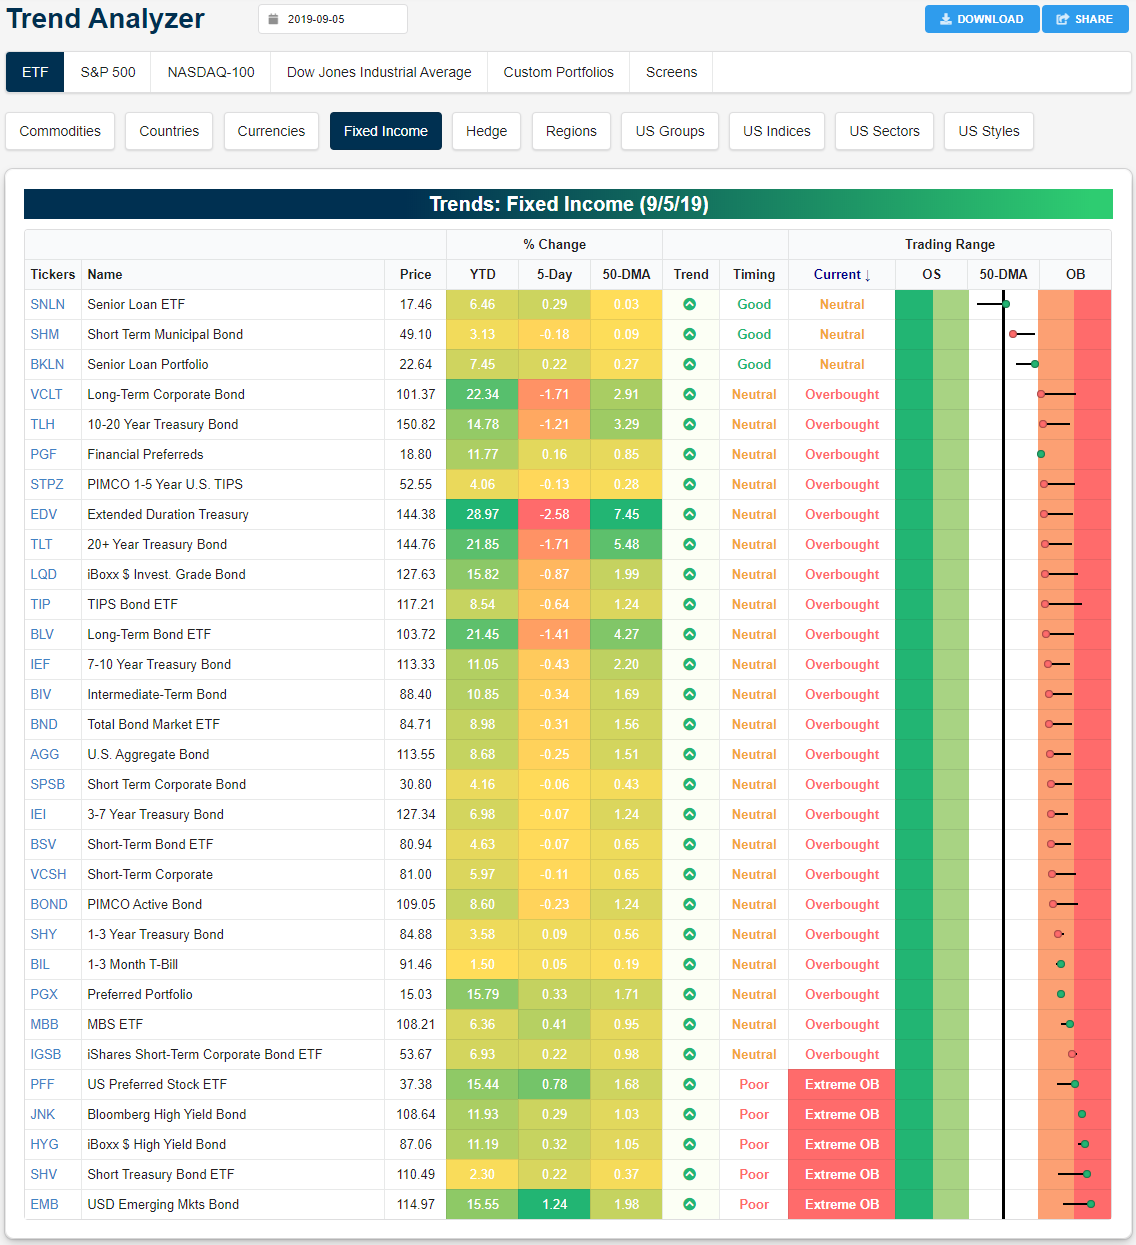
While stocks have worked off of the past month’s persistent oversold readings, fixed income has yet to do the reverse. Although there has been a some mean reversion with most fixed income ETFs lower than where they were a week ago, the vast majority are overbought. As investors have begun to put risk back on, preferred stocks (PFF), High Yield (JNK and HYG), Short Treasury Bonds (SHV), and Emerging Market Bonds (EMB) have actually become extremely overbought. Of these, EMB has rallied the most with a 1.24% gain. On the other hand, the long end of the curve has been met with more intense selling. The Long-Term Corporate Bond ETF (VCLT), 10-20 Year Treasury Bond ETF (TLH), 20+ Year Treasury Bond (TLT), Long-Term Bond ETF (BLV), and Extended Duration Treasury ETF (EDV) are all down well over 1% over the past week. EDV has been met with the worst of these declines as it has fallen 2.58%. This is after the ETF was the most extended above its 50-DMA and has risen the most so far in 2019. Start a two-week free trial to Bespoke Institutional to access our Trend Analyzer and much more.
Bespoke’s Morning Lineup — Jobs and Jerome
See what’s driving market performance around the world in today’s Morning Lineup. Bespoke’s Morning Lineup is the best way to start your trading day. Read it now by starting a two-week free trial to Bespoke Premium. CLICK HERE to learn more and start your free trial.

The Closer – STIRs Specs Burned In Dash For Trash – 9/5/19
Log-in here if you’re a member with access to the Closer.
Looking for deeper insight on markets? In tonight’s Closer sent to Bespoke Institutional clients, we kick things off with a look at the massive move on the front end of the curve and a decile analysis of S&P 500 stocks with respect to performance since the index’s all-time high. After taking a look at the near breakout for copper, we then review the relationship between FX and rates. Turning to macro data, we also show the relationship between the manufacturing and non-manufacturing counterparts of the most recent ISM data. We also review the new orders component of the ISM data in addition to other new order, manufacturing sales, and inventories data reported by the US Census. We finish with a look at the move in crude oil given this week’s inventory data

See today’s post-market Closer and everything else Bespoke publishes by starting a 14-day free trial to Bespoke Institutional today!
B.I.G. Tips – August Employment Report Preview
With fears of a recession on the rise, investors are looking for any potential signs of cracks in the economic picture. Tuesday’s ISM Manufacturing report, which showed the first contraction in the manufacturing sector in a couple of years, was one of those signs, but the stronger than expected report from the ISM Services report earlier today helped to allay those concerns. When it comes to the market, trade talks, or economic data, lately it seems like we’re simply running in place. For every good market day, tweet, or economic report, it seems as though there is a negative one to offset it. Today’s rally in equities looks to be an attempt by the market to break out of the rut it has been in, so will tomorrow’s payrolls report start another positive streak for the economy?
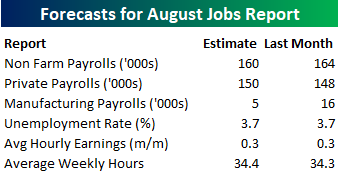
Heading into tomorrow’s report, economists are expecting an increase in payrolls of 160K, which would be a slight decline from July’s reading of 164K. In the private sector, economists are actually expecting a slight increase from July to 150K from 148K. Not surprisingly, job growth in the Manufacturing sector is expected to slow from 16K from 5K. The unemployment rate is expected to remain unchanged at 3.7%, average hourly earnings growth is expected to remain at 0.3%, and average weekly hours are expected to increase to 34.4 from 34.3.
Ahead of the report, we just published our eleven-page preview of the August jobs report. This report contains a ton of analysis related to how the equity market has historically reacted to the monthly jobs report, as well as how secondary employment-related indicators we track looked in August. We also include a breakdown of how the initial reading for August typically comes in relative to expectations and how that ranks versus other months.
For anyone with more than a passing interest in how equities are impacted by economic data, this August employment report preview is a must-read. To see the report, sign up for a monthly Bespoke Premium membership now!