Claims Still Low
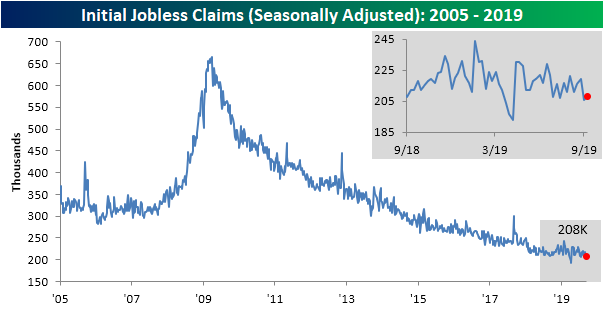
Last week, seasonally adjusted jobless claims saw a large move back below the past several months’ range when the headline reading fell to 204K. This was the lowest print since April when it was at a 50 year low. This week, although still near the lows of the past few months, there was a small uptick to 208K on top of an upward revision of last week’s print (revised to 206K). Despite this increase, this week’s data was still better than expectations as forecasts were calling for a much larger increase to 213K. Also on the bright side, claims have now been at or below 250K and 300K for record streaks of 102 and 237 consecutive weeks, respectively.
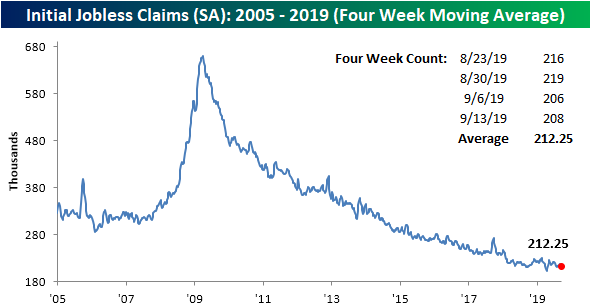
Despite last week’s revision and this week’s higher claims number, the four-week moving average actually ticked down to 212.25K. But it was a tiny decrease of just 0.75K from last week which brings the average to its lowest level since the final week of July when it was at 212K. Given these small fluctuations, the average continues to show minimal improvements as it has been flat in the past year.
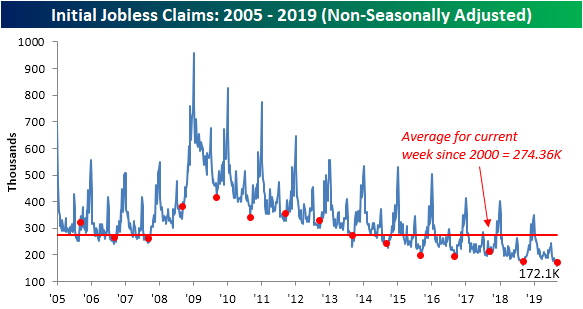
Last week, non-seasonally claims came in at their lowest level since the 1960’s. This week, claims rose from that 160.3K reading up to 172.1K. As a result of seasonal factors, last week likely marked this year’s low for NSA claims. It can be taken as a positive sign, though, that this week’s reading of 172.1K, although higher week-over-week, was down versus the same week last year.
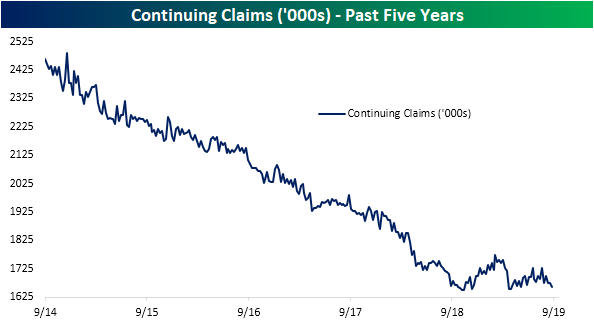
In addition to initial jobless claims showing improvements over the past couple of weeks, so has continuing claims. Falling to 1661K this week, continuing claims are at their lowest levels since April. Much like seasonally adjusted initial jobless claims, continuing claims have finally begun to grind lower after remaining relatively flat, if not sloping upwards, over the past year. Start a two-week free trial to Bespoke Institutional to access our interactive economic indicators monitor and much more.
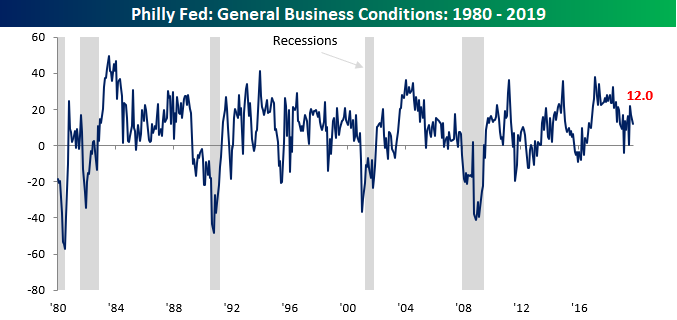
Smaller Than Expected Drop in Philly Fed
Economists were expecting overall sentiment in the September Philadelphia Manufacturing report to decline this month, but the actual drop wasn’t as large as expected. At a level of 12.0, the General Business Conditions index dropped from 16.8 but was better than consensus expectations of 10.5. At current levels, the overall reading of the Philly Fed is pretty much right in the middle of its range from the past few years. Not too hot and not too cold!
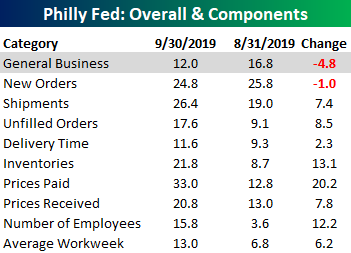
While the headline index of the report showed a modest loss, underneath the surface it was a pretty strong report. The table below shows the m/m change in each of the report’s subcomponents. While the headline index declined 4.8 points, the only other component that was lower on a m/m basis was New Orders as the remaining eight all improved relative to August. The last time we saw such strong breadth was back in March 2016 coming out of the oil-induced slow down, and the only month where breadth in the report was stronger was back in August 2009.
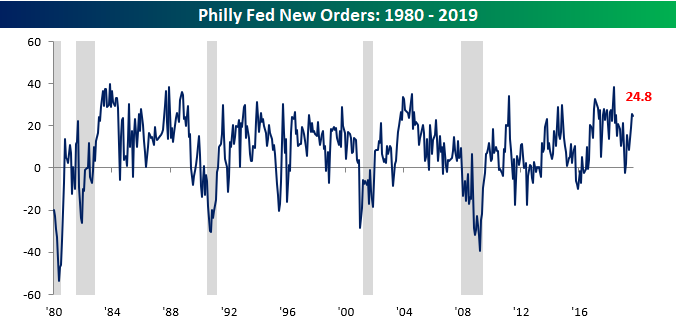
While New Orders was the only sub-component of the Philly Fed report that declined this month, the losses were modest, and the actual level of 24.8 is still relatively strong compared to other readings in the last two years.
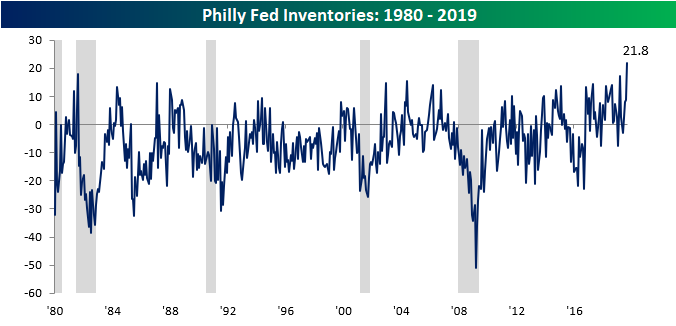
Finally, one component which was very strong this month was Inventories. September’s reading of 21.8 was the highest in the history of the survey (dating back to 1980). Start a two-week free trial to Bespoke Institutional to access all of our market research and interactive tools.
Bespoke’s Morning Lineup – Busy Day of Economic Data
See what’s driving market performance around the world in today’s Morning Lineup. Bespoke’s Morning Lineup is the best way to start your trading day. Read it now by starting a two-week free trial to Bespoke Premium. CLICK HERE to learn more and start your free trial.

The Bespoke 50 Top Growth Stocks
Every Thursday, Bespoke publishes its “Bespoke 50” list of top growth stocks in the Russell 3,000. Our “Bespoke 50” portfolio is made up of the 50 stocks that fit a proprietary growth screen that we created a number of years ago. Since inception in early 2012, the “Bespoke 50” has beaten the S&P 500 by 115.3 percentage points. Through today, the “Bespoke 50” is up 233.9% since inception versus the S&P 500’s gain of 118.6%. Always remember, though, that past performance is no guarantee of future returns. To view our “Bespoke 50” list of top growth stocks, please start a two-week free trial to either Bespoke Premium or Bespoke Institutional.

The Closer – Powell Presser Finally Impresses – 9/18/19
Log-in here if you’re a member with access to the Closer.
Looking for deeper insight on markets? In tonight’s Closer sent to Bespoke Institutional clients, we begin with a rundown of today’s FOMC rate cut and the subsequent market reaction. Next, we review Eurostat harmonized index of consumer prices including the US based series. Then we take a look at Duke University’s CFO survey which showed another weak quarter in terms of economic optimism. We finish tonight’s note with our weekly looks at EIA petroleum data and ICI fund flows.

See today’s post-market Closer and everything else Bespoke publishes by starting a 14-day free trial to Bespoke Institutional today!
When Powell Speaks Traders Sell
As shown in the chart below, average intraday performance across each Fed day during Fed Chair Powell’s tenure has ended in the red. In fact, only two of the prior twelve days have seen the S&P 500 close higher. Since Jerome Powell first became chairman back in March 2018, intraday performance on Fed days has been dominated not necessarily by the results of the FOMC decision, but more so by Fed Chair Powell’s comments in the press conference. Initially, when the FOMC first releases its decision on rates at 2:00 PM EST, the market has actually been higher on the day on average. But when Powell takes the podium at around 2:30 PM ET, traders start selling, and the S&P 500 typically tanks to finish the day negative. Today, the S&P 500 is down ahead of the FOMC decision for the sixth time since Powell took the helm of the FOMC. Each time except for the last time this happened back in June saw a lower close on the S&P. Start a two-week free trial to Bespoke Institutional to access our Fedspeak monitor and much more.

Chart of the Day: FedEx (FDX) Delivers an Earnings Bust
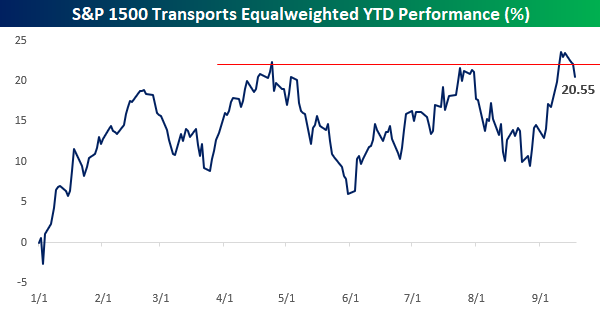
Broader Transports Still Outperforming YTD
With shares of FedEx (FDX) on pace for their second worst earnings reaction day since at least 2001, the Dow Transports, an index in which FDX has a weighting of over 8% (after today’s decline), is down close to 2%. Historically, the Transports have been considered a leading indicator of the economy, so the weakness in FDX, and by extension, the Dow Transports, is resulting in heightened concerns over the state of the economy. Looking at the chart below, the picture for the Transports doesn’t look pretty. The timing of today’s decline couldn’t have been worse as it came just as the Transports were attempting to break above the highs from July, but now it just looks like the second lower high this year. Following today’s declines, the Dow Transports are up 14.7% YTD which is about five percentage points behind the performance of the S&P 500.
![]()
Given the changes in the US economy over time, we’ve been skeptical of the continued predictive ability of the Transports, but even putting that aside for a moment, a broader look at Transports shows a less pessimistic picture. The chart below shows the performance of the stocks in the S&P 1500 index on an equal-weighted basis so far in 2019. By this measure, today’s decline comes after the index made a higher high, and while it’s back below those former highs today, with a gain of 20.5% YTD, this broader look at transports is still outperforming the S&P 500 on a YTD basis. It may not be a great picture for this group of transport stocks, but it doesn’t really look bad either. Start a two-week free trial to Bespoke Institutional for full access to our research and interactive trading tools.
Fixed Income Weekly – 9/18/19
Searching for ways to better understand the fixed income space or looking for actionable ideas in this asset class? Bespoke’s Fixed Income Weekly provides an update on rates and credit every Wednesday. We start off with a fresh piece of analysis driven by what’s in the headlines or driving the market in a given week. We then provide charts of how US Treasury futures and rates are trading, before moving on to a summary of recent fixed income ETF performance, short-term interest rates including money market funds, and a trade idea. We summarize changes and recent developments for a variety of yield curves (UST, bund, Eurodollar, US breakeven inflation and Bespoke’s Global Yield Curve) before finishing with a review of recent UST yield curve changes, spread changes for major credit products and international bonds, and 1 year return profiles for a cross section of the fixed income world.
In this week’s report we continue to discuss the repo market amidst extreme volatility this week.

Our Fixed Income Weekly helps investors stay on top of fixed income markets and gain new perspective on the developments in interest rates. You can sign up for a Bespoke research trial below to see this week’s report and everything else Bespoke publishes free for the next two weeks!
Click here and start a 14-day free trial to Bespoke Institutional to see our newest Fixed Income Weekly now!
B.I.G. Tips – Housing Breaks Out
We’ve just published our recap of the latest stronger than expected Housing Starts and Building Permits reports. If you’d like to see our analysis of the report and what it means for the economy and the stocks of homebuilders, start a two-week free trial to Bespoke Premium. You won’t be disappointed!
