Bespoke 2020 Special
Bespoke Investment Group has been providing investors with clear, actionable analysis since our founding in 2007, and we’re currently working hard on our biggest and most important report of the year — The Bespoke Report 2020 Market Outlook and Investor Toolkit.
It’s not hard to describe the contents of this report because it simply has it all. This report prepares you with everything you need to know for the year ahead, and it’s a must-read for all investors.
How can you gain access to our annual Bespoke Report? It’s easy. Join one of our three membership levels now with our “2020” special offer and the report is included. What is the “2020” special? You’ll get one month of any membership level for just $20, then you’ll get 20% off the regular monthly rate going forward. Join now because this special is only available for a limited time! Choose an option below to sign up now. Click here if you’re looking for more details on what’s included with each membership level.
Bespoke 2020 Special — Bespoke Newsletter
Bespoke 2020 Special — Bespoke Premium
Bespoke 2020 Special — Bespoke Institutional

The Bespoke Report — 10/4/19
This week’s Bespoke Report newsletter is now available for members.
Stocks bounced big late in the week after the details of the Employment Situation Report helped a bid in equities that started Thursday. Big drops in equity markets in response to ISM numbers early in the week were mostly clawed back. So which should matter more, the soft ISM surveys or the hard data on jobs? We give a definitive answer, as well as discussing a range of other economic and market details. To read the Bespoke Report and access everything else Bespoke’s research platform has to offer, start a two-week free trial to one of our three membership levels. You won’t be disappointed!

The Closer: End of Week Charts — 10/4/19
Looking for deeper insight on global markets and economics? In tonight’s Closer sent to Bespoke clients, we recap weekly price action in major asset classes, update economic surprise index data for major economies, chart the weekly Commitment of Traders report from the CFTC, and provide our normal nightly update on ETF performance, volume and price movers, and the Bespoke Market Timing Model. We also take a look at the trend in various developed market FX markets.

The Closer is one of our most popular reports, and you can sign up for a free trial below to see it!
See tonight’s Closer by starting a two-week free trial to Bespoke Institutional now!
Next Week’s Economic Indicators – 10/4/19
All-in-all, it was a pretty mixed week for economic data, specifically manufacturing and labor data. While Markit’s gauge on manufacturing was slightly stronger than both expectations and the August print, ISM’s version disappointed with little in the way of bright spots among its components. Hard data, on the other hand, is showing a bit of a different picture as Durable Goods appear healthy with the fastest 3m/3m growth rate since last November as we discussed in Thursday’s Closer. The Markit Services PMI and ISM’s Non-Manufacturing Index were also split with Markit’s reading holding steady as ISM disappointed once again. Employment data was the other major focus of the week with similar disappointments, but some silver linings. Ahead of Friday’s Nonfarm Payrolls Report, ISM’s Employment components for both the Manufacturing and Services sectors further weakened in September while this week’s initial jobless claims rose slightly more than expected (although continuing claims fell again). ADP’s reading on employment also fell more than expected. The NFP report followed suit showing fewer jobs added in September, but new lows in the unemployment rate and underemployment rate added to the case of continued labor market strength.

Economic data takes a bit of a breather next week with only two-thirds as many releases this week. Consumer credit is first up on the docket and is expected to moderate to $15 billion after a very strong print last time around. On Tuesday, we will get confidence numbers out of the small business world. NFIB’s Small Business Optimism is forecasted to fall to 102.5 from 103.1 in August. PPI is also out that morning, although no change is expected for both the headline and core numbers. CPI data is due to be released later in the week on Thursday and likewise, no change is expected. Further in inflation data, on Friday, import and export price indices are also scheduled to be released. In labor data, the Job Openings and Labor Turnover Survey (JOLTS) will come out on Wednesday followed by weekly claims numbers the following day. After rising to 219K this week, claims are expected to improve to 217K. Finally, Friday’s preliminary University of Michigan Sentiment for October will round out the week. It is expected to fall to 92.0 after last month’s rebound up to 93.2. Start a two-week free trial to Bespoke Institutional to access our interactive economic indicators monitor and much more.

Contrarian Takeaways From Our Monthly Consumer Pulse Survey
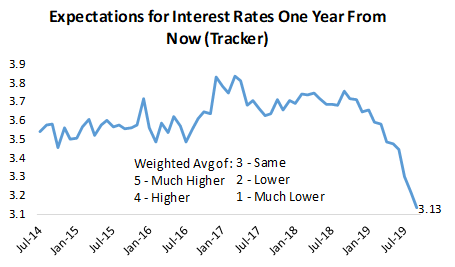
Each month Bespoke runs a comprehensive survey on the US consumer, giving us proprietary insights in nearly real-time to the major driver of the US economy. We ask dozens and dozens of questions related to every area of the economy, and we also ask about feelings towards financial markets. One of the questions we ask survey participants is where they think interest rates will be one year from now. Below is a chart showing the monthly reading for this question over the last five years.
When the line is falling, it means consumers expect interest rates to be lower, while a rising line means consumers think interest rates will be higher. As shown, expectations have fallen off a cliff this year as actual interest rates have collapsed, meaning consumers basically just look at what’s been happening and extrapolate it into the future. This is a bad sign for bonds, which fall when interest rates rise and vice versa, in our view. Whenever the masses get so one-sided, it’s usually a sign that a trend reversal is near. Start a two-week free trial to Bespoke Institutional for full access to our research and market analysis. To receive our survey analysis every month, you’ll need to purchase our Consumer Pulse add-on.
The Fall of the Mall
Bespoke’s Consumer Pulse Report is an analysis of a huge consumer survey that we’ve been running each month since 2014. Our goal with this survey is to track trends across the economic and financial landscape in the US. Using the results from our proprietary monthly survey, we dissect and analyze all of the data and publish the Consumer Pulse Report, which we sell access to on a subscription basis. Sign up for a 30-day free trial to our Bespoke Consumer Pulse subscription service. With a trial, you’ll get coverage of consumer electronics, social media, streaming media, retail, autos, and much more. The report also has numerous proprietary US economic data points that are extremely timely and useful for investors.
We’ve just released our most recent monthly report to Pulse subscribers, and it’s definitely worth the read if you’re curious about the health of the consumer in the current market environment. Start a 30-day free trial for a full breakdown of all of our proprietary Pulse economic indicators.
You don’t need the Consumer Pulse Report to tell you that it has been a difficult few years for traditional brick and mortar retailers, especially for department stores. Just this morning, the September Non-Farm Payrolls report showed that the retail sector shed 11,400 jobs in September and has lost a total of 197K jobs since the sector’s peak reading in January 2017. With things being so bad for the sector for so long, though, there seems to be an increasing number of investors who think that the sector is due for a rebound, but based on the latest data from our Pulse report, it doesn’t look like things are showing any sign of improvement. In fact, trends may actually be getting worse.
The chart below is from a question that asks respondents which department stores they have visited over the last month or whether they haven’t visited any of them at all. In this month’s survey, a record 55.4% of respondents said they didn’t visit any of the department stores listed, while the percentage of consumers visiting each individual department store is at or near record lows. There was a time in the not so distant past where the seven stores listed were the first store shoppers thought of when they were planning to shop, but today they don’t even come to mind.
You can see in the chart that the seasonal holiday shopping period has been getting worse and worse for department stores as well. In 2015 and 2016, we saw huge dips in the “None of the above” reading in December, meaning lots of department stores saw a pick-up in visits. In 2017 and 2018, though, the dips for “None of the above” were much smaller.
What’s it going to take to get consumers back to stores? That’s the question every brick and mortar retailer has been trying to answer for the last few years along with how to maximize sales online. Providing a better “experience” for in-store shoppers has been the major focus, but experience can only take you so far.

Bespoke’s Morning Lineup – 10/4/19
See what’s driving market performance around the world in today’s Morning Lineup. Bespoke’s Morning Lineup is the best way to start your trading day. Read it now by starting a two-week free trial to Bespoke Premium. CLICK HERE to learn more and start your free trial.

The Closer – Range Bottoms, Bull Steepener, Big Reversals, And Manufacturing – 10/3/19
Log-in here if you’re a member with access to the Closer.
Looking for deeper insight on markets? In tonight’s Closer sent to Bespoke Institutional clients, as equities found technical support today, we show the bull steepening of the curve and what it means in regards to policy. Next, we show other times that the S&P 500 experienced big intraday reversals as it did today. We finish with a look at today’s manufacturing data including durable and capital goods as well as consumer confidence and spending data.

See today’s post-market Closer and everything else Bespoke publishes by starting a 14-day free trial to Bespoke Institutional today!
The Bespoke 50 Top Growth Stocks — 10/3/19
Every Thursday, Bespoke publishes its “Bespoke 50” list of top growth stocks in the Russell 3,000. Our “Bespoke 50” portfolio is made up of the 50 stocks that fit a proprietary growth screen that we created a number of years ago. Since inception in early 2012, the “Bespoke 50” has beaten the S&P 500 by 107.9 percentage points. Through today, the “Bespoke 50” is up 218.3% since inception versus the S&P 500’s gain of 110.4%. Always remember, though, that past performance is no guarantee of future returns. To view our “Bespoke 50” list of top growth stocks, please start a two-week free trial to either Bespoke Premium or Bespoke Institutional.
