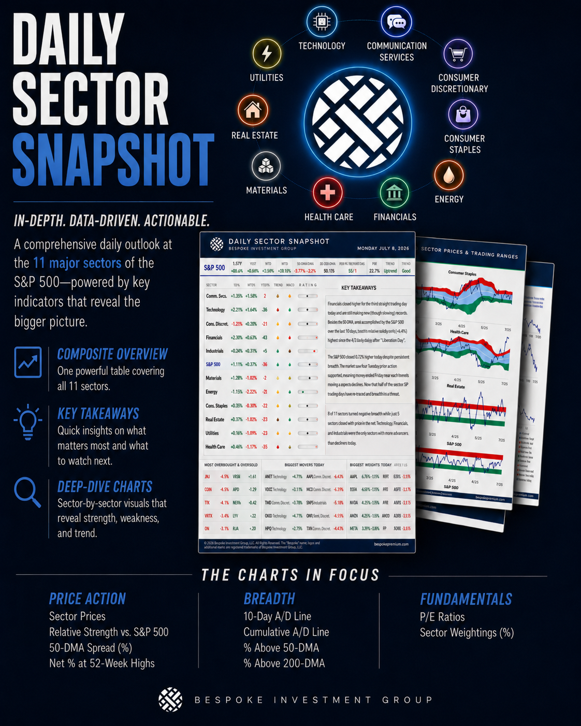
Daily Sector Snapshot — 7/24/26
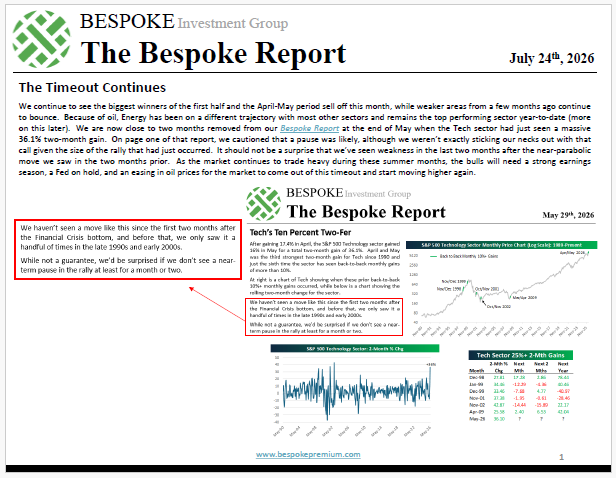
The Bespoke Report – The Timeout Continues – 7/24/26
To read our weekly Bespoke Report newsletter and access everything else Bespoke’s research platform offers, choose one of our three member plans today!
This week’s report covers the ongoing collapse in the AI trade and growing concerns that rising oil and interest rates will derail the bull market. Give it a read!

Figuring Out The Fed
Keeping track of the Fed can be a complicated business. In addition to official releases from the Board of Governors (including policy statements, press releases, meeting minutes, and materials like the twice-quarterly Beige Book), there is also a never-ending parade of appearances in Congress, speeches, and media hits to digest.
One way we stay on top of this mountain of verbiage is natural language processing. For FOMC statements, press conferences, minutes, the Beige Book, and published FOMC speeches, we apply a series of algorithms to compare them to previous commentary over time. This lets us assess how the language scans on a hawk/dove scale. Hawks are central bankers worried about inflation, sanguine or optimistic on growth and unemployment, and generally biased towards raising rates or otherwise tightening policy. Doves are the opposite.
Our algorithms have several different approaches. Two use dictionary-based approaches from papers by Loughran-McDonald and Schmeling & Wagner to look for language that is associated with either hawkishness or dovishness. The Loughran-McDonald algorithm also scores speeches for attitudes on inflation and growth. Another approach is to compare speeches to language from periods when the Fed was hiking rates via a logistic regression, or compare them to periods when the market reacted aggressively to Fed policy (again via a logistic regression). Those two approaches based on rate cycles or market data can also look forward (i.e. regress against the next outcome rather than the current one). In total, we have 8 different methods to score Fed communications, which we can then compare to either similar communications (for instance, comparing a policy statement to other policy statements) or the whole corpus of Fed communications.
Last Monday, July 13, we got a very good example of how these algorithms work. Governor Waller gave a speech (link) that revealed a very hawkish bias. To illustrate that hawkishness, below we show a series of scores for the speech. The higher a score, the more hawkish the speech is perceived to be. As shown, while our rate cycle logistic regression didn’t see Waller’s comments as very hawkish, our market reaction-based regression did. And dictionary-based regressions were right at the top of the charts.
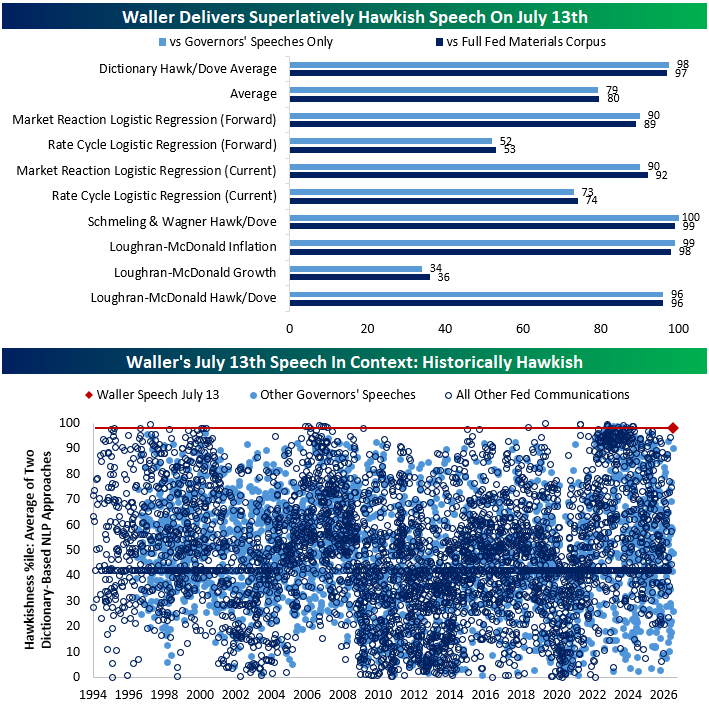
The second chart above illustrates how hawkish the speech was. To create it, we took all Fed communications since 1994 and scored each one, showing the average hawkish/dovish percentile score for our two dictionary-based measures. As shown, there are only a few speeches in Fed history that were more hawkish than Waller’s comments two Mondays ago. That’s a strong signal that Waller – and given his position as a leading voice that tends to move before the rest of the FOMC – will be ready to raise rates soon, an outcome that felt unthinkable at the start of the year.
Interested in keeping track of what the Fed is saying and how it relates to and influences markets and economic data? Start a free All Access trial to receive our Morning Lineup and The Closer reports which will keep you informed when a big speech lands…as well as all the implications going forward.

The Tumble of Two Sectors
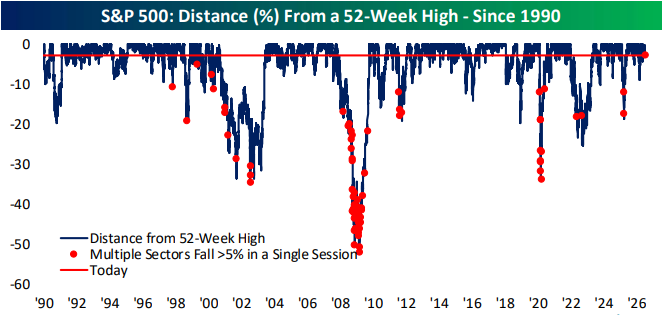
The S&P 500 fell 1.21% yesterday. While that’s not an ideal day for investors, there have been 15 days this year that were worse. More unusual than the decline at the index level were the 5%+ declines in Communication Services and Consumer Discretionary following negative earnings reactions from Alphabet (GOOGL) and Tesla (TSLA), respectively. The two stocks were the largest drags on the index for the day.
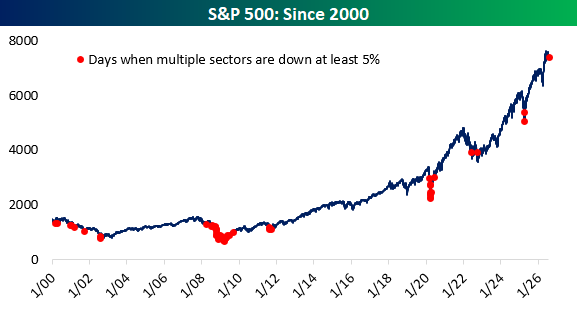
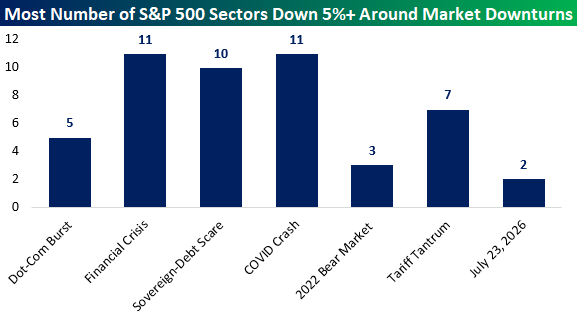
This was the first time this year that multiple sectors fell at least 5% in a single session. It happened twice during last year’s Tariff Tantrum on April 3 and April 4, twice during the 2022 bear market, and ten times around the COVID Crash in 2020. Before that, there were four such days during the 2011 sovereign debt scare, 43 during the Financial Crisis in 2008 and 2009, and nine following the bursting of the Dot-Com Bubble from 2000 through 2002. Outside of those major market downturns and yesterday, it hasn’t happened at all since the turn of the century.
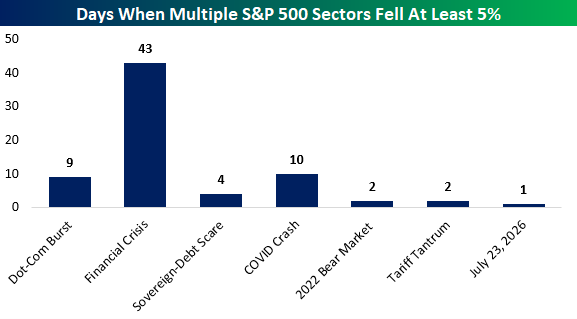
On the bright side, assuming no further deterioration in the current market, only two sectors fell more than 5% yesterday, which pales in comparison to past market downturns. As the chart below shows, there were days when all eleven S&P 500 sectors shed at least 5% on the worst days of the Financial Crisis and Covid Crash, and ten during the sovereign debt scare in 2011.
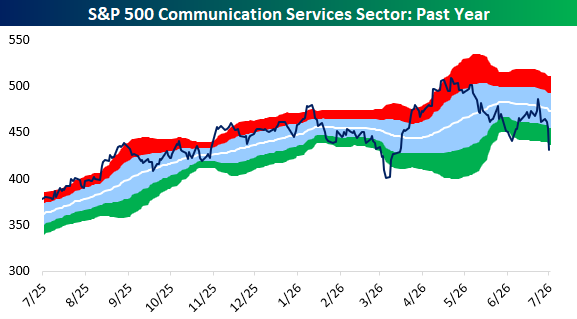
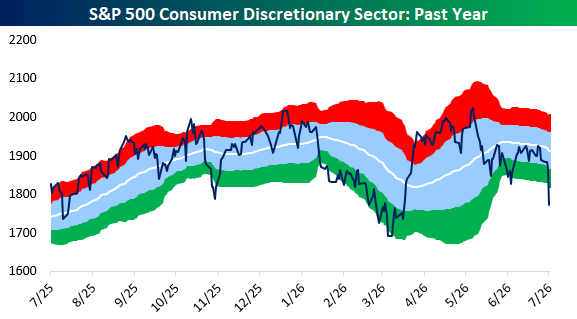
Below are one-year charts of Communication Services and Consumer Discretionary. Yesterday’s declines pushed both sectors well into extremely oversold territory. Communication Services finished 2.27 standard deviations below its 50-DMA, while Consumer Discretionary fell to 2.95 standard deviations below its 50-DMA, knocking on the door of three full standard deviations.
You can find more sector research like this in Bespoke’s Daily Sector Snapshot.
Read about Bespoke’s premium membership options to find out how to receive our Sector Snapshot in your inbox daily.
K-Pop and K-Drop
South Korea is the world’s 15th-largest economy, but its stock market increasingly looks more representative of a meme stock than a developed economy.
Just think about these various performance figures. Since the end of Q1, the iShares MSCI South Korea ETF (EWY) is up 34%. From its high on June 18th, just over a month ago, EWY is down more than 25%. Despite that decline, though, the ETF is still more than 21% above its 200-DMA, as well as comfortably above its uptrend line that has been in place since late last year.
How you judge the performance of South Korean stocks depends entirely on your time horizon, and a difference of just a few weeks will dramatically alter how performance looks.
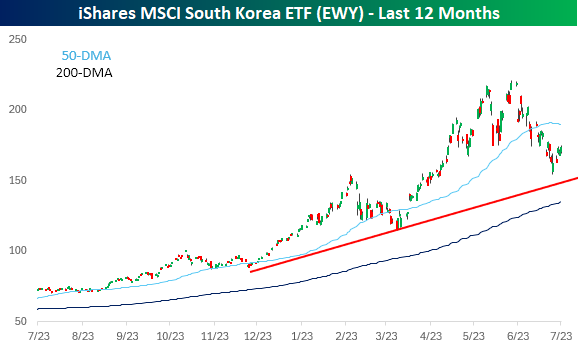
The wide disparity in performance numbers based on differences of just a few weeks is a consequence of massive volatility. As noted in today’s Morning Lineup, 5% daily moves in the KOSPI used to be a notable event, but these days, they’re a normal occurrence. So far this year, EWY has already had 31 daily moves of +/-5%. Since 2001, the only other year that saw more moves of that magnitude was 2008, with 43. This year trails that total by just 12, and there are still more than five months left this year!
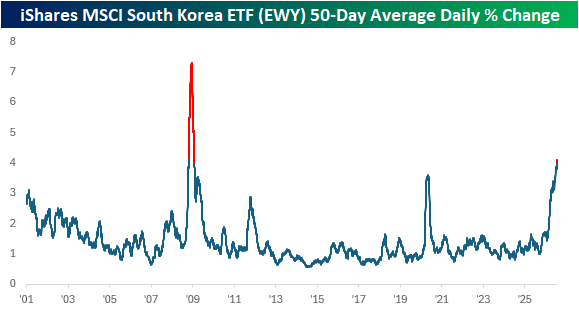
With the increased frequency of large daily moves, EWY’s average daily change over the last 50 days has moved above 4%. Since the start of 2001, the only other time that average was at similar or higher levels was in the heart of the Financial Crisis during 67 days from October 2008 through January 2009.
For people who were in the market at that time, it was widely considered one of the most volatile periods in market history. We’re still a ways from that peak level of volatility in the Financial Crisis, but for South Korea, BTS, as in Big Time Swings, is all the rage.
Want more from Bespoke? You can start by joining our Think BIG mailing list where you’ll receive an interesting market stat in your inbox a few times per week. All we need is your email address. Join now by clicking here or on the image below.

Bespoke’s Morning Lineup – 7/24/26 – Going Out on a Positive Note
See what’s driving market performance around the world in today’s Morning Lineup. Bespoke’s Morning Lineup is the best way to start your trading day. Read it now by starting a two-week trial to Bespoke Premium. CLICK HERE to learn more and start your trial.
“The most difficult thing is the decision to act, the rest is merely tenacity.” – Amelia Earhart

Below is a snippet of commentary from today’s Morning Lineup. Start a two-week trial to Bespoke Premium to view the full report.
Futures are looking to close out a negative week on a high note. S&P 500 futures are up 0.3% while the Nasdaq is on pace for a slightly smaller gain of 0.25%. Lower oil prices have provided a boost, with WTI trading below $90. The weakness in oil also has treasury yields pulling back slightly. Gold is fractionally higher, while Bitcoin trades modestly higher at just above $65K.
In Asia, stocks were lower across the board, taking most indices in the region into the red for the week. South Korea’s KOSPI fell 5.7%, pushing its weekly performance into the red with a decline of nearly 2%. There was a time when a 5% move in the KOSPI made headlines, but that’s almost become the norm lately. In economic news, the biggest headline out of Asia was Japan’s June CPI, which rose 0.3% versus forecasts of 0.4%.
European stocks have ignored the overnight weakness in Asia, as they move higher across the board. The STOXX 600 is up 0.4%, led higher by Germany (0.9%) and Spain (0.8%). Flash PMI readings for July have generally been stronger than expected, and Retail Sales in the UK surprised to the upside.
In the US today, we’ll get our own round of flash PMIs for the manufacturing and services sectors at 9:45, and then we’ll close the data week with New Home Sales at 10 AM.
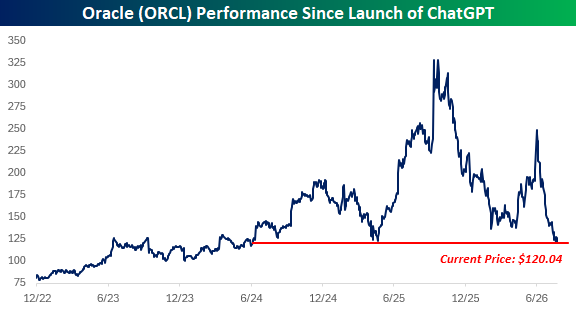
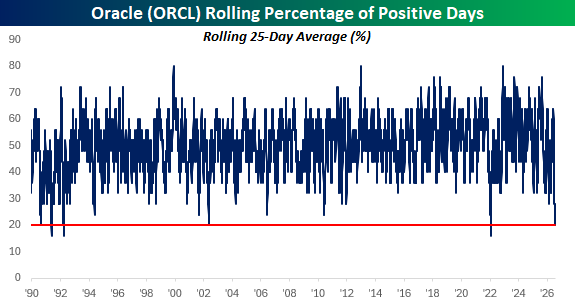
As investors come to question how the future direction of the AI trade will play out, shares of Oracle (ORCL) have recently found themselves out in the cold after a period of being right in the middle of the cool kid club. The stock consistently rallied in the first two years of the bull market after the launch of ChatGPT. Around a year ago, though, the stock’s rally went into overdrive with shares more than doubling on strong earnings and announcing several high-profile cloud computing deals, including a massive one with OpenAI. Last September, the company announced that it had secured signed contracts totaling more than $450 billion.
As fast as the stock rallied, though, it gave up those gains nearly as quickly as the company has embarked on enormous amounts of cap ex to build the infrastructure necessary to fulfill its outstanding contracts. That has sucked up all the company’s cash flow and forced ORCL to take on enormous amounts of debt. If ORCL’s contracts are honored, the short-term pickup in cap ex should pay off, but a lot of that depends on OpenAI, of which the company has $300 billion in outstanding contracts. In some respects, ORCL has become a call option on OpenAI.
A look at a one-year chart of ORCL shows the recent weakness in more detail. The stock has lost more than half of its value relative to its highs from a year ago, and even after bouncing in the spring, it is down sharply since the start of June. At yesterday’s close of just over $120, shares were trading at a relatively important support level.
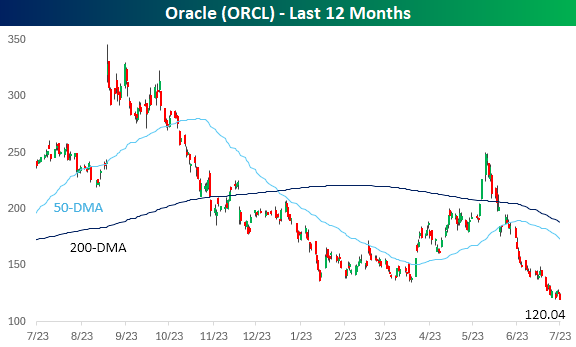
Since that June high, ORCL’s persistence of declines has reached some historic proportions. On a rolling five-week (25 trading days) basis, the stock was recently positive on only 20% of trading days. In other words, it declined on 20 of the prior 25 days. Since 1990, it has only reached that level of consistency to the downside in a handful of periods, with the most recent being back in early 2022.
Start a two-week trial to Bespoke Premium to continue reading today’s full Morning Lineup.
The Closer – Hawkish Hold, 5% Declines, Thematics – 7/23/26
Log-in here if you’re a member with access to the Closer.
- This morning, the ECB left rates on hold but some of the language of the communications had hints of hawkishness.
- Initial jobless claims dropped sharply to the lowest print since 1969, although there is evidence that it may have been a seasonal mirage.
- For only the 75th time on record, multiple sectors fell at least 5% in the same session. Of those prior instances, that has never happened with the S&P trading so close to a high.
See today’s full post-market Closer and everything else Bespoke publishes by starting a 14-day trial to Bespoke Institutional today!
Q2 2026 Earnings Conference Call Recaps: Union Pacific (UNP)
Bespoke’s Conference Call Recaps use AI to summarize lengthy earnings calls. The commentary below is AI-generated and then edited by Bespoke for quality control. As always, none of these summaries should be construed as recommendations to buy or sell any securities, and investors should do their own research and/or consult with a financial professional before making any investment decisions.
Our latest recap available to Bespoke subscribers covers Union Pacific’s (UNP) Q2 2026 earnings call.
![]()
Union Pacific (UNP) is America’s largest freight railroad, connecting 23 western states and roughly 7,300 communities. It transports intermodal containers and commodities including grain, chemicals, metals, coal, and automobiles, while its proposed Norfolk Southern merger would create a 50,000-mile transcontinental network. Union Pacific handled 2% more volume while setting records for freight-car velocity, workforce productivity, and train length. Adjusted EPS rose 13% to $3.41. Domestic intermodal posted a fourth consecutive record quarter as constrained truck capacity and reliable service drove conversions and supported higher pricing. Export grain, renewable fuels, petrochemicals, and steel remained strong, while coal, housing, and automotive demand were softer. Diesel above $4 per gallon remains the largest cost and consumer-demand risk. Management also expressed confidence in the Norfolk Southern merger following STB acceptance and a CN agreement that expands customer access while addressing competitive concerns. Shares rose 4.1% on 7/23 after the EPS and revenue beats…
Continue reading our Conference Call Recap for UNP by becoming a Bespoke Institutional subscriber. You can sign up for Bespoke Institutional now and receive a 14-day trial to read our newest Conference Call Recap. To sign up, choose either the monthly or annual checkout link below:
Q2 2026 Earnings Conference Call Recaps: Tractor Supply (TSCO)
Bespoke’s Conference Call Recaps use AI to summarize lengthy earnings calls. The commentary below is AI-generated and then edited by Bespoke for quality control. As always, none of these summaries should be construed as recommendations to buy or sell any securities, and investors should do their own research and/or consult with a financial professional before making any investment decisions.
Our latest recap available to Bespoke subscribers covers Tractor Supply’s (TSCO) Q2 2026 earnings call.
![]()
Tractor Supply (TSCO) is the largest US rural-lifestyle retailer, selling animal feed, pet products, tools, hardware, workwear, lawn equipment, and other essentials through more than 2,300 Tractor Supply stores, Petsense locations, and digital channels. Its needs-based business remains durable, but weaker farm and ranch conditions, slow pet-industry growth, low housing turnover, and cautious discretionary spending are limiting sales. Second-quarter comparable sales fell 1.5% after elevated fuel prices and southeastern drought disrupted May, historically the company’s largest selling month. May weakness in big-ticket and hardline spring products reduced the quarterly comp by roughly two percentage points, although consumables remained positive and June’s seasonal improvement continued into July. Tractor Supply lowered its 2026 outlook and withdrew its long-term targets as base-business pressure outweighed benefits from strategic initiatives. Management is responding with sharper pricing, localized pet assortments, Freshpet expansion, and VIP Petcare’s network of 2,500 veterinarians. It will also close 75 cash-flow-negative Petsense stores, slow 2027 store openings, and redirect capital toward Fusion remodels and Final Mile delivery, which completed as many orders during the first half as in all of 2025. Despite reporting weaker-than-expected results, TSCO shares managed to close 3.3% higher on 7/23…
Continue reading our Conference Call Recap for TSCO by becoming a Bespoke Institutional subscriber. You can sign up for Bespoke Institutional now and receive a 14-day trial to read our newest Conference Call Recap. To sign up, choose either the monthly or annual checkout link below:
Q2 2026 Earnings Conference Call Recaps: Tesla (TSLA)
Bespoke’s Conference Call Recaps use AI to summarize lengthy earnings calls. The commentary below is AI-generated and then edited by Bespoke for quality control. As always, none of these summaries should be construed as recommendations to buy or sell any securities, and investors should do their own research and/or consult with a financial professional before making any investment decisions.
Our latest recap available to Bespoke subscribers covers Tesla’s (TSLA) Q2 2026 earnings call.
![]()
Tesla (TSLA) makes electric vehicles, led by the Model 3, Model Y, and Cybertruck. The millions of Teslas already on the road give the company a large pool of potential FSD subscribers while generating driving data that helps train its Robotaxi technology. Tesla is also spending heavily to build Optimus robots, its own AI chips, and power infrastructure for AI data centers, opening new opportunities beyond autos but weighing on cash flow as production expands. Tesla reported record Q2 deliveries and its largest order backlog since 2023, with FSD enabled on 55% of North American deliveries and nearly 1.5 million paid customers globally. Robotaxi surpassed 380,000 unsupervised miles across six cities with no notable incidents, but expansion remains gated by reliability, Cybercab driving data, and state regulation. Tesla expects more than $25 billion of 2026 CapEx for Cybercab, Optimus, AI chips, solar, and batteries. Management expects AI data centers to become a major Megapack market because batteries can smooth abrupt power swings during training runs. TSLA beat on the top line while coming in weaker on EPS, as shares fell more than 14% on 7/23…
Continue reading our Conference Call Recap for TSLA by becoming a Bespoke Institutional subscriber. You can sign up for Bespoke Institutional now and receive a 14-day trial to read our newest Conference Call Recap. To sign up, choose either the monthly or annual checkout link below: