Chart of the Day: Miserable Housing Starts
Fixed Income Weekly – 7/18/18
Searching for ways to better understand the fixed income space or looking for actionable ideals in this asset class? Bespoke’s Fixed Income Weekly provides an update on rates and credit every Wednesday. We start off with a fresh piece of analysis driven by what’s in the headlines or driving the market in a given week. We then provide charts of how US Treasury futures and rates are trading, before moving on to a summary of recent fixed income ETF performance, short-term interest rates including money market funds, and a trade idea. We summarize changes and recent developments for a variety of yield curves (UST, bund, Eurodollar, US breakeven inflation and Bespoke’s Global Yield Curve) before finishing with a review of recent UST yield curve changes, spread changes for major credit products and international bonds, and 1 year return profiles for a cross section of the fixed income world.
Today we look further into the flattening of the yield curve.

Our Fixed Income Weekly helps investors stay on top of fixed income markets and gain new perspective on the developments in interest rates. You can sign up for a Bespoke research trial below to see this week’s report and everything else Bespoke publishes free for the next two weeks!
Click here and start a 14-day free trial to Bespoke Institutional to see our newest Fixed Income Weekly now!
Bespoke’s Global Macro Dashboard — 7/18/18
Bespoke’s Global Macro Dashboard is a high-level summary of 22 major economies from around the world. For each country, we provide charts of local equity market prices, relative performance versus global equities, price to earnings ratios, dividend yields, economic growth, unemployment, retail sales and industrial production growth, inflation, money supply, spot FX performance versus the dollar, policy rate, and ten year local government bond yield interest rates. The report is intended as a tool for both reference and idea generation. It’s clients’ first stop for basic background info on how a given economy is performing, and what issues are driving the narrative for that economy. The dashboard helps you get up to speed on and keep track of the basics for the most important economies around the world, informing starting points for further research and risk management. It’s published weekly every Wednesday at the Bespoke Institutional membership level.
You can access our Global Macro Dashboard by starting a 14-day free trial to Bespoke Institutional now!

The Closer — Small Caps, Netflix, IP, API — 7/17/18
Log-in here if you’re a member with access to the Closer.
Looking for deeper insight on markets? In tonight’s Closer sent to Bespoke Institutional clients, review the downturn in small cap relative performance, recent credit performance and fundamentals for tech high flyer Netflix, monthly industrial production numbers from the Federal Reserve, and a few miscellaneous data points.

See today’s post-market Closer and everything else Bespoke publishes by starting a 14-day free trial to Bespoke Institutional today!
Nasdaq Equal Weight Index on Pace for a Record High Close
OK, everyone knows that the big mega-cap stocks have been doing most of the heavy lifting with respect to stock market returns of late, but one thing we continue to stress is that just because the big stocks are doing really well doesn’t mean that the rest of the market is in the tank. The most recent example? Just today, the Nasdaq 100 Equal Weight index is poised to close at an all-time high after rallying more than 1% off its early lows. While the index still hasn’t taken out its intraday all-time high, it’s basically right there.
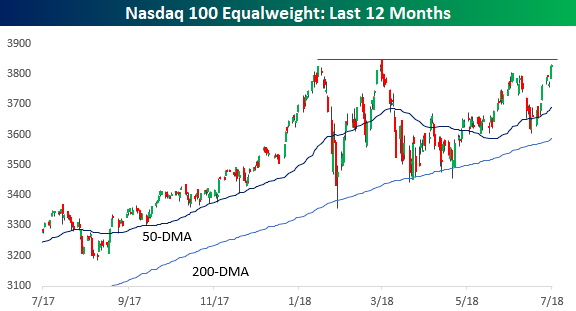
Again, we aren’t denying the fact that the cap-weighted Nasdaq 100, which has been driven by the FANG and other large-cap tech stocks has been outperforming. In the six-month window that the Nasdaq 100 Equal Weight index has been range-bound, the cap-weighted index has been making a routine out of hitting new highs.
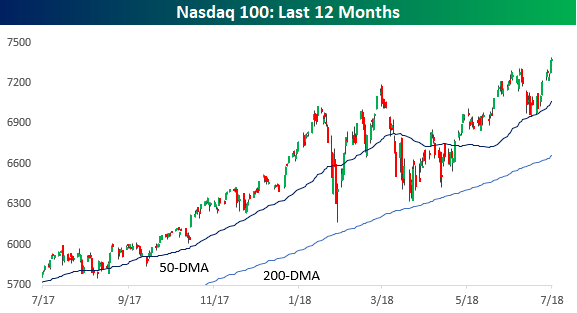
Comparing the performance of the two indices, the Nasdaq 100 is up just over 30% over the last year, but the Nasdaq 100 Equal Weight has been no slouch either, rallying almost 19%, which is better than the Dow, S&P 500, or even Russell 2000.

Chart of the Day: LLY Long For Earnings
3-Month Seasonal Headwind for S&P 500
Our Stock Seasonality Tool is one of many interactive features that are part of our premium membership services. The tool allows users to perform a limitless amount of searches for seasonality trends surrounding US and global indices, ETFs, and individual stocks.
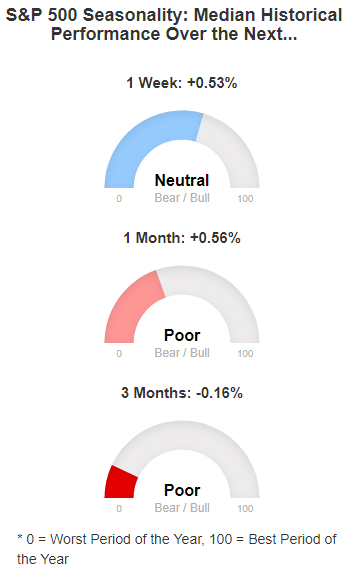
One part of the tool simply shows how the S&P 500 has historically performed over the next week, month, and three months from whatever the date is when you open the tool. When we opened the tool today, we noticed that seasonality trends for the next month and three months are pretty dreadful.
Below is a snapshot of the tool from today showing the S&P 500’s median performance over the next week, month, and three months using the last 10 years as our data set (with July 17th close as the starting point).
As shown, the S&P has seen a median gain of 0.56% over the next month, which is actually relatively weak compared to all other one-month periods throughout the calendar year.
The three-month median change is where things look really weak for the stock market. Over the last 10 years, the S&P 500 has seen a median decline of 0.16% during the three-month period from July 17th through October 17th.
Seasonals are definitely not working in the market’s favor in the near term.
Start a two-week free trial to Bespoke Premium to unlock access to our popular Stock Seasonality Tool.
Gas Prices Following the Seasonal Trend
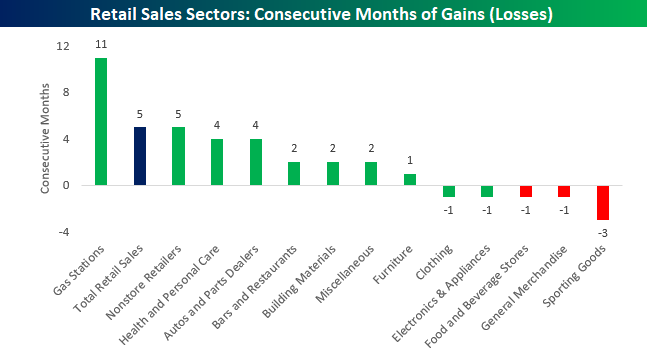
With prices in many areas of the country well over $3 per gallon, gas prices are a topic we’ve heard a lot of complaining about recently. There’s absolutely no denying the fact that prices have been on the rise. One has to look no further than Monday’s Retail Sales report for June which showed that sales at gas stations rose for their record 11th straight month. While sales at Gas Stations have risen for nearly a year straight, no other category, not even online, has seen more than five consecutive months of sales gains.
So will sales at Gas Stations see the current streak of sales gains reach a full year? Based on seasonal trends, it’s going to be tough. The chart below compares the changes in gas prices so far this year to the average “intra-year” pattern going back to 2005. So far in 2018, the pattern of prices has been tracking the average pretty closely, and if that continues to be the case, it would suggest that prices would continue to drift lower or in a sideways range for the rest of the summer, and then steadily slump from Labor Day through year-end.

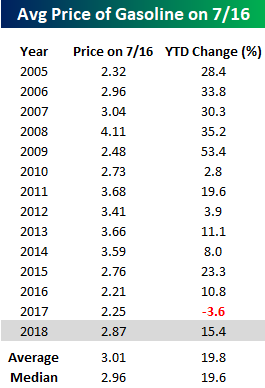
Another way to look at gas prices this year is to compare current levels and the YTD change to where prices were in prior years. As of Monday, the national average price of a gallon of gas was $2.87. While that is higher than where prices were on 7/16 in 2015, 2016, and 2017, the average price of a gallon of gas on 7/16 since 2005 is just over $3, and the median is $2.96. Finally, in terms of the YTD change, this year’s increase of 15.4% is more than four percentage points below the average and median change for all years since 2005.
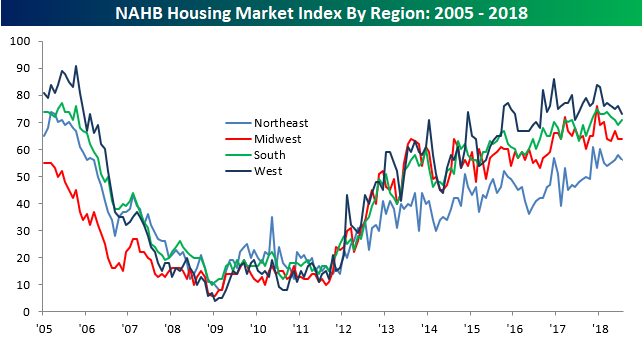
Little Change in Homebuilder Sentiment
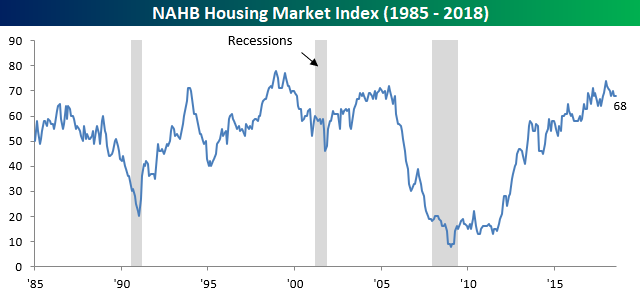
The NAHB Homebuilder Sentiment index was just released earlier and was unchanged from last month, coming in at a level of 68 compared to expectations of 69.
Looking at the break down of this month’s report, there wasn’t much in the way of major moves. The biggest swing was a three-point decline in sentiment for homebuilders in the West.
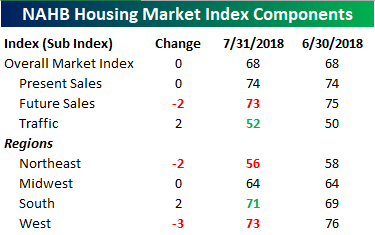
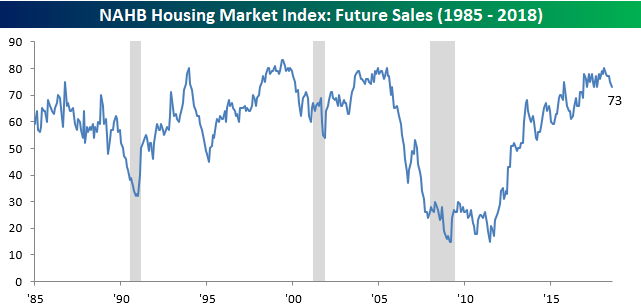
One chart we wanted to highlight was Future Sales, which fell two points. A two-point m/m move is not really anything to get excited about, but it is now back down to its lowest level since the 2016 election.
On a regional basis, sentiment is basically following the national trend where sentiment peaked towards the end of 2017 and has been drifting lower ever since.
The Closer — Empire Wobbles, Brazil Stumbles, Small Cap Losses — 7/16/18
Log-in here if you’re a member with access to the Closer.
Looking for deeper insight on markets? In tonight’s Closer sent to Bespoke Institutional clients, we take a look at today’s Empire Manufacturing data, Brazilian growth, and the current distribution of loss-making firms in the small cap universe.
See today’s post-market Closer and everything else Bespoke publishes by starting a 14-day free trial to Bespoke Institutional today!