Market Pricing Of August 1 Tariff Implementation
Looking to keep track of global markets and cross-asset price action? Every morning in The Morning Lineup we provide commentary on developments since the prior US close, covering major macro catalysts, geopolitics, economic data, local market price action, earnings, and more. This morning we talked about the implicit market pricing of odds that the latest round of tariff announcements will be implemented on August 1. An excerpt from this morning’s note is below. The Morning Lineup is included in our Premium subscription tier. Sign up for a complimentary trial now!
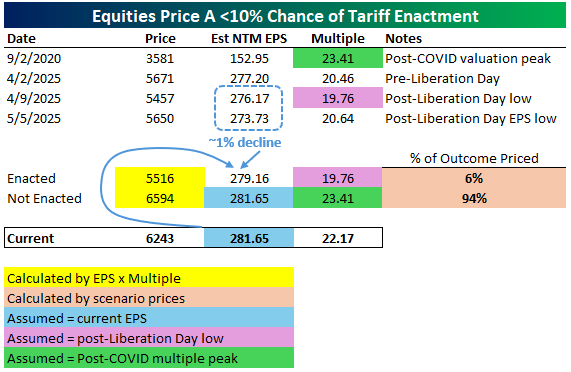
US equity index futures legged lower in the wake of the 35% Canada tariff and 15-20% universal tariff but only by about 75 bps. They then gained back more than half of that selloff before falling again as Europe started trading to hit session lows down 84 bps versus the pre-headline level. Regardless of that small selloff, markets are clearly not pricing much in the way of risk premium that these tariffs actually go into effect. To estimate how much exactly is being priced, we can use S&P 500 EPS estimates, multiples, and prices to create a couple of scenarios and see how those relate to current prices.
We assume two scenarios: one where recent announcements are enacted into law as paid tariffs, and one where they are not. Since the recent wave of announcements is generally in-line with Liberation Day levels (and in some cases like Brazil is significantly worse), we assume that the post-Liberation Day valuation low is the correct multiple for that scenario. We also assume that the forward EPS multiple that number is based on would fall roughly 1% (which is what happened to forward EPS estimates in the wake of the Liberation Day announcement). Taken together, the 19.76x forward multiple and 1% decline in EPS estimates versus current gets to a 5516 level for the S&P 500.
In our second scenario, we assume current forward EPS are valued at the same multiple as the post-COVID valuation peak (23.41x versus 22.17x current). That implies a 6594 S&P 500 price. Given the market currently trades around 6240, we can back out how each scenario is priced in probability terms. As shown below, current market prices imply a 94% chance of no enactment for the current wave of tariffs. Of course, we are making a number of assumptions in this analysis, but we think they’re defensible. The key takeaway here is that the market is pricing very low odds of full enactment for the current wave of tariffs. At the very least, that creates asymmetry to the downside as far as payoff goes. That is one reason we advocated a relatively cheap hedging strategy in The Closer last night (link).

Dollar Rally Shields Overseas Investors
Looking to keep track of global markets and cross-asset price action? Every morning in The Morning Lineup we provide commentary on developments since the prior US close, covering major macro catalysts, geopolitics, economic data, local market price action, earnings, and more. This morning we talked about the price reaction to the latest tariff headlines and how cross-asset relationships between stocks, bonds, and the dollar are not behaving the same way as they did during market stress in the wake of April’s Liberation Day. An excerpt from this morning’s note is below. The Morning Lineup is included in our Premium subscription tier and higher. Sign up for a complimentary trial now!
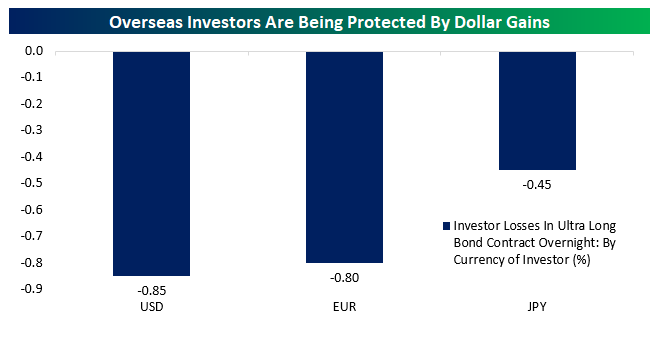
As we’ve discussed a number of times over the past several months, the flow and market price data does not support the idea that non-US investors are fleeing en masse as was feared in the wake of the Liberation Day tariff announcement. We continue to watch price action and the relationship between movements in stocks, rates, and the dollar for signs of that dynamic, and they were again lacking overnight. While UST yields have moved higher as stocks have sold off, the bear-steepening has been relatively modest with 30y yields up less than 5 bps this morning. The dollar has actually rallied today. As shown below, unhedged investors denominated in EUR or JPY are actually seeing smaller losses on US duration overnight than USD-based investors, the opposite of what we would expect if new tariffs were generating a capital flight scenario.
Of course, that lack of pricing for capital flight could reflect the exact same dynamics that we see from equity market behavior with very low implicit pricing for the bad outcome. If markets reverse their behavior, the three-way correlation between stocks, bonds, and the dollar could re-emerge as part of a behavioral and narrative shift, but for now we are not seeing that behavior in how markets are behaving under the current narrative regime. We will continue to watch for any shift in that regime.
Bespoke’s Morning Lineup – 7/11/25 – Tariff Troubles
See what’s driving market performance around the world in today’s Morning Lineup. Bespoke’s Morning Lineup is the best way to start your trading day. Read it now by starting a two-week trial to Bespoke Premium. CLICK HERE to learn more and start your trial.
“Try and fail,but don’t fail to try.” – John Quincy Adams

Below is a snippet of commentary from today’s Morning Lineup. Start a two-week trial to Bespoke Premium to view the full report.
The S&P 500 hit another record high yesterday as certain speculative areas of the market continued to surge. This morning, though, bulls are taking a break as the latest round of tariff announcements from the President set the stage for a negative end to the week. The latest announcement causing the damage is a 35% tariff announcement on Canadian imports in what the President says is a response to the country allowing fentanyl to cross the border into our country. He then added that the 35% levy will go even higher is Canada retaliates. More broadly, President Trump also said he was planning blanket tariffs of 15% to 20% on any countries he hasn’t already sent letters to.
Futures are negative in response with the S&P 500 and Nasdaq indicated to open down 0.5% at the open. Treasury yields are also higher, but the 10-year yield remains below 4.4%. Crude oil and gold are both up 1%, but the gains in other precious metals like silver, platinum, and palladium are even larger at 3%+. The biggest moves to the upside are in the crypto space as Bitcoin is surging close to 4% at a record high of just under $118K while Ethereum is trading just under $3,000 with a gain of 6%.
Like the declines in US futures, Asian markets were mostly lower last night on concerns related to the latest Trump Tariff announcements. Those losses also overflowed into Europe as the STOXX 600 faces a decline of nearly 1% to close out the week.
In terms of what is leading the market, mega-caps remain in charge. The chart below shows the relative strength of the S&P 500 equal-weight (RSP) vs market cap weight (SPY) indices. When the line rises, it indicates outperformance of the equal-weight index, while a falling line indicates that the market-cap-weighted index is outperforming. At this time last year, RSP was in the middle of a short-term burst of massive outperformance, but the gains were fleeting, and by the end of the year, RSP had given up all of its outperformance relative to SPY. In the first quarter of this year, RSP outperformed again, but just like the fourth quarter of last year, the second quarter of this year saw RSP once again give up all of its outperformance. At one point, RSP will take the lead and keep it for a while, but for now, SPY keeps retaking the lead.

Looking ahead, depending on your time horizon, the calendar is either a good friend or an adversary. Over the last ten years, the S&P 500’s median performance in the week following the close today has been a gain of 1.32% and ranks in the 93rd percentile of all one-week periods throughout the year. Over the next three months, though, the S&P 500’s median gain of 0.64% ranks in just the 15th percentile as the months of September and October become a larger part of the three-month view.

The Closer – Balance Sheet, Tariff Deciles, Strong Industrials – 7/10/25
Log-in here if you’re a member with access to the Closer.
Looking for deeper insight into markets? In tonight’s Closer sent to Bespoke Institutional clients, we begin with a look into the Fed’s balance sheet (page 1). Next, we check up on jobless claims and the moves in volatility (page 2). We then review performance of stocks based on the estimated tariff rate they face (page 3) and close out with a look into Industrials huge outperformance in 2025 (page 4).

See today’s full post-market Closer and everything else Bespoke publishes by starting a 14-day trial to Bespoke Institutional today!
Chart of the Day – Keeping Track of AI
Q2 2025 Earnings Conference Call Recaps: Helen of Troy (HELE)
Bespoke’s Conference Call Recaps use AI to summarize lengthy earnings calls. The commentary below is AI-generated and then edited by Bespoke for quality control. As always, none of these summaries should be construed as recommendations to buy or sell any securities, and investors should do their own research and/or consult with a financial professional before making any investment decisions.
Our latest recap available to Bespoke subscribers covers Helen of Troy’s (HELE) Q1 2026 earnings call.
![]()
Helen of Troy (HELE) is a consumer products company across beauty, wellness, home, and outdoor categories. Its well-known brands include Hydro Flask, OXO, Drybar, Revlon (licensed), Braun (licensed), Osprey, Curlsmith, and Olive & June. The company serves global consumers through retail, direct-to-consumer, and international distribution channels. It offers insight into mid-tier consumer behavior, global trade exposure, and product development cycles for essential and discretionary goods. The company’s earnings call covered a challenging quarter marked by a 10.8% revenue decline, heavily impacted by tariff-related disruptions. About 8 percentage points of the decline stemmed from direct import cancellations, pull-forwards, and China softness. Consumer trade-down behavior intensified, with 3–4% average price compression. Despite headwinds, point-of-sale units rose in 8 of 11 key brands, and Olive & June grew faster than the category. Supply chain diversification remains a top priority, with exposure to China tariffs expected to fall to 25% of COGS by FY26-end. The stock fell as much as 30.7% on 7/10 after missing EPS and revenue estimates…
Continue reading our Conference Call Recap for HELE by becoming a Bespoke Institutional subscriber. You can sign up for Bespoke Institutional now and receive a 14-day trial to read our newest Conference Call Recap. To sign up, choose either the monthly or annual checkout link below:
Q2 2025 Earnings Conference Call Recaps: Delta Air Lines (DAL)
Bespoke’s Conference Call Recaps use AI to summarize lengthy earnings calls. The commentary below is AI-generated and then edited by Bespoke for quality control. As always, none of these summaries should be construed as recommendations to buy or sell any securities, and investors should do their own research and/or consult with a financial professional before making any investment decisions.
Our latest recap available to Bespoke subscribers covers Delta Air Lines’ (DAL) Q2 2025 earnings call.
![]()
Delta Air Lines (DAL) is one of the world’s largest global airlines, operating over 4,000 daily flights across a network that spans six continents. It provides passenger and cargo transportation services, with key revenue streams from domestic and international air travel, loyalty programs, and its industry-leading co-branded credit card with American Express. DAL reported $15.5 billion in revenue for the June quarter, up about 1% YoY and consistent with guidance. Premium cabin and loyalty revenue outperformed, while main cabin demand remained soft, especially on off-peak days. The airline is trimming domestic capacity in weaker time slots and noted improved booking curves as consumer confidence stabilizes. International travel trends are shifting toward shoulder-season (between peak and off-peak) demand, and DAL is adjusting its network accordingly. AI-powered pricing tools are expanding to more routes, and the Fly Delta app will soon launch a virtual assistant. On better-than-expected results, DAL shares rose over 10% on 7/10…
Continue reading our Conference Call Recap for DAL by becoming a Bespoke Institutional subscriber. You can sign up for Bespoke Institutional now and receive a 14-day trial to read our newest Conference Call Recap. To sign up, choose either the monthly or annual checkout link below:
Back-to-Back Bulls
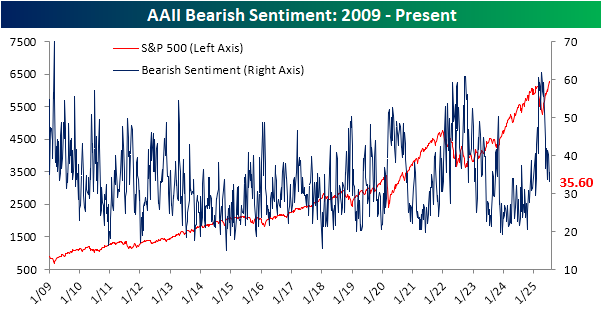
Albeit the move has been mostly recovered by now, the past week’s pullback from fresh all-time highs has resulted in investor sentiment shifting lower. The latest gauge from the weekly AAII survey showed 41.4% of respondents reporting as bullish, down from a 30-week high of 45.0% headed into the July 4th weekend.
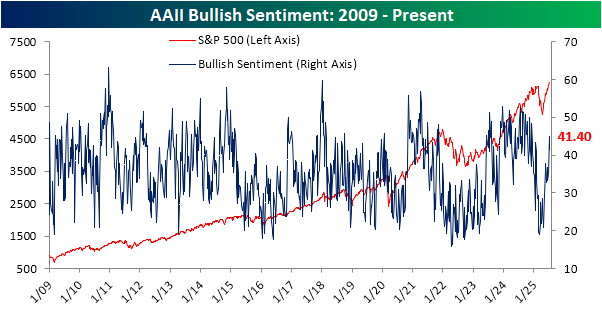
The drop in bullish sentiment meant that an increased share of responses shifted towards bearishness. 35.6% of respondents reported as bearish, up 2.5 percentage points week over week.
Given these readings, the predominant sentiment is still bullish as the bull-bear spread remains positive for a second week in a row at 5.8 points.
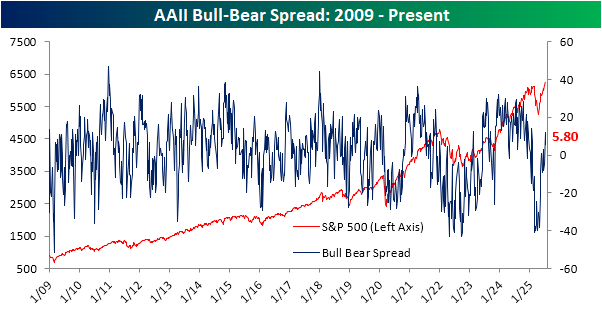
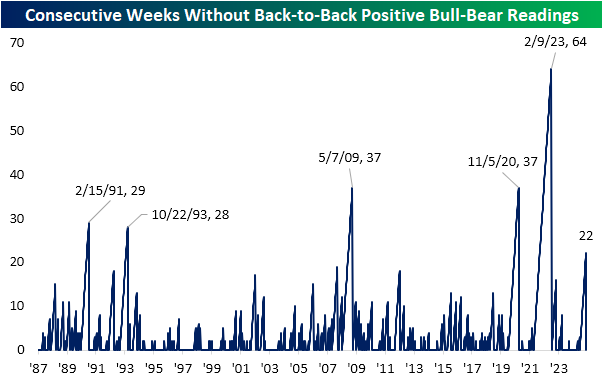
Even though the bull-bear spread was lower this week and current levels are far from earning any superlatives, the still positive reading did mark the first back-to-back positive readings in the spread since the last week of January. Alternatively, that snaps a 22-week-long streak without back-to-back weeks of positive bull-bear spreads. As shown below, such a streak has been uncommon. Throughout the history of the survey since 1987, there have only been five streaks that have gone on for longer.
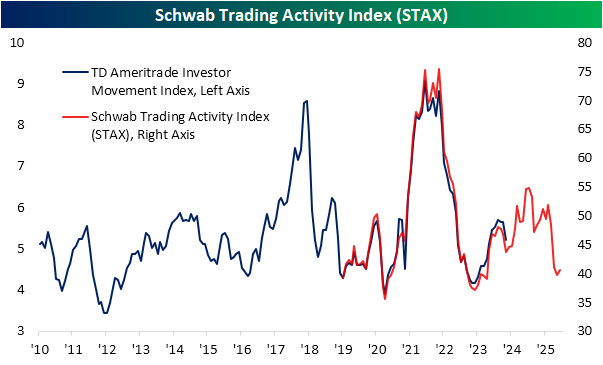
In addition to the usual weekly sentiment gauges, this week also saw an update in the Schwab Trading Activity Index (STAX). Formerly the TD Ameritrade Investor Movement index, before the merger between the two companies, the index differs from other sentiment gauges that tend to ask if an investor is bullish or bearish. Instead, this index uses a proprietary system to assign sentiment scores to retail investors based on their actual account activity. As shown, the June reading only indicated a modest improvement in sentiment after falling for three months in a row. In other words, since the April lows, retail investors had been fading the S&P 500’s recovery back up to record highs, with June only marking a minor shift back toward bullishness among this investor base.
The report also details a few anecdotes about single stocks popular among retail clients. This month’s report highlighted that—again contrary to the changes in these stocks’ prices—recent Tech favorites saw major net selling like NVIDIA (NVDA), Microsoft (MSFT), and Coinbase (COIN). On the other hand, other major Tech names like Tesla (TSLA) and Amazon (AMZN) were noted as seeing consistent purchases among retail investors.
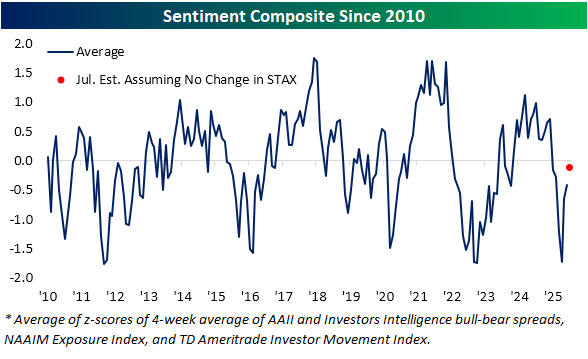
Putting sentiment readings together, below we aggregate this STAX index with the AAII survey and two other weekly sentiment readings: the NAAIM Exposure index and Investors Intelligence survey. Together and equally weighted, the average across these indicators pointed to continued improvements in sentiment in June, and readings for so far in July would point to further improvements down the road.
Bespoke’s Morning Lineup – 7/10/25 – Earnings Season Starts With a Thud
See what’s driving market performance around the world in today’s Morning Lineup. Bespoke’s Morning Lineup is the best way to start your trading day. Read it now by starting a two-week trial to Bespoke Premium. CLICK HERE to learn more and start your trial.
“If you don’t fail sometimes, you are not being ambitious enough.” – Sundar Pichai
Below is a snippet of commentary from today’s Morning Lineup. Start a two-week trial to Bespoke Premium to view the full report.
After several days with little in the way of economic or earnings data, this morning we’ll get reports on jobless claims, and we’ve already seen a handful of earnings reports. Of the four companies reporting earnings this morning, two reported better than expected EPS, three missed sales forecasts, and two lowered guidance. Maybe we would have been better off with no data! In response to the reports, we’ve seen some large moves. Helen of Troy (HELE), which reported a reverse triple play, is down over 20% while Conagra (CAG) and Simply Good Foods (SMPL) are both down over 4%. The only one of the four stocks trading higher in reaction to its report is Delta (DAL). That stock is flying over 13% in pre-market trading.
While these individual names have seen large reactions, overall, equity futures are up or down 0.05% or less, and treasury yields have barely budged. Crude oil is down less than 1% while gold, silver, copper, and platinum are all firmly higher.
Asian stocks were mixed, with Japan and India both down nearly 0.5% while China was up by a like amount. A former BoJ official made comments that there will likely be no more rate hikes until early 2026, while the Bank of Korea kept rates unchanged. In Europe, equities are moving higher as mining companies fuel a 0.6% rally in the STOXX 600 and a more than 1% rally in the FTSE 100.
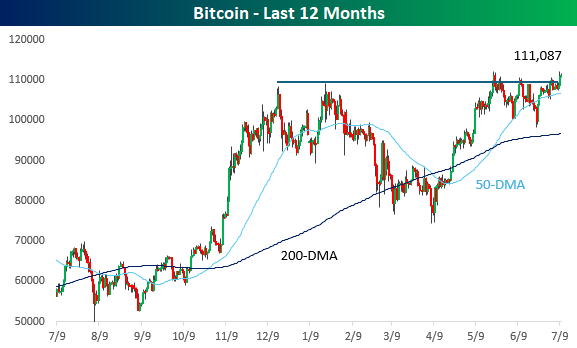
Yesterday, we highlighted some of the massive moves in various metals like gold this year. This morning, we’ll shift our focus to Bitcoin, aka digital gold, which has also been performing very well. While Bitcoin’s performance this year looks like more of a sideways move, it’s still up a respectable 18% YTD and hit a record high yesterday. This morning’s price, right around $111K, leaves Bitcoin right near the resistance it has been dealing with since late last year. A breakout above $112K would complete a cup and handle formation, setting the stage for a new leg higher.
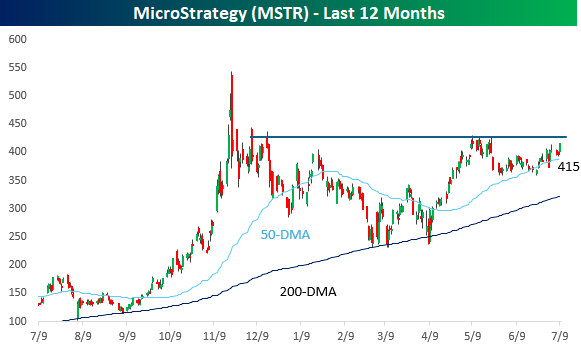
Just as bitcoin prices have been looking to break out from resistance, Bitcoin treasury company MicroStrategy (MSTR) has also been dealing with resistance right around $425 since late last year. Without getting into the valuation of the stock or the premium it trades at relative to its underlying crypto holdings, a move above $425 could set the stage for a new leg higher and a test of its post-Election highs from last year.
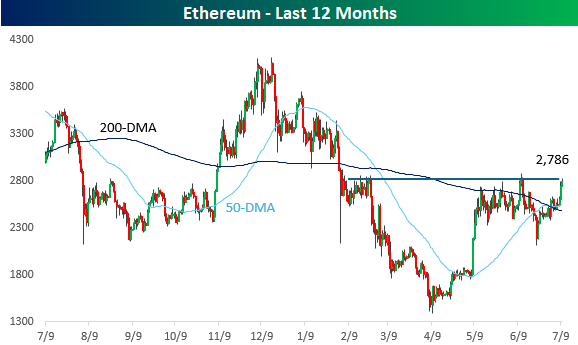
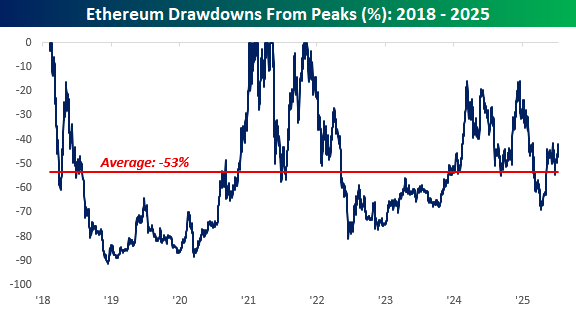
If Bitcoin is the ‘gold standard’ of the crypto space, Ethereum would be the silver standard, and price action has been much more subdued. While prices have rallied in recent weeks as digital tokens have gained in popularity, Ethereum remains more than 20% below its post-election highs. Prices are up over 7% in the last two days but remain below short-term resistance at the $2,800 level.
Throughout its history, Ethereum has been no stranger to large drawdowns. As shown in the chart below, since 2018, it has only been within 10% of a high on 6% of all days, and on average, it has traded in a drawdown of 53%! That means that the current 42% drawdown from its last record high in late 2021 is more modest than average! No one ever said the crypto space was an area of stability!
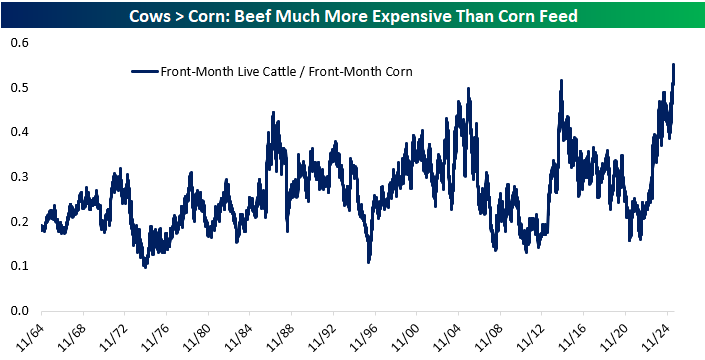
Cattle Futures and Cattle to Corn Ratio Hit Record Highs
Beef prices continue to sizzle. Live cattle futures just closed at a new all-time high, climbing to $2.20 per pound after a multi-year rally that’s been quietly unfolding since mid-2020. While inflation has cooled in many parts of the economy, the beef market remains red-hot, driven by a combination of shrinking cattle herds, ongoing drought conditions in key ranching states, and steady consumer demand for beef across both retail and food service channels.
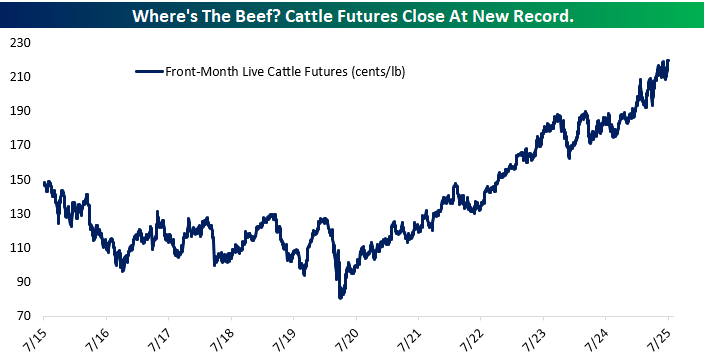
What makes this even more striking is how cheap corn, the primary feedstock for cattle, has remained in relative terms. A long-term chart of the cattle-to-corn ratio shows that beef has never been this expensive relative to feed costs, with the spread hitting its highest point in over six decades. For cattle producers, this is an extremely favorable setup: high output prices and low input costs translate into wide margins.
This divergence has interesting implications. Publicly traded meat processors could benefit from stronger margins. It also speaks to broader commodity cycles: while grain prices have cooled post-Ukraine shock, protein prices have marched higher. If you’re looking for margin tailwinds in the ag and food supply chain, the beef market is one to chew on.