Bespoke’s Global Macro Dashboard — 10/3/18
Bespoke’s Global Macro Dashboard is a high-level summary of 22 major economies from around the world. For each country, we provide charts of local equity market prices, relative performance versus global equities, price to earnings ratios, dividend yields, economic growth, unemployment, retail sales and industrial production growth, inflation, money supply, spot FX performance versus the dollar, policy rate, and ten year local government bond yield interest rates. The report is intended as a tool for both reference and idea generation. It’s clients’ first stop for basic background info on how a given economy is performing, and what issues are driving the narrative for that economy. The dashboard helps you get up to speed on and keep track of the basics for the most important economies around the world, informing starting points for further research and risk management. It’s published weekly every Wednesday at the Bespoke Institutional membership level.
You can access our Global Macro Dashboard by starting a 14-day free trial to Bespoke Institutional now!

Morning Lineup – Relief Out of Italy
Relief out of Italy that the country may reign in spending a bit more than previously planned has European equities trading higher this morning, and Us equity futures are following along in the footsteps.
Two of the most hated sectors in the market right now are homebuilders and semis, and this morning there is news that could impact both sectors. One good and one bad.
First the good news. In the homebuilder space, Lennar (LEN) reported better than expected earnings on revenues that were slightly better than estimates. The stock is trading up over 2% in reaction, but it will be important to see if those gains can hold. Recent positive news for the sector hasn’t had much staying power.
In the semiconductor space, Morgan Stanley cut estimates on the group after downgrading the sector back in the Summer. There’s been a lot of negative commentary towards the semis in recent weeks, so how the group reacts to today’s negative commentary could provide a good tell for the fourth quarter.
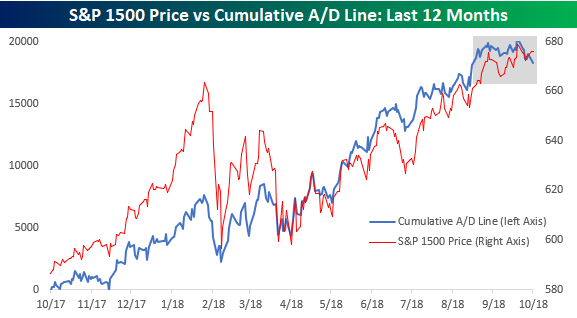
As the number of stocks hitting 52-week lows has increased in recent sessions, there’s been a lot of talk about weakening breadth in the market over the last several sessions. We have repeatedly highlighted the fact that breadth among large-cap stocks continues to be strong, but we’ll be the first to admit that among smaller and mid-cap stocks, breadth hasn’t been as positive.
The chart below shows the S&P 1500 (which comprises large-cap stocks in the S&P 500 as well as mid-cap stocks from the S&P 400 and small-cap stocks from the S&P 600). While the picture here isn’t quite as strong, it is hardly showing signs of a major negative divergence either. In fact, both the cumulative A/D line and the index’s price both hit their most recent all-time highs on the same day (9/20). That said, there is a clear case to be made that in the short-term breadth among the S&P 1500 stocks has flattened out, even as equities have rallied. In fact, while the S&P 1500’s cumulative A/D line is at the same levels it was at on 8/20- a month before the peak- the S&P 1500’s price is 2.3% higher. Not a major divergence yet, but something worth keeping an eye on.
Start a two-week free trial to Bespoke Premium to see today’s full Morning Lineup report. You’ll receive it in your inbox each morning an hour before the open to get your trading day started.

The Closer — Living Large, Slipping Small — 10/2/18
Log-in here if you’re a member with access to the Closer.
Looking for deeper insight on markets? In tonight’s Closer sent to Bespoke Institutional clients, tonight we look at the extremely overbought level of large cap equities versus the extremely oversold level of small cap equities. The results for what typically follows similar extremes are surprising. We also take a look at auto sales numbers released by the industry today and recent Fed speakers’ tone with regards to policy.

See today’s post-market Closer and everything else Bespoke publishes by starting a 14-day free trial to Bespoke Institutional today!
Chart of the Day — Turkey Rebounds
Ford Truck Sales: Blame the Weather. Really!
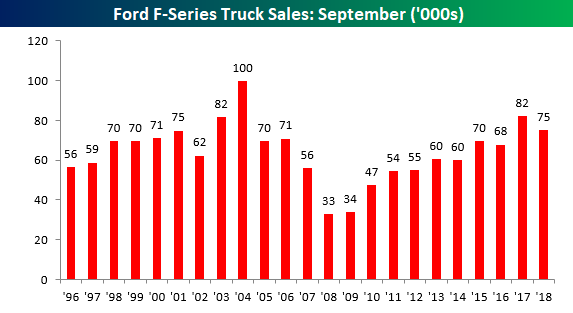
Ford just released sales figures for September and the results weren’t particularly good. While analysts were already expecting sales to decline by 9%, the actual decline was even larger at -11%. Whenever you start to see double-digit declines, it’s not a particularly encouraging sign. As we do each month, our focus in this report is truck sales, and more specifically, F-series pickup trucks. Trucks are often purchased by small businesses and contractors, so they provide a good read on the health of the small business sector, and similar to the prevailing narrative, Ford’s numbers continue to suggest a solid US economy.
In this case, truck sales weren’t as bad for Ford as the headline figures. As shown in the chart below, F-series truck sales fell from 82.3K in 2017 down to 75.1K for a decline of nearly 9%. That’s still a relatively large decline, but keep in mind there are two caveats to this total. First, September 2018 (25) had one less selling day than September 2017 (26). The second factor to keep in mind is weather. Not only was this year’s September total negatively impacted by Hurricane Florence in the Carolinas, but September 2017’s total was artificially boosted by Hurricane Harvey, which hit the Houston area in August. You can see it in the chart below where 2017’s September total saw an enormous boost, while this year total sales declined.
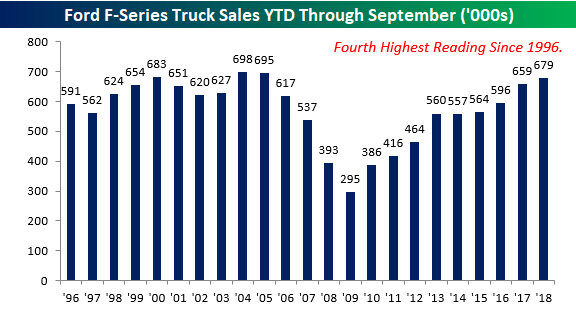
On a YTD basis, total sales look more in line with the trend of the last several years. On a YTD basis, sales increased by just over 3% from 658.6K up to 679.0K. At this rate, 2018 is on pace to be the strongest year for truck sales since 2005 and the fourth best year since 1996.

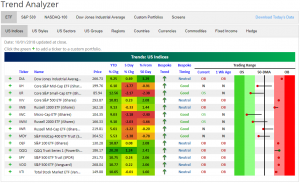
Trend Analyzer – 10/2/2018 – Small-Caps Get Oversold
As shown below in the snapshot of our Trend Analyzer tool, small-cap and mid-cap stocks have had a rough go of it lately. The Core S&P Small-Cap (IJR) and Micro-Cap (IWC) are both down the most of the major US index ETFs since last week at -2.17% and -2.18%, respectively. Along with the Russell 2000 (IWM), these ETFs have each moved well below their 50-day moving averages into oversold territory. This is the first time in a while that we have seen multiple ETFs oversold at the same time. Unfortunately—with the exception of the Dow (DIA) and Nasdaq (QQQ) who have continued to perform well recently—even the ones that have edged out gains are not necessarily saving graces.

Morning Lineup – Off the Lows
What was looking like quite a bad morning for US equities when our alarms went off a few hours ago is looking a lot more manageable now as futures have rallied off their lows.
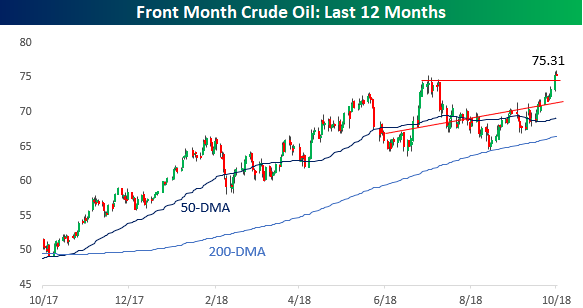
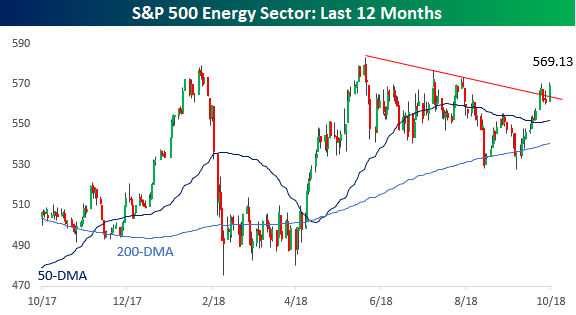
In yesterday’s session, the big star of the day was oil and the Energy sector in general. Driven by a 2.8% rally in crude oil prices, the S&P 500 Energy sector jumped 1.5%. Checking out the charts for oil and the Energy sector show some positive trends.
Crude oil prices are relatively quiet today, but yesterday’s rally took the front month future to a new 52-week high with a breakout above the summer highs.
While not at a new high, the S&P 500 Energy sector looks to be on the right path after convincingly breaking its downtrend from the highs in the Spring. Also working in the sector’s favor is that along with the rally in crude oil, natural gas prices also rallied yesterday to their highest prices since January.
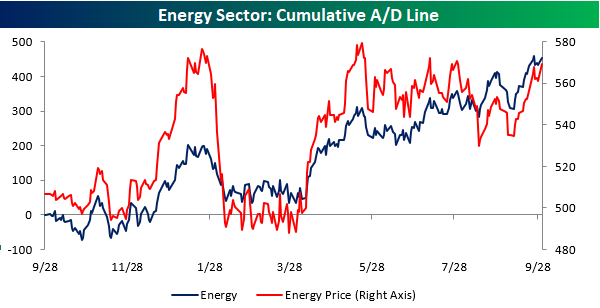
Internals for the Energy sector also look positive. The chart below compares the sector’s price and cumulative A/D line. While prices aren’t yet at new highs, breadth has been strong and consistently trending higher for the last several weeks.
Start a two-week free trial to Bespoke Premium to see today’s full Morning Lineup report. You’ll receive it in your inbox each morning an hour before the open to get your trading day started.
The Closer — Seasonal Tailwinds, Manufacturing Headwinds — 10/1/18
Log-in here if you’re a member with access to the Closer.
Looking for deeper insight on markets? In tonight’s Closer sent to Bespoke Institutional clients, we take a look at the very positive seasonality that historically dominates Q4. We also review manufacturing sentiment data from around the US and global economy and today’s residential construction release for the month of August.
See today’s post-market Closer and everything else Bespoke publishes by starting a 14-day free trial to Bespoke Institutional today!
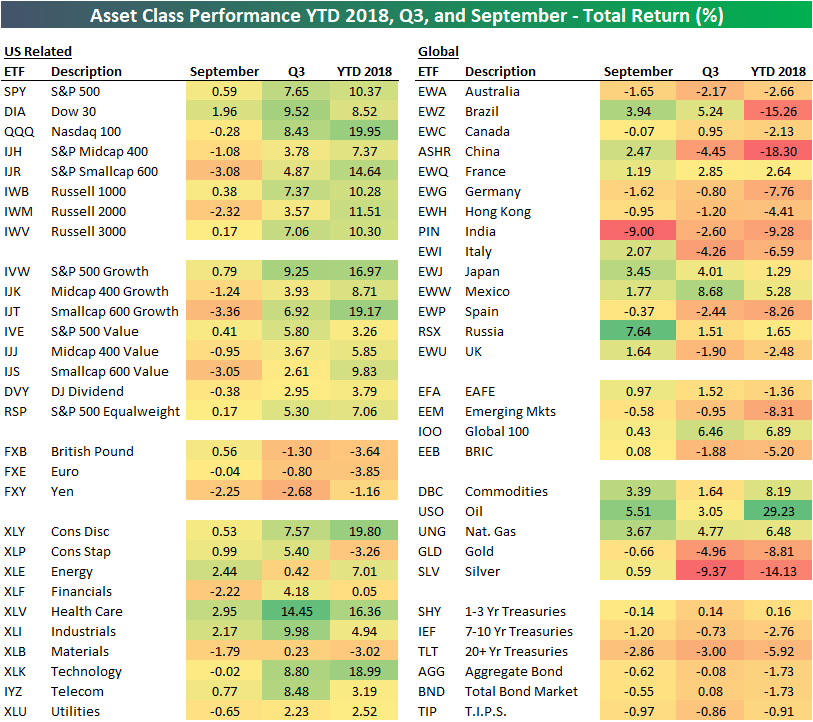
September, Q3, and YTD 2018 Asset Class Performance
Below is a snapshot of total returns for various asset classes through the first three quarters of 2018. In September, we saw gains for the S&P 500 and Dow 30, but we saw declines for the Nasdaq 100 and small-caps. The Technology sector was also down in September along with Financials, Materials, and Utilities.
Outside of the US, India (PIN) got slammed in September with a drop of 9%. Russia, on the other hand, saw a gain of 7.64% on the month as commodities rallied.
Fixed income ETFs were down across the board in September, and they’re down YTD as well on a total return basis.
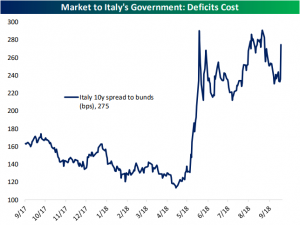
Italy’s Budget Woes
European equities ended last week by unwinding two weeks worth of solid gains. On Friday, the STOXX 600 was down 0.83% on very high volumes, but the real chaos was in Italy where the FTSE MIB was down 3.7%. Within the STOXX 600, Banks felt the pain the most, down 2.8% with Insurance not far behind at 1.7%. Italian banks made up four of the worst five performers in the broad STOXX 600, with Banco BPM, Unione di Banche Italia, UniCredit, and Intesa Sanpaolo all off at least 7.8%. The FTSE MIB saw a continuation of these issues today, falling 0.49% on the session.

The reason for all the chaos was the Italian government destroying market hopes of fiscal restraint. Thursday night, they announced a deficit-to-GDP target for the 2019 budget of 2.4% of GDP. Italian government debt-to-GDP is 132%, and its economic indicators consistently lag; there’s just no way they can sustainably spend 2+% of GDP if the markets don’t want to let them. Eurozone officials echoed these concerns in a meeting earlier today and look to mitigate escalation of these concerns.

While much has been made of the Italy-EU fault lines, this market-imposed discipline is much more binding at present and saves much of the work that EU bodies might otherwise have to do in restraining Italian spending.