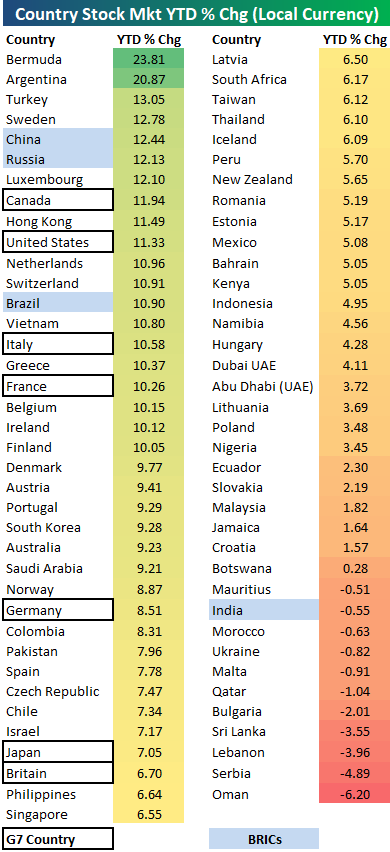
Country Stock Market YTD Performance So Far in 2019
Below is a look at the performance of 75 country stock markets around the world so far in 2019. These numbers show each country’s year-to-date percentage change (not total return) in local currency.
It would be hard to imagine a better start to a year for global equities. Of the 75 country stock markets in our table, 64 (85.3%) are in the green, and the average gain across all countries stands at +6.38%. Bermuda and Argentina are the two best performing stock markets so far with gains of north of 20%, while Oman has been the worst with a YTD decline of 6.2%.
Notably, the G7 countries are performing very well in 2019, with all 7 outperforming the average. Canada is up the most of the G7 countries with a YTD gain of 11.94%, and the US is not far behind at +11.33%. Three of the four “BRIC” countries are up more than 10%, with China leading the way at +12.44%. India is the only BRIC country in the red for the year.
Broad Based Breadth
One aspect of the rally in stocks this year that we can’t stress enough is how strong breadth has been. Besides the fact that the equal-weighted S&P 500 is outperforming the market cap weighted index by close to three percentage points YTD, the vast majority of S&P 500 Industry Groups are also either right at or very close to YTD highs. The table below lists S&P 500 Industry Groups that, along with the S&P 500, hit YTD highs so far today. Of the 60 Industry Groups, 26 hit YTD highs today and five of them are already up 20% YTD!

In addition to the 26 Industry Groups above, another 16 Industry Groups traded within 1% of a YTD high today and three of those are also up over 20% YTD. Adding both lists together, 70% of S&P 500 Industry Groups either traded at or came within 1% of hitting a YTD high this morning. That’s broad!

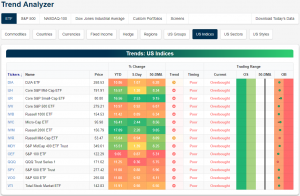
Trend Analyzer – 2/22/19 – One Less Downtrend
As we mentioned yesterday, the Dow (DIA) was the first of the major index ETFs in our Trend Analyzer to finally break out of the downtrend it had been stuck in over the past couple months. Despite declines on the day yesterday, the Russell Mid-Cap ETF (IWR) is now the second member of the group of index ETFs to have moved out of its downtrend. Again, while it may not be an uptrend we would prefer to see, the sideways trend is reassuring.
Declines yesterday also yanked the leash on overbought levels as several members of the group of ETFs entered the day very close to 2 standard deviations above the 50-DMA. Every ETF is still overbought but at more middling levels. Headed into the final session of the shortened week, small-caps have drastically outperformed with gains of nearly double the other indices. At the top is the Core S&P Small-Cap ETF (IJR) with a gain of 2.53% over the week. Right on its heels is the Micro-Cap (IWC) and Russell 2000 (IWM) at 2.44% and 2.20%, respectively. At the other end of the spectrum, the Nasdaq (QQQ) has been very weak over the past five days only gaining 0.36%.
Morning Lineup – Much Ado About Nothing
We realize that it has been a holiday-shortened week and everything, but you can’t get much more boring than the last three days of trading. Heading into the final trading day of the week, the S&P 500 is within one point of where it closed out last week. That could change today, though, as the S&P 500 is indicated to open higher by about 10 points. That won’t be enough to bring potential resistance levels into play near 2,800, but it’s a move in the right direction. Today’s catalyst for higher prices? Optimism on a trade deal with China on news that President Trump will meet with Chinese Premier Lui today at 2:30 PM. What else is new?
There’s no economic news on the calendar today, but Fed speakers will make up for the void as nine members of the FOMC are scheduled to speak throughout the day. Nine! Read all about overnight events around the world and this morning’s news in today’s Morning Lineup.
Bespoke Morning Lineup – 2/22/19
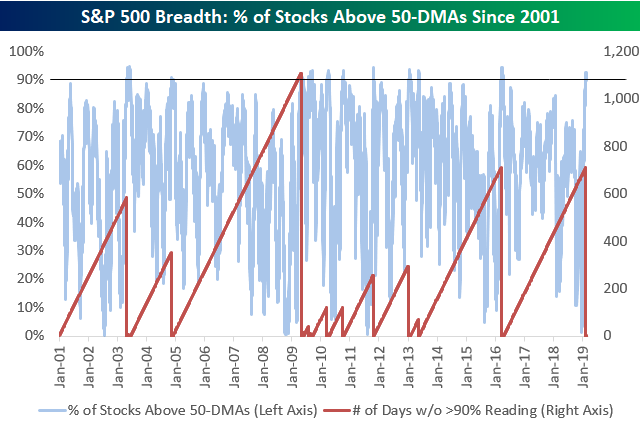
As mentioned above, the opening gap won’t be enough to bring potential resistance at 2,800 into play. Below are updated S&P 500 and Nasdaq composite charts that we highlighted in last week’s Bespoke Report. Even with more than 90% of S&P 500 stocks above their 50-day moving averages, it still has yet to make that higher high that we have been waiting for. The Nasdaq, meanwhile, briefly made a higher high and peeked above its 200-DMA earlier this week, but fell back down below that level yesterday.


Start a two-week free trial to Bespoke Premium to see today’s full Morning Lineup report. You’ll receive it in your inbox each morning an hour before the open to get your trading day started.

The Closer — Positive Signals, Confusing Housing, Manufacturing Weakness, EIA — 2/21/19
Log-in here if you’re a member with access to the Closer.
Looking for deeper insight on markets? In tonight’s Closer sent to Bespoke Institutional clients, amidst a half percentage point drop in the S&P 500 and weak economic data, we provide some of the more positive signals that markets have been sending. Turning to said economic data, first, we review the weaker, but also mixed, existing home sales print. Next, we look at the manufacturing picture through soft data from the Philly Fed and Flash PMIs as well as hard data from December manufacturing orders and shipments. We finish with EIA data that showed crude inventories continue to rise.

See today’s post-market Closer and everything else Bespoke publishes by starting a 14-day free trial to Bespoke Institutional today!
Bespoke’s Sector Snapshot — 90%+ Breadth
We’ve just released our weekly Sector Snapshot report (see a sample here) for Bespoke Premium and Bespoke Institutional members. Please log-in here to view the report if you’re already a member. If you’re not yet a subscriber and would like to see the report, please start a two-week free trial to Bespoke Premium now.
In this week’s Sector Snapshot, we look at 90%+ breadth readings in terms of the percentage of stocks trading above their 50-day moving averages. The index just ended a streak of 711 trading days without a reading above 90%. To find out how the S&P performs in the weeks and months after streaks like this come to an end, you’ll need to access our just-published Sector Snapshot.
To gain access, start a two-week free trial to our Bespoke Premium package now. Here’s a breakdown of the products you’ll receive.
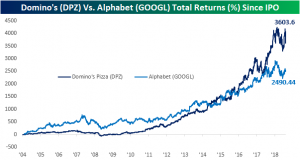
Pizza Pays — Domino’s Delivers Over Google
If you were sent back in time to 2004 and had the choice to buy Domino’s Pizza (DPZ) or Alphabet (GOOGL) at their IPO, which would have been the better choice? Due to the epic size and influence of its business, impulse would probably have you choose Alphabet. But DPZ has actually seen significantly better returns than GOOGL since the companies’ IPO dates. Since inception, DPZ has seen a total return of 3,604% even after today’s 9.03% decline in the stock in reaction to an earnings miss this morning. Not that GOOGL’s 2,490% return is something to turn your nose at, but it is dwarfed by DPZ’s returns. For the stocks’ first decade, up until 2014, this was not the case though. GOOGL had actually outperformed DPZ for much of their lifespans as public companies. From then up until early 2016, the two stocks alternated between being the leader, but in the last two years, Domino’s ran away with things. Part of the reason for this is DPZ has fairly consistently paid a dividend since 2004 which is why returns for the stock have been considerably better over the long term.
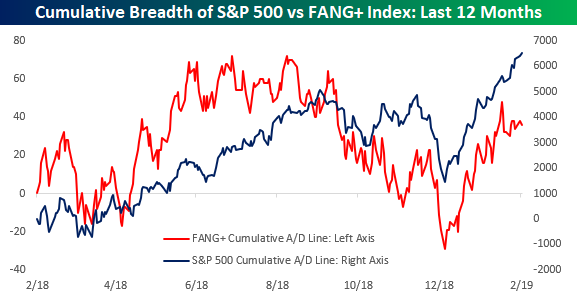
FANG Falls Out of Favor
There was a time not long ago that the market was all FANG all the time, and by FANG we not only mean the four stocks that make up the acronym but also the other members of the group that makes up the FANG+ Index. The FANG+ Index was created probably more as a marketing gimmick than anything else, but in addition to the likes of Facebook (FB), Amazon (AMZN), Netflix (NFLX), and Alphabet (GOOGL), it also includes other high growth names like Alibaba (BABA), Apple (AAPL), Baidu (BIDU), Nvidia (NVDA), Tesla (TSLA), and Twitter (TWTR). Looking at the various names that make up the group, a number of them have fallen on some hard times of late and have been underperforming the broader market.
This recent underperformance has also been reflected in the breadth of the FANG+ index. As we have highlighted in a number of our reports over the last few weeks, the S&P 500’s cumulative A/D line has exceeded its highs from last fall. The FANG+ stocks, though? Not so much. In fact, it’s not even close. As shown in the red line below, breadth for the FANG+ stocks actually peaked early last summer and failed to make a new high when breadth for the S&P 500 made a new high last September. Even more troubling for the group in the short-term, though, is that even as breadth for the S&P 500 made new highs this week, cumulative breadth in the FANG+ index is still well off its highs from early February.
Investors Increasingly Optimistic
As seen through the weekly AAII survey this week, investor sentiment showed growing optimism but nothing extreme. Bullish sentiment was up a little over 4% to 39.32%, and while not particularly high, the percentage of bulls now sits at the upper end of the range the sentiment reading has been at over the past couple months.
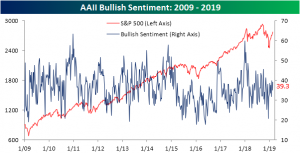
Meanwhile, bearish sentiment held steady rising ever so slightly to 25.39% from 25.07% last week. The percentage of bearish investors has come way off of its highs from the late 2018 sell off and is sitting at the lower end of the range that has been observed in the past year. So while in the short term it may seem this sentiment reading is still extremely low, looking back further it is actually more or less in line with what has been seen in the past.

All of the gains to bulls and bears came at the expense of those that reported neutral sentiment last week. As we mentioned last week, neutral sentiment has been climbing quickly in the past month to fairly elevated levels after hitting multi-year lows in the final week of 2018. Pulling back to 35.3% this week, it is still a few points above the historical average.
