Bespoke’s Sector Snapshot — 2/28/19
We’ve just released our weekly Sector Snapshot report (see a sample here) for Bespoke Premium and Bespoke Institutional members. Please log-in here to view the report if you’re already a member. If you’re not yet a subscriber and would like to see the report, please start a two-week free trial to Bespoke Premium now.
In this week’s Sector Snapshot, we look at year-to-date returns for the S&P 500 and its eleven sectors through the first two months of 2019. We also take a look at extremely high breadth levels that remain in place from last week.
To gain access to the report, please start a two-week free trial to our Bespoke Premium package now. Here’s a breakdown of the products you’ll receive.
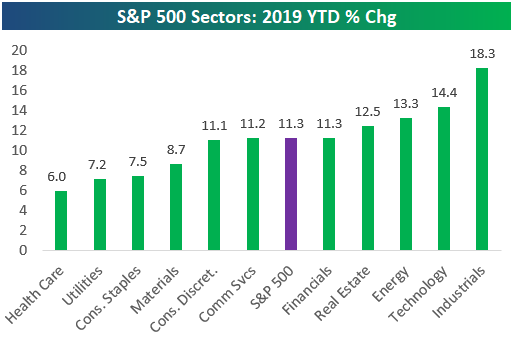
Chart of the Day: Bearish Sentiment Indicates Rough Week But Great Year Ahead
Tax Law Changes Weighing On Housing
Earlier this week, S&P/Case-Shiller home price indices for the month of December were released. We discussed them in detail in our Chart of the Day on Tuesday. We made three key observations.
First, we noted that seasonally adjusted Case-Shiller home prices tend to exhibit some residual seasonally. After re-seasonal adjustment, we can see monthly price changes. That leads to a second observation: home prices have slowed considerably from annual rates north of 6% in mid-2018 to more like 3% today, though no month has seen home prices either decline or rise slower than inflation.
Finally, a third observation: capped deductions on state and local taxes (part of the tax cuts passed at the end of 2017) seem to be having a significant impact on home prices. As shown in the chart below, metro areas with high tax rates have seen home price growth much lower on average than metros with low tax rates. It seems clear that the Tax Cuts and Jobs Act (TCJA) is having a material impact on the price appreciation of homes in areas where homeowners can no longer deduct as much of their state and local taxes.

Q4 Was Solid, Full Year Data Boosted By Stimulus
Today the BEA finally got around to releasing Q4 GDP numbers, about a month later than usual thanks to the government shutdown in late December and early January. Below we recap the contribution to growth in Q4 by expenditure category relative to Q3.
As shown, the consumer was a bit weaker in Q4 than Q3 thanks to weaker spending on services and non-durable goods. Consumer spending still added about 1.9% to total GDP growth and was by no means terrible, though. Housing continued to drag, with residential fixed investment shaving 14 bps off the total growth rate, while nonresidential fixed investment picked up sharply thanks to very strong transportation equipment investment and intellectual property products investment (namely software). In Q3, net exports crushed growth but the 2.33% contribution from inventories more than offset that factor, and this quarter the two were both much more reasonable with inventories adding 13 bps and trade subtracting 22 bps, both a bit stronger than we estimated last night in The Closer. Finally, both state and local government and the federal government consumed fewer goods and services and invested less than in Q4, reducing their support for growth.
Finally, we note that 2018 was the first year since 2004 where no quarter reported growth of less than 2% (at annual rates). While that may seem like a very big deal, it’s worth a bit of context: 2018 saw a massive reduction in taxes coupled with higher expenditure numbers, a form of stimulus for activity. It’s notable that even with a stimulus equating to about 2% of GDP per the CBO (see our Chart of the Day from February 12, 2018 for more detail, link, or listen to our conversation on Bespokecast with Evercore ISI’s Ernie Tedeschi, link, for more detail) the economy was still only able to grow about 2.9% (average of output by quarter in 2018 vs 2017) to 3.1% (Q4 YoY) in 2018. While that doesn’t mean the economy is terrible, it’s important to emphasize that trend growth is just much, much lower than it used to be due to lower productivity growth, lower population growth, and other factors.
Claims Tick Up But No 52 Week High
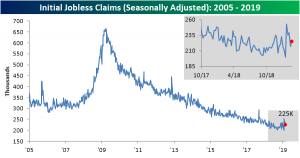
Jobless claims on a seasonally adjusted basis came in higher once again this week rising to 225K from an upwardly revised 217K last week. This is right in the middle of the range that claims have been at for much of the past year. The streak of weeks below 300K now stands at 208, so the indicator still points to a healthy labor market.
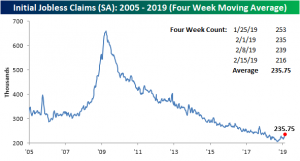
As we have made note of in the past couple weeks (see here and here), the less volatile four-week moving average measure has seen multiple 52-week highs. While on its own it may not be too much of a concern, repeated instances would not be a positive sign. Fortunately, this week we get a break from 52-week highs as the moving average moved lower to 229K from 236K last week. This comes as a result of a high 253K reading from the final week of January rolling off of the average. This week’s print is still well above what was observed for much of the past year but it is reassuring that it did not hit a 52-week high for the third week in a row.
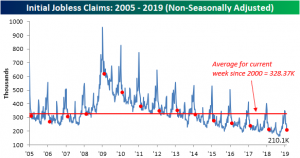
Consistent with seasonal tendencies, the non-seasonally adjusted data also fell 8K this week to 202.7K. While still healthily under the average for the current week of 315.59K, this print is above last year’s. For the current week last year, the non-seasonally adjusted number came in at 195.9K. Otherwise, this is still well below other prints of the current cycle.
Morning Lineup – No Deal!
Even with President Trump leaving Hanoi with no deal, futures are little fazed this morning as the focus is on economic data including GDP, Jobless Claims, and Chicago PMI. Read all about overnight events and this morning’s news in today’s Morning Lineup.
Bespoke Morning Lineup – 2/28/19
With the S&P 500 stalling out just below the 2,800 level in recent days, we wanted to provide a quick update on where the market and individual stocks within the S&P 500 stand relative to their 52-week highs. The chart below shows how far every stock in the S&P 500 closed yesterday versus their 52-week high. While the S&P 500 is just over 5% from its September high, individual stocks in the index are down an average of 14.2% from their respective highs. That may sound like a pretty wide divergence, but it’s actually pretty common as not all stocks hit new highs in unison with the market. In fact, even when breadth is very positive, it’s rare that even 25% of stocks in the index will hit 52-week highs on the same day. As things stand now, 43 stocks in the S&P 500 closed within 1% of a 52-week high yesterday while 150 closed within 5%.

Start a two-week free trial to Bespoke Premium to see today’s full Morning Lineup report. You’ll receive it in your inbox each morning an hour before the open to get your trading day started.

Equity Inflows Peter Out Even As Bond Buyers Bid Boldly
Today the Investment Company Institute (ICI) updated its weekly recap of money flows into and out of US mutual funds. While fund flows continue to run at a strong pace in aggregate ($3.83bn of inflows in the past week, part of $26.19bn of inflows in the past 4 weeks), there’s been a complete halt to equity inflows. As shown in the table below, every category of domestic equity fund has seen outflows over the past four weeks and all but two small categories of domestic equity funds saw outflows over the past week. At the same time, bond markets have seen massive inflows, with more than $8bn of inflows in the past week and $33.5bn in the past four weeks. The only category of bonds that have not seen inflows is higher risk high yield bonds, which have seen outflows over the past week and four weeks. Municipal bonds have also seen very large inflows; over the past four weeks, that asset class has seen the largest rush of new cash on record dating back to 2007, more than $10bn. For more on mutual fund flows, make sure to check out The Closer tonight.
The Closer — Yields On The Verge, Housing Surge, GDP Window, ICI Flow — 2/27/19
Log-in here if you’re a member with access to the Closer.
Looking for deeper insight on markets? In tonight’s Closer sent to Bespoke Institutional clients, we take a look at the breakout in breadth visible from outperformance of the S&P 500 on an equal-weight basis relative to the S&P 500 at its typical market cap weighting. The chart below illustrates that breakout. We also discuss the price action in yields which suggest the next large move for rates will be higher. In economic data, we take a look at more housing activity green shoots in the form of today’s mortgage purchase applications and pending home sales data. We then move on to reviewing the outlook for trade and inventories in tomorrow’s GDP numbers and finish with an update on ICI’s mutual fund flows data.

See today’s post-market Closer and everything else Bespoke publishes by starting a 14-day free trial to Bespoke Institutional today!
February: The Month Of The 200-DMA
As the month comes to a close, from a technical perspective, global equity indices have made solid progress in February. Around half (12) of the 23 country equity index ETFs that we track in our Global Macro Dashboard managed to take out their respective 200-DMAs this month. These country indices broadly bottomed around the same time last year and have been steadily climbing since with some surpassing the 200-DMA more than others. For example, Italy’s FTSE MIB and France’s CAC 40 have just barely moved above while China’s CSI 300’s has surged past. Meanwhile, Spain’s IBEX may not have necessarily started the month below, but it has seen constructive movement during, bouncing off of its 200-DMA. Global indices taking out these resistance levels—or for the case of Spain finding it as support—helps to provide some reassurance to the strength of the rally around the globe so far in 2019.
Whereas for the better portion of 2018 some of these indices remained in downtrends, the current rally is a nice reversal. Granted, equity market performance certainly does not entirely negate the concerns around weaker macroeconomic data from a number of these countries, some of which can be seen in our Global Macro Dashboard, but it does help give a reason to not head for the exits as a result of global slowing just yet.