Chart of the Day: A New High In New Highs
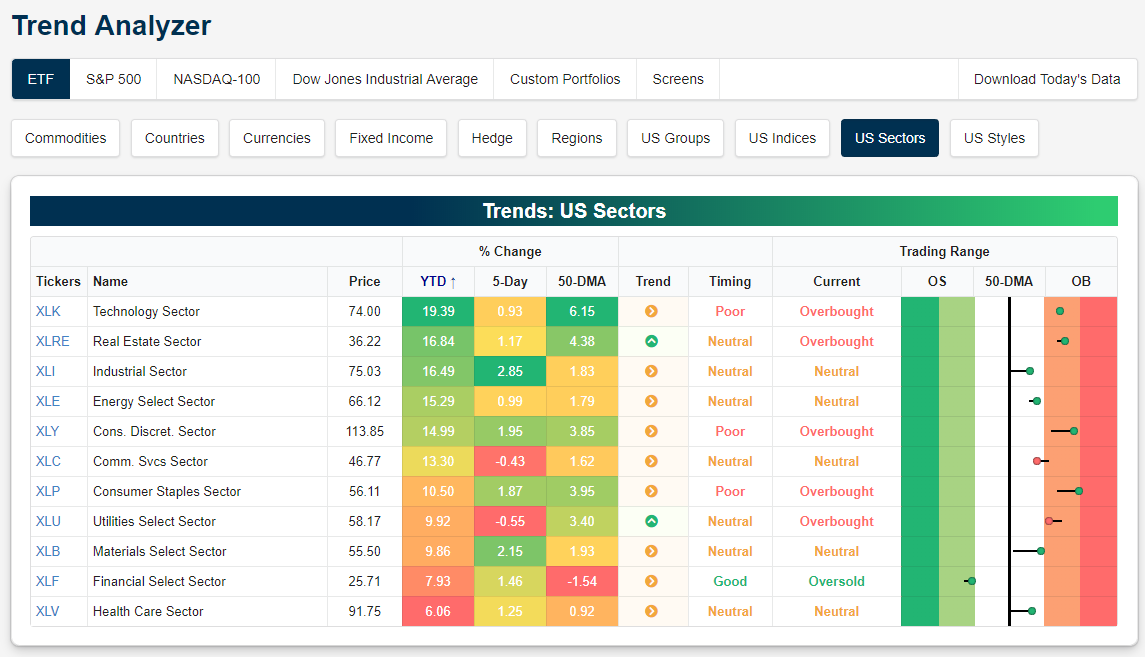
Trend Analyzer – 4/2/19 – Financials Back In
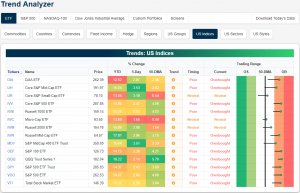
April got off to a strong start yesterday, moving the majority of major index ETFs out of neutral territory and into overbought levels. Currently, there are only three ETFs that are still neutral while the remaining eleven are overbought. These ETFs have made a fairly large push towards or deeper into overbought in the past week as seen through the long tails in our Trend Analyzer tool. Some, like the Core S&P Mid Cap (IJH) and S&P Mid Cap 400 (MDY), have even made it back to overbought after sitting below their 50-DMAs at this time last week. These two have also seen the strongest gains, rising more than 3.5%. While most of the small and mid caps still have some room to run until overbought levels are more of a concern, other ETFs are approaching extreme overbought territory. On the other hand, the Micro-Cap (IWC) has significantly lagged in the past week and is just barely above its 50-DMA. The Core S&P Small Cap (IJR) is in the same boat. Even though it has rallied more than 3% over the last week, it only sits 0.64% above its 50-DMA.
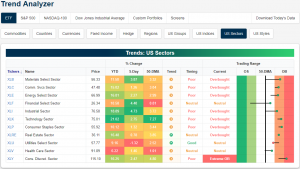
Taking a look at sector ETFs, it is broadly the same story. For the most part, things have moved towards overbought as eight of the eleven sectors sit in this range. The Consumer Discretionary Sector (XLY) has moved into extreme overbought territory after a large gap up yesterday. Meanwhile, Financials (XLF) have staged a turnaround after substantial declines in recent weeks. Yesterday’s rally of 2.45% not only helped to lift the sector out of oversold levels, but it also brought the sector back above its 50-DMA. XLF actually doesn’t hold the crown for the sector with the largest gains over the past five days. That title belongs to Industrials which have surged 4.73%. Conversely, Utilities (XLU), which had been one of the better sectors on the year up until a couple of weeks ago, has continued to fall out of favor. In the past week, XLU has exited overbought levels and is now in neutral after falling 1.4%. It is the only sector to be lower than where it stood one week ago.
Golden Crosses Galore
Yesterday’s 1%+ rally for US markets left the six major US index ETFs across market cap levels all back above their 50-day moving averages. As shown in the snapshot below pulled from our Trend Analyzer tool, all six of these index ETFs are up double-digit percentage points year-to-date, and they’re all up more than 2% over the last week as well.
Five of the six are trading in overbought territory, which means they’re more than one standard deviation above their 50-day moving averages. The Russell 2,000 smallcap ETF (IWM) is the lone one in the group that’s not overbought. Start a two-week free trial to Bespoke Premium to access our interactive research portal. You won’t be disappointed!

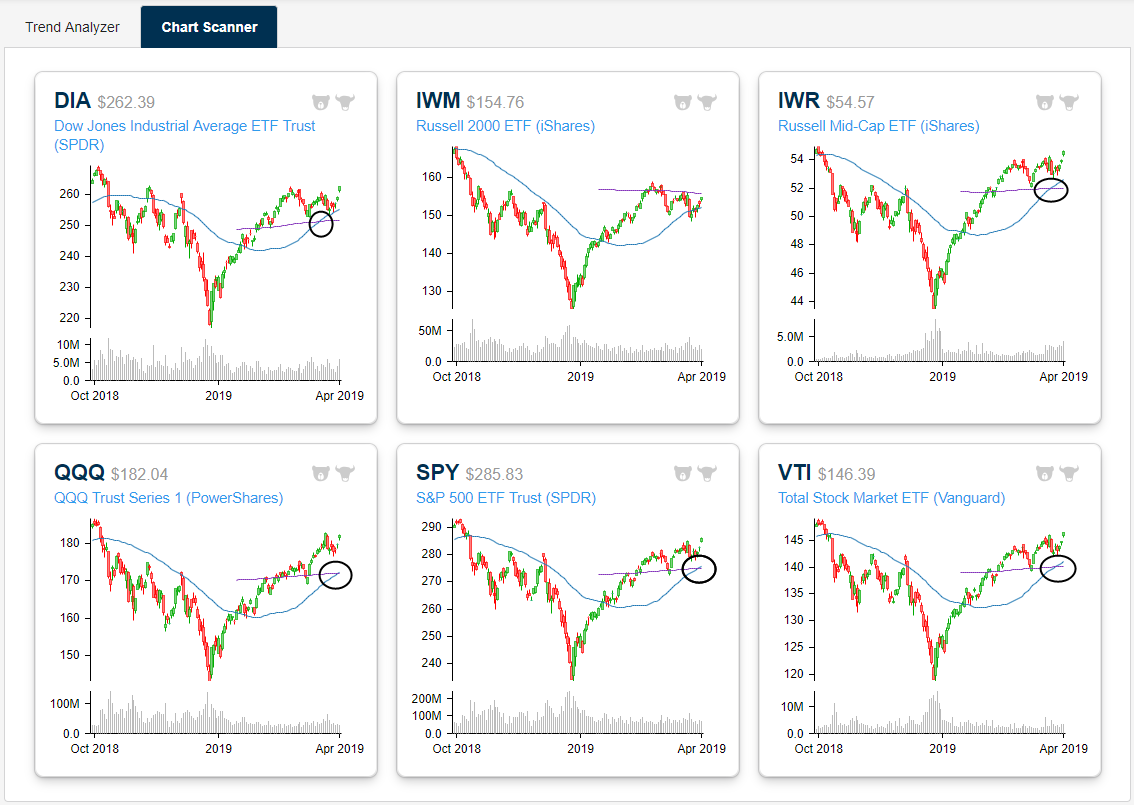
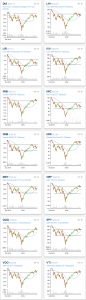
Using our Chart Scanner tool that’s available to Bespoke Premium and Bespoke Institutional members, below is a snapshot of the six US index ETFs highlighted above.
Five of the six have just recently experienced “golden cross” technical formations, which occurs when the ETF’s 50-day moving average crosses above the 200-day moving average as both moving averages are rising. While DIA (the Dow 30) and IWR (midcaps) experienced golden crosses a couple of weeks ago, the Nasdaq 100 (QQQ) and the S&P 500 (SPY) just saw golden crosses in the last two trading days. For analysis of how bullish or bearish a “golden cross” formation is, check out this report we published on the topic yesterday.
Morning Lineup – “It’s Just a Fad”
We’ve just published today’s Morning Lineup featuring all the news and market indicators you need to know ahead of the trading day. To view the full Morning Lineup, start a two-week free trial to Bespoke Premium.
Here’s a snippet from today’s report:
We have a quiet day of economic data today as the only reports of note are Durable Goods and Auto Sales. Durable Goods were just released and showed a decline of 1.6% for their third monthly decline in the last four months. Equity futures are trading right around the unchanged level, which is actually an improvement from where they were trading overnight as bulls try and keep up the momentum going from Monday’s strong start to the quarter. One of the bigger stories, though, is crude oil, which just topped its 200-DMA for the first time since last October.
The days of the internet and online shopping being “just a fad” have come a long way over the years, but February’s Retail Sales report (released Monday) highlighted another of many major milestones that the growth of online shopping has reached over the years. In this case, it was the total share of Retail Sales that Non-Store retailers account for. Over the years this sector has been sucking up share at the expense of just about every other sector seeing its total share of sales rise from under 5% in the late-1990s to nearly 12% today. In February, Non-Store retail accounted for 11.813% of total sales overtaking General Merchanside (11.807%) for the fourth largest sector overall. Sure, we had to go out to three decimal places, so the margin of different is extremely small, but looking at the chart the trend remains clear; the share of total sales for each sector are clearly going in opposite directions.

Start a two-week free trial to Bespoke Premium to see today’s full Morning Lineup report. You’ll receive it in your inbox each morning an hour before the open to get your trading day started.

The Closer — Curve Stops, April Starts Strong, Improvement Surge, Retail Wreck — 4/1/19
Log-in here if you’re a member with access to the Closer.
Looking for deeper insight on markets? In tonight’s Closer sent to Bespoke Institutional clients, we begin with a look at the rapid bear-steepening of the yield curve. We provide the case that yields could have fallen further given the performance of Industrials versus Utilities and Copper versus Gold while also taking a look at how momentum driven the rates sell-off has been. Turning to equities, with today’s jump into Q2, we look at the at least neutral to bullish case given prior instances of strong Q2 starts. In macro data, we delve into the strong print of Construction data which rose 1% MoM versus the 0.2% decline forecasted before moving onto Retail Sales that continue to be a mess.

See today’s post-market Closer and everything else Bespoke publishes by starting a 14-day free trial to Bespoke Institutional today!
Chart of the Day: The Skeptic’s View of ISM
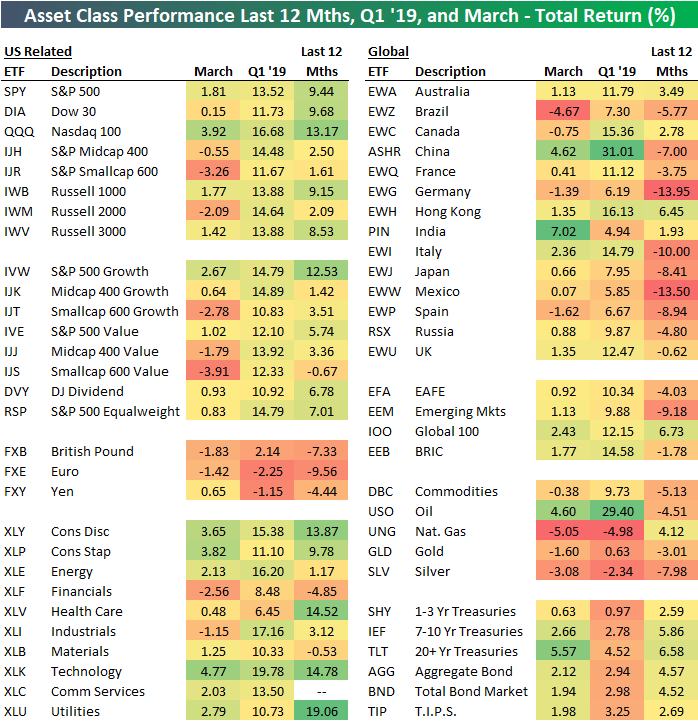
First Quarter Global Equity Market Performance
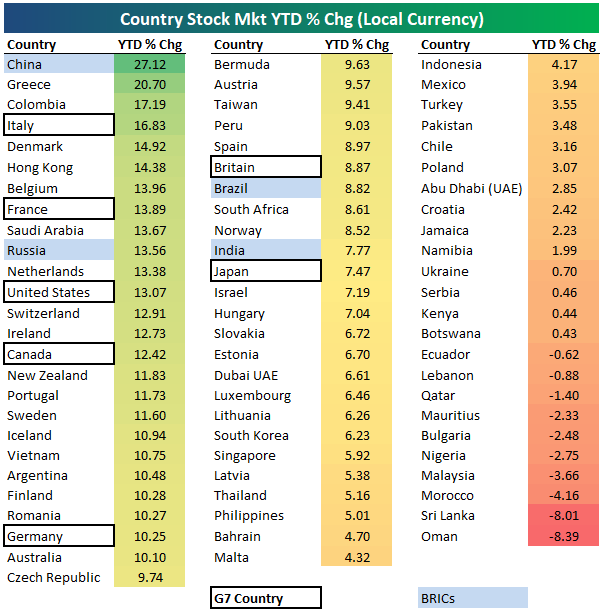
Below we show YTD returns in local currency for 75 equity markets around the world. The average country is up 7.03% YTD with 65 countries posting gains and just 10 posting declines.
China was up the most in Q1 with a gain of 27.12%. Greece ranked second at +20.70%, followed by Colombia (+17.19%), Italy (+16.83%), and Denmark (+14.92%).
Notably, all of the G7 countries rank in the top half in terms of YTD performance. Italy, France, the US, and Canada are the top G7 countries, while Germany, Britain, and Japan are the bottom three.
Of the ten countries in the red this year, Oman and Sri Lanka are down the most at -8%.
First Quarter US Equity Market Recap
Below is a snapshot of total returns across asset classes using key ETFs traded on US exchanges. For each ETF, we show its total return over the last 12 months, year-to-date through Q1, and in March.
In the US, smallcap ETFs like IJR and IWM lagged badly in March, and they’re only up slightly over the last 12 months. Meanwhile, the Nasdaq 100 (QQQ) was up nearly 4% in March and is up 13.2% over the last 12 months.
You’ll also notice that while most international equity market ETFs performed well in Q1, they’re still mostly down over the last year. Germany (EWG) is down more than any other asset class over the one-year time frame.
Below is a snapshot of US sector ETFs from our Trend Analyzer tool. The list is sorted by YTD performance from best to worst. Tech (XLK) led the way in Q1 with a price change of 19.39%. Real Estate (XLRE) ranked 2nd at +16.84%, followed closely by Industrials (XLI) at +16.49%. Financials (XLF) and Health Care (XLV) were the biggest laggards in Q1, but even these two sectors still gained more than 6%.
Beauty company Coty (COTY) was the top performing S&P 500 stock in Q1 with a gain of 75%. Chipotle (CMG) ranked second at +64.5%, followed by Xerox (XRX), Arista Networks (ANET), and Xilinx (XLNX). Who would have guessed that two of the top five performers in Q1 would start with an “X”!
Other notable Q1 winners in the S&P 500 include Celgene (CELG), General Electric (GE), NVIDIA (NVDA), Netflix (NFLX), and Philip Morris International (PM).

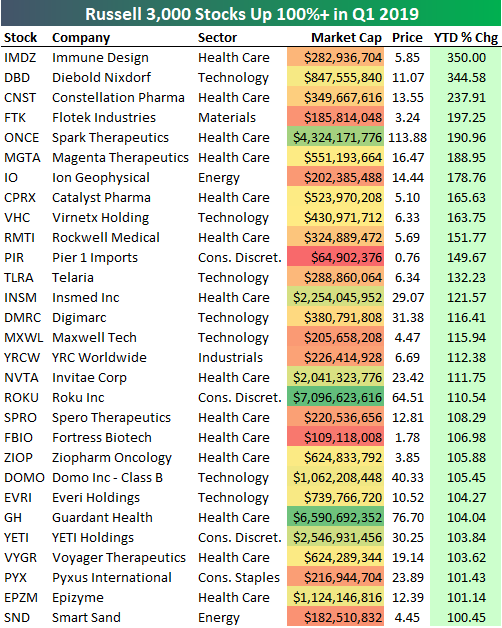
In the broader Russell 3,000 which comprises more than 98% of listed market cap in the US, there were 29 stocks that gained more than 100% in the first quarter. As shown below, Immune Design (IMDZ) was the top performer with a gain of 350%, followed by Diebold Nixdorf (DBD) at +344.58%. Constellation Pharma (CNST) posted the third biggest Q1 gain at +237.91%, while Flotek Industries (FTK) and Spark Therapeutics (ONCE) round out the top five. Other notables on the list of biggest Q1 winners include Insmed (INSM), Roku (ROKU), and YETI Holdings (YETI).
Trend Analyzer – 4/1/19 – First Uptrend
It’s no April Fools joke. Finally, one of the major US index ETFs has re-entered a long-term uptrend according to our Trend Analyzer tool. That index ETF is the Russell Mid Cap (IWR). It is currently the second-best performer of the major index ETFs on a year to date basis with a gain of 16.47%. Small and Mid-caps, in general, are coming off of a very strong push in the final week of March. Each of these indices, except for the Micro-Cap ETF (IWC) and ironically IWR, all saw a gain of over 2.3% last week. Meanwhile, large caps did not head out of Q1 with the same bang. Last week, the Nasdaq (QQQ)—which has been and is still the most overbought ETF of the group—was only up 0.62%, and others like the S&P 100 (OEF) only rose 1%. While large-caps underperformed last week, they’re still predominantly overbought. Currently, eight of the major index ETFs are overbought, each being a large cap index. The lone large-cap that’s not overbought is the Dow (DIA) which joins the remaining six ETFs at neutral. Similarly, IWR is the only small to mid cap that is overbought.

Taking a look at the charts of these ETFs, the trends are a bit more evident. IWR’s uptrend comes as it is the only ETF to have distinctively broken above resistance set in Q4 2018. Still, like the other indices, IWR has been range bound more recently, not continuing its charge higher from earlier in the year with price in recent weeks somewhat stalling out just above these resistance levels.
Bespoke Market Calendar — April 2019
Please click the image below to view our April 2019 market calendar. This calendar includes the S&P 500’s average percentage change and average intraday chart pattern for each trading day during the upcoming month. It also includes market holidays and options expiration dates plus the dates of key economic indicator releases.
