Facebook (FB) Leading FAANGs
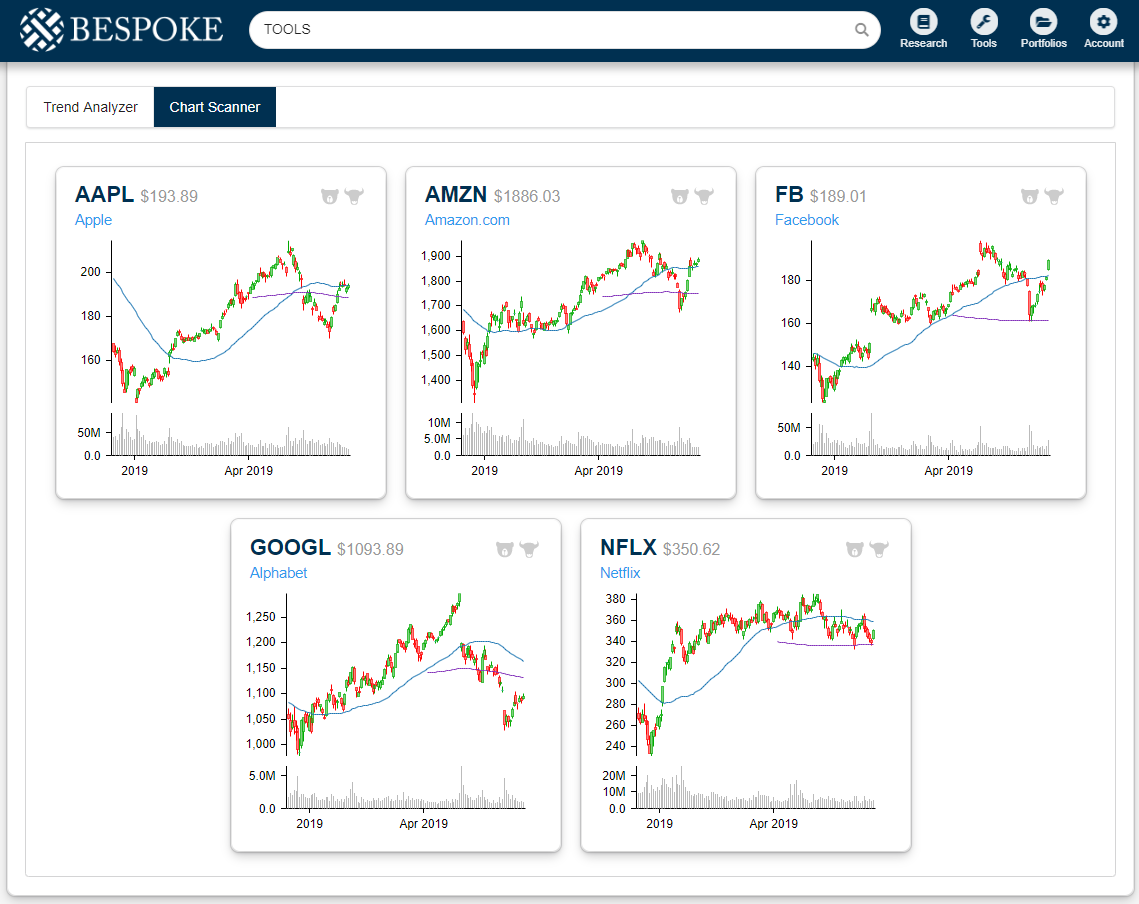
Below is a quick update on the five FAANG stocks as seen through our Trend Analyzer and Chart Scanner tools. As shown, Facebook (FB) has surged 8% over the last week, leaving it up 44% YTD. Given the relentless negativity we hear about the company these days, most people — from Wall Street to Main Street — would be surprised to see the stock up that much in 2019.
Amazon (AMZN) is the only other FAANG stock that’s above its 50-day moving average, while both Alphabet (GOOGL) and Netflix (NFLX) are solidly below their 50-DMAs. Apple (AAPL) is sitting ever slightly below its 50-day by just 2 basis points.

Below are price charts for each of the five FAANG stocks pulled from our Chart Scanner tool that’s available to Premium and Institutional members. Facebook (FB) and Amazon.com (AMZN) are the closest to their prior highs, but they all still have a ways to go before they experience a breakout. Netflix (NFLX) continues to trade in an uncharacteristically tight sideways pattern. Start a two-week free trial to Bespoke Institutional to access our entire suite of investment tools and all of our daily research.
Morning Lineup – Tired of Winning
While the US has been facing its own concerns regarding the state of the economy, there is widespread agreement that conditions are better here than other areas of the world. The latest indication this morning comes out of Europe as ECB President Mario Draghi suggested that “in the absence of improvement…additional stimulus will be required.” It’s great that the US economy is doing relatively well, but it has resulted in central banks around the world taking an easier stance towards monetary policy as the FOMC’s last move was a rate hike. The President is getting tired of all this winning and this morning vented his frustration again on Twitter, saying the latest comments from Draghi were “unfair to U.S.”
Please read today’s Morning Lineup for a recap of Draghi’s comments, the latest inflation data out of Europe, and housing data out of Australia.
Bespoke Morning Lineup – 6/18/19

Markets will face a big test tomorrow as the Fed will announce its latest policy move on interest rates. While it is likely no change to rates is made at the meeting, the market is obviously waiting for clarity as to what will happen going forward. Will the Fed move towards the market and the President (more cuts), or will it try to jawbone the markets closer to its view (fewer cuts)? That’s the big question, and while there is the potential for a volatile market reaction, the VIX is moving to multi-week lows ahead of the meeting. Just this morning, it dropped back below 15 and is now back below its 50-DMA for the first time since early May.

Start a two-week free trial to Bespoke Premium to see today’s full Morning Lineup report. You’ll receive it in your inbox each morning an hour before the open to get your trading day started.
The Closer – Low Vol, Gold Lagging, Empire Flop, IG Bonds Stretched – 6/17/19
Log-in here if you’re a member with access to the Closer.
Looking for deeper insight on markets? In tonight’s Closer sent to Bespoke Institutional clients, we highlight an uncommon occurrence of volatility slamming on the brakes and what has happened in the one other instance we found. As gold runs up near multi-year resistance, we then show how the metal has underperformed over the past decades. Turning to macroeconomic data, we give a reason to doubt today’s weak Empire Manufacturing number. Before finishing with a look at today’s release of Treasury flows, we review corporate credit and the ongoing rally in spreads.

See today’s post-market Closer and everything else Bespoke publishes by starting a 14-day free trial to Bespoke Institutional today!
Seasonality is Brexit and the FOMC’s Fault
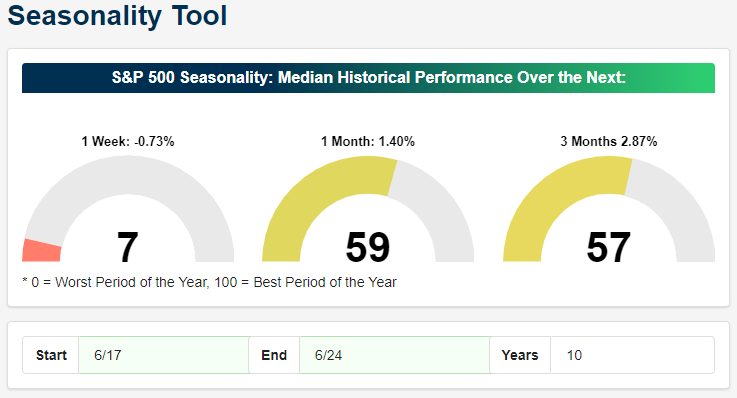
A number of market catalysts are at play this week, with the FOMC decision on Wednesday foremost on traders’ minds. While time will tell if the Fed’s decision and tone send the market higher or lower, seasonality for the current week of the year is not necessarily on the side of the bulls. Back in early May, we highlighted how the week from 5/10 through 5/17 has historically been the weakest one week stretch for the S&P 500 over the last ten years, and sure enough this year the S&P 500 dropped nearly 1% during that period. This week looks to be another one of those weeks. As shown in the charts from our Seasonality Tool below, the week from June 17th through the 24th is one of the worst of the year in terms of the S&P 500’s performance as the index has seen a median loss of 0.73%. While short-term returns haven’t been friendly to bulls, the one and three-month returns have been a little bit friendlier with gains of 1.4% and 2.87%, respectively.
Looking back at the decade, the reason for the underperformance in this specific week has actually been driven by a few significant one-off events. Going back to 2010, just a month after the flash crash and when the economy and markets were still digging themselves out of the financial crisis, a number of factors including uncertainty in Europe, analyst downgrades of banks, and an FOMC statement citing a still-weak economy dragged the S&P 500 3.67% lower from the 17th to the 24th. That was the worst loss for the given week of the year in the past decade. The second worst came in 2013 after the Fed took a different tone and pointed to a more positive outlook as a signal that it could lay off the gas on the easy mone train. That sent the S&P 500 lower by 3.3%. Finally, in 2016, the UK voted on Brexit on June 23rd, and over the following two days, stocks sold off sharply before recovering most of these losses later in the month. While this seasonality only captures some of those Brexit-related losses (on the 25th stocks fell further), in 2016 the S&P fell for a total of 2% from June 17th to the 24th. Turning to this week, the FOMC is more likely to be a factor on market performance than seasonality, but the fact that the seasonal breeze is working against the market doesn’t help. Start a two-week free trial to Bespoke Institutional to access our Seasonality Tool and much more.
IPOs Beating the Market
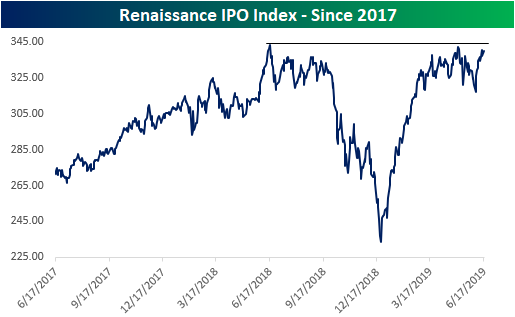
Hot topic stock, Beyond Meat (BYND), has risen over 260% from its IPO just over a month ago. While other recent IPOs have not necessarily matched this rapid appreciation, newly listed companies have for the most part been doing pretty well. The Renaissance IPO Index, which holds the past couple of years largest IPOs, is evidence of this as it has been rapidly moving off of this year’s lower low in the past couple of weeks. On the back of the success of stocks like BYND and Zoom Video (ZM), which both sit handily above their IPO prices, the index is nearing its highs from earlier this year and last. Start a two-week free trial to Bespoke Institutional to access our interactive economic indicators monitor and much more.
Given investors flight into these newly listed companies, IPOs have been increasingly outperforming the S&P 500. The chart below shows the relative strength of the IPO index versus the S&P 500 over the last ten years, and in it, we have also noted points where there were notable companies to hit the market. Periods where the line is rising indicate that the IPO index is outperforming the S&P 500 and vice versa. Over the past ten years, IPOs have cycled through outperformance and underperformance. In the second half of 2013 through late 2015, as well as most of 2017 into late last year, IPOs outperformed. The times between saw underperformance.
One interesting point to note about the chart is that notable and long-awaited IPOs don’t necessarily cause new interest in IPOs or mark any sort of top. For example, Facebook’s (FB) IPO in 2012 came during a period of underperformance and was followed by further underperformance. In 2013, Twitter (TWTR) IPO’d and that IPO was followed by a period of outperformance. In March 2017, Snap (SNAP) had a rough IPO, but the broader IPO market did well. Finally, while Uber (UBER) and Lyft (LYFT) were two widely watched and anticipated IPOs, it has been less eagerly anticipated names like BYND and ZM that have garnered the most investor interest.

Chart of the Day: Gold (GLD) Shining But Needs to Get Through $130
Sector Leadership Traits
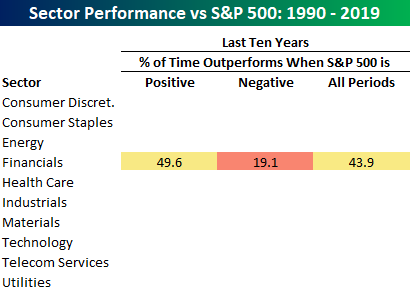
Remember the old axiom that the market couldn’t rally without the Financials? Given the sector’s role in financing the economy, the Financials sector was once considered a leading indicator of the economy and stock market. When the sector did well it was a good sign for the market while declines were an ominous market signal. While that may have been the case in another time, these days the Financials sector has little in the way of a leadership role in the market. In one section of this past weekend’s Bespoke Report, we looked at how sectors performed relative to the market during periods when the market was rising and falling. For each sector, we calculated how frequently it outperformed the S&P 500 during periods when the S&P 500 had risen or fallen in the prior six months.
Using the Financials sector over the last ten years as an example, we found that in six month periods where the S&P 500 has risen, the Financials sector outperformed the S&P 500 slightly less than half of the time (49.6%). In other words, when the market has rallied over the last decade, it has been a coin flip as to whether the Financials outperformed or underperformed the market during the rally. While the Financials sector hasn’t provided much in the way of leadership on the way up, it has certainly been a downside leader. During periods when the S&P 500 saw negative returns over a six-month period, Financials only outperformed the S&P 500 19.1% of the time, meaning it underperformed the S&P 500 over 80% of the time when equities declined! Sectors that provide no outperformance on the way up but underperform on the way down don’t provide much help to a portfolio!
The chart of the S&P 500 below helps to illustrate these trends with the Financials. In the chart, whenever the line is green, it indicates that the Financials sector outperformed the S&P 500 over the trailing twelve months. In practically all of the major market declines over the last ten years, though, green is practically non-existent. Likewise, there are a number of extended periods where the S&P 500 was rising, and there were prolonged absences of green. The market certainly hasn’t had much trouble rallying in the last ten years, and whether the Financials sector was there for the ride hasn’t mattered. Start a two-week free trial to Bespoke Premium to see the full table above which shows the sectors that typically outperform the S&P 500 on the way up and the way down.

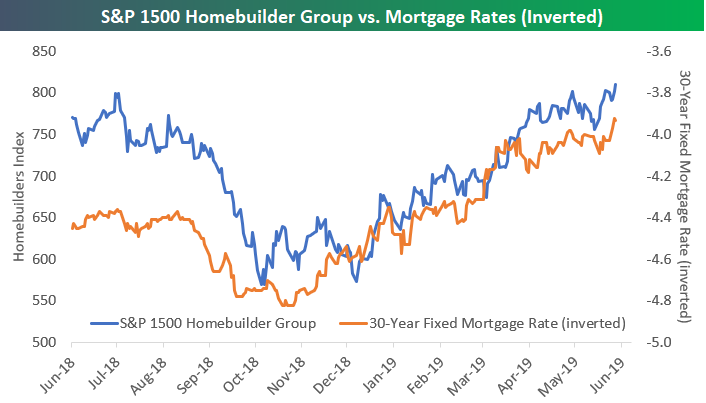
A Banner First Half for Homebuilders as Mortgage Rates Fall
After a very weak second half of 2018 due to rising mortgage rates, the S&P 1500 Homebuilder group has rallied 35% in 2019 to a new 52-week closing high as of last Friday. Below is a chart of the S&P 1500 Homebuilder group vs. an inverted look at Bankrate.com’s 30-year national average fixed mortgage rate. The Homebuilder group bottomed right around the time that mortgage rates peaked, and they’ve been rallying as mortgage rates have been falling.
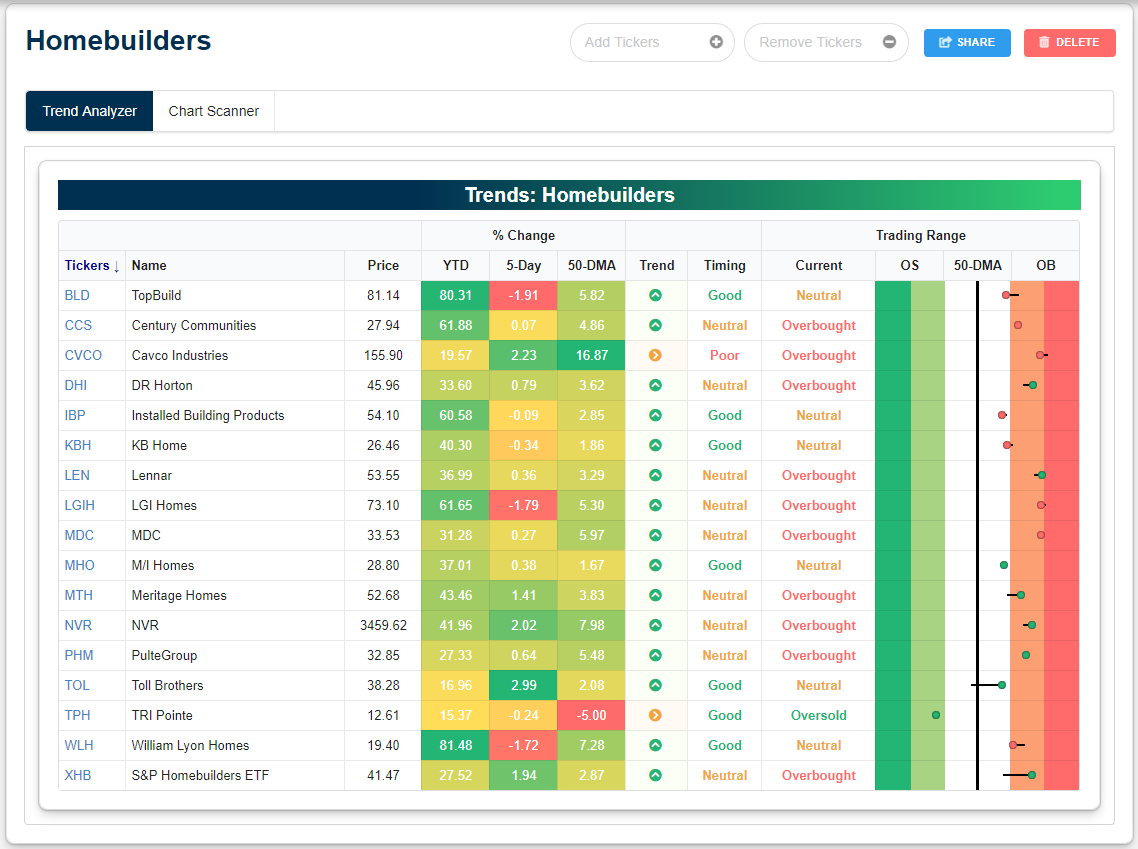
Below is a custom portfolio we’ve built on our website (custom portfolios are available to Premium members and higher) to see how the individual members of the S&P 1500 Homebuilders group look. As you can see, every single stock in the group is up at least 15% year-to-date, with some like TopBuild (BLD), Century Communities (CCS), LGI Homes (LGIH), Installed Building Products (IBP), and William Lyon Homes (WLH) all up more than 60%!
At the moment, all but one of the homebuilder stocks is in a sideways trend or long-term uptrend pattern. The majority are also overbought, meaning they’re currently trading more than one standard deviation above their 50-day moving averages.
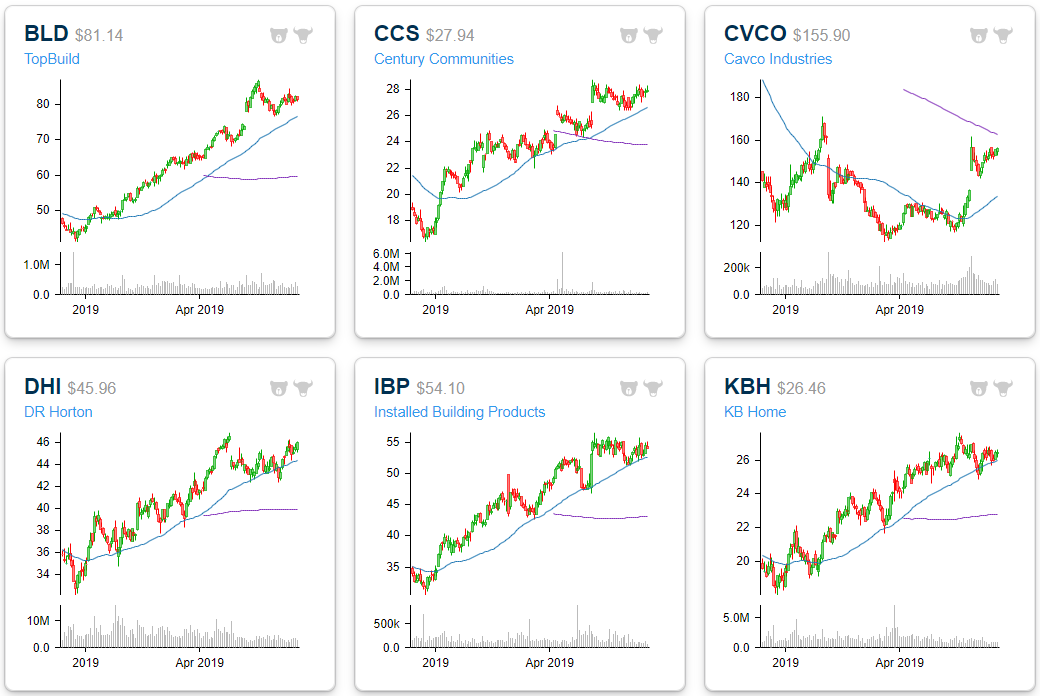
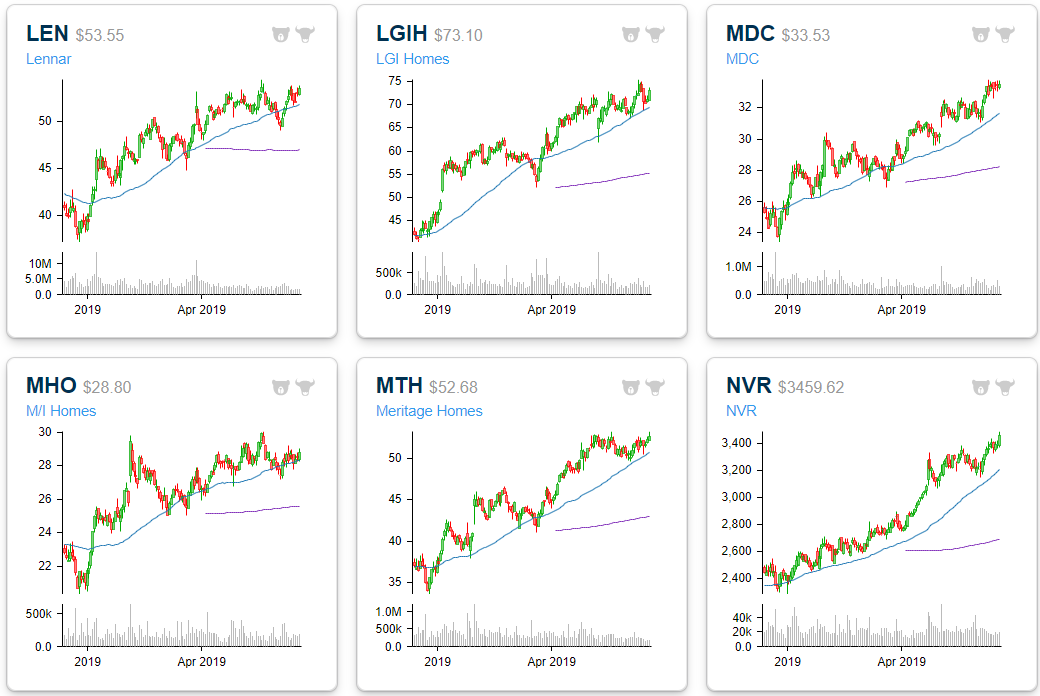
Below we show the individual chart patterns for the homebuilder stocks, which Bespoke Premium members also have access to when they create a custom portfolio. Here you can see that the entire group is made up of mostly bullish chart patterns, with prices trending up and to the right. Most 50-day moving averages (blue lines) are pointed higher, and the 200-day moving averages (purple lines) are starting to turn higher as well. Start a two-week free trial to Bespoke Premium to create your own custom portfolios now and also unlock Bespoke’s premium equity market research.

Record Decline in Empire Manufacturing Report
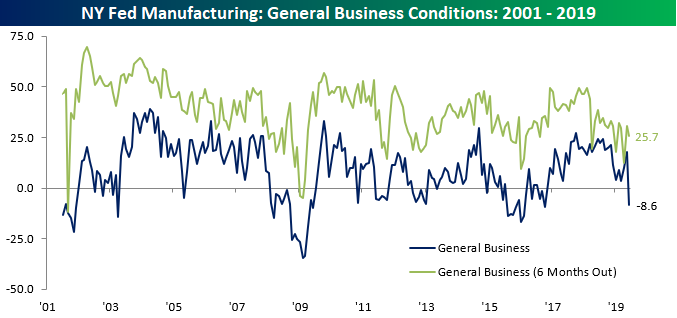
After month/month increases in three of the four prior months, the June Empire Manufacturing report fell and fell hard. While economists were expecting the headline index to drop from 17.8 down to 11.0, the actual decline was much larger sending the headline index down to negative 8.6. With the June decline, the Empire Manufacturing index saw its first negative reading since the 2016 election, the weakest decline relative to expectations since June 2011, and the largest m/m decline in the history of the survey dating back to 2001. One caveat to the decline, however, may be that the temporary trade spat with Mexico may have contributed to the weakness. We’ll have to wait until more data for the month comes in, though, for more clarity on that front.
While current conditions plummeted, the expectations component of the report saw a much more modest decline, falling from 30.6 down to 25.7.
As if the decline in the headline index wasn’t large enough, the text of the report may have been even worse. The first paragraph alone was filled with descriptors like “sharp turn downward,” “plummeted,” “largest monthly decline on record,” “receded,” “fell,” “slightly lower,” “small declines,” “price increases slowed,” and “less optimistic.” On top of that, the titles of the paragraphs that followed were “Growth Abruptly Reverses,” “Employment Shrinks,” and “Futures Indexes Decline.” Happy Monday!
As far as the internals of the report were concerned, every component of the Current Conditions declined except for Prices Paid, while on the Outlook side of the table (Six Months Out), all but two components (Prices Paid and Average Workweek) declined.

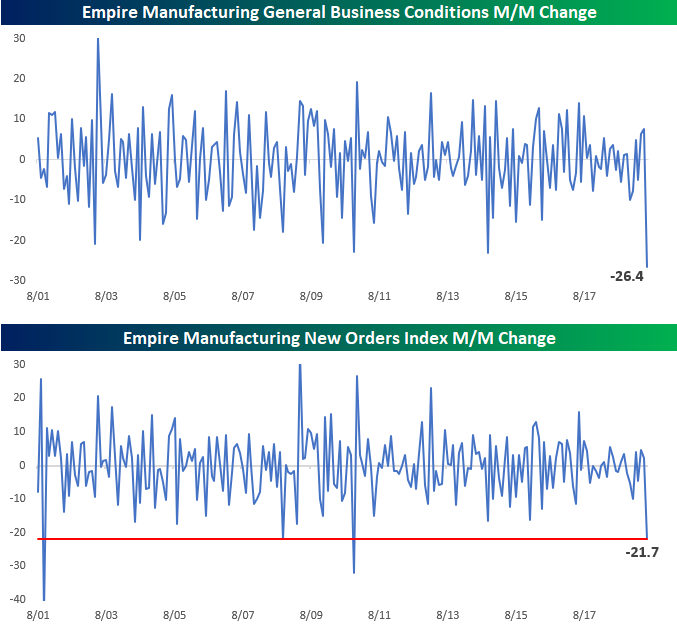
We already mentioned that the headline General Business index saw a record m/m decline, and we highlight that in the first chart below. It wasn’t only the General Business Index that saw a steep decline, though. As shown in the second chart below, the New Orders component also dropped over 20 points, which was the third largest m/m decline on record. The only times the index saw steeper declines were just after 9/11, after the Lehman bankruptcy, and in November 2010. Start a two-week free trial to Bespoke Institutional to access all of our interactive tools and best stock ideas.
Morning Lineup – Marking Time
It’s a big week on tap for financial markets as the FOMC meets on Tuesday and Wednesday. While odds of a cut at this meeting are low, with the probability of a cut at the July meeting still over 80%, investors will be looking for some direction as to whether those high odds are warranted or misplaced. Ahead of the meeting, investors have been pretty much sitting on their hands for the last several days not wanting to take a stand in either direction.
Please read today’s Morning Lineup for a recap of markets in Asia and Europe overnight and this morning, as well as a dive into the latest export numbers out of Singapore, suggesting that global trade activity remains healthy.
Bespoke Morning Lineup – 6/17/19
As mentioned above, investors have been on the sidelines over the last few days ahead of this Wednesday’s FOMC meeting, and the chart below from page two of the Morning Lineupillustrates that holding pattern. The fact that the S&P 500 and just about every sector have little or no tails on them indicates how little in the way of movement there has been over the last week.

Start a two-week free trial to Bespoke Premium to see today’s full Morning Lineup report. You’ll receive it in your inbox each morning an hour before the open to get your trading day started.