Retail Soars, Mall REITs Stumble
So far this week, second-quarter results for major US retailers have been generally positive. Yesterday saw solid results from the likes of TJX (TJX) and Home Depot (HD) and this morning Lowe’s (LOW) and Target (TGT) are looking at their largest gap up in response to earnings since at least 2001.
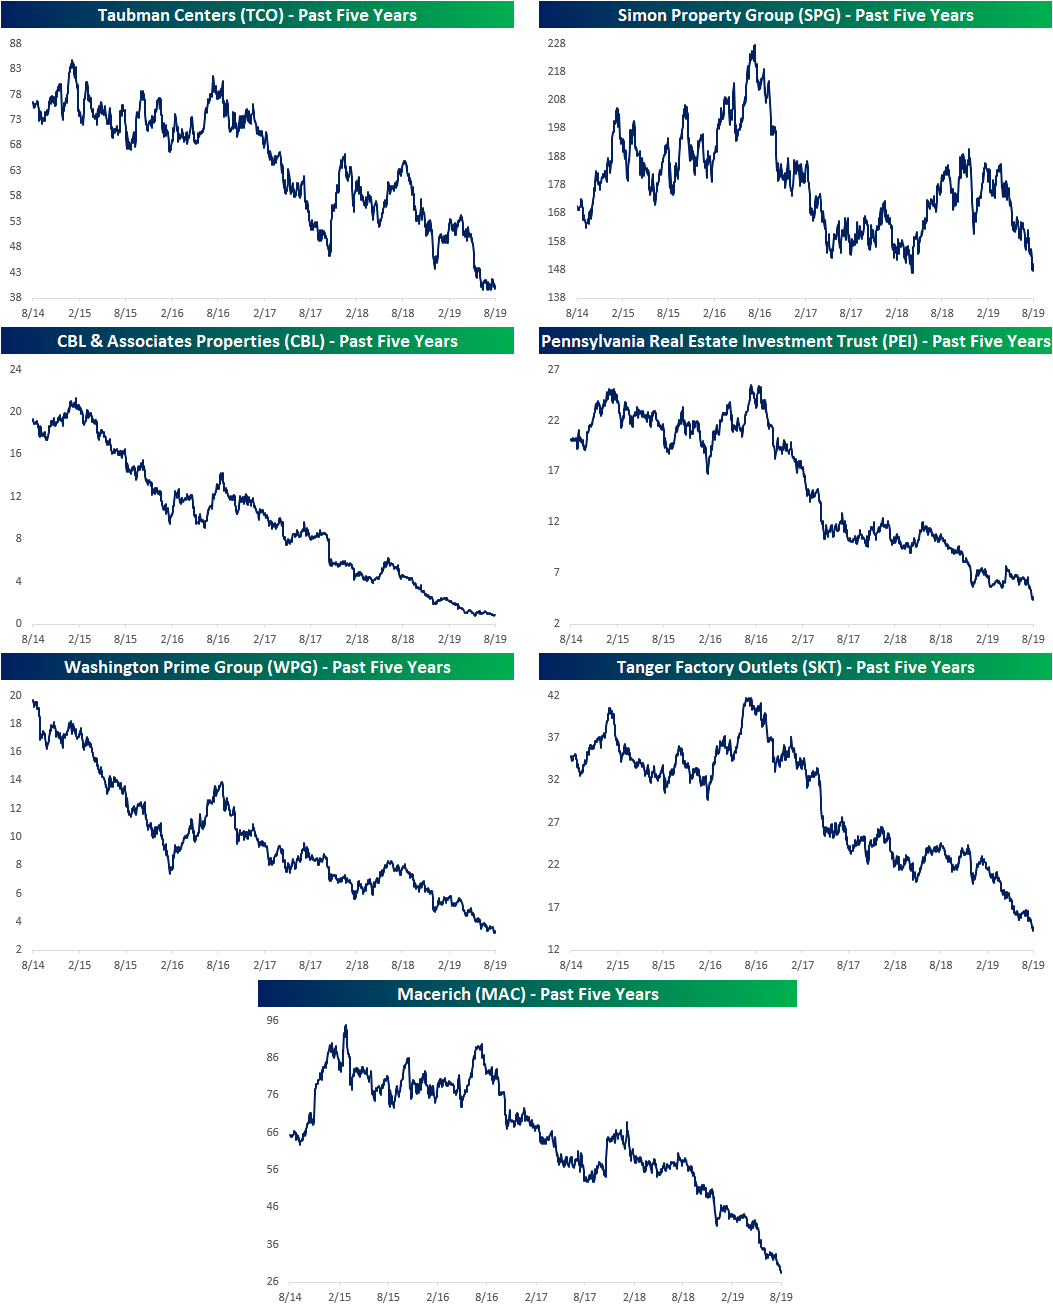
Despite this strong price action from retailers, an adjacent group, shopping center REITs, has continued to suffer. If you want to see some truly awful long-term price charts, these have you covered.
Below we show the charts of a handful of REITs with a particular focus on shopping centers. Each one is in a long-term downtrend over the past five years and is currently around the lows of this timeframe. The worst of these has been CBL & Associates (CBL) which has fallen 96% over the past five years! Meanwhile, Washington Prime (WPG) and Pennsylvania REIT (PEI) have both lost over 75% of their value. While performance is still not good, Simon Property Group (SPG) has held up relatively well compared to its peers, only declining 13.4%. The rest have fallen around 50%.
Given the stocks’ decimated price over the past few years, dividend yields of this group have become astronomical. CBL & Associates (CBL), Pennsylvania REIT (PEI), Washington Prime (WPG) and Macerich (MAC) each have double-digit dividend yields. CBL and WPG’s yields are actually now over 30%! Unfortunately, none of these yields are likely to remain high as future dividend cuts are all but certain. Start a two-week free trial to one of Bespoke’s premium equity market research services.
Bespoke’s Global Macro Dashboard — 8/21/19
Bespoke’s Global Macro Dashboard is a high-level summary of 22 major economies from around the world. For each country, we provide charts of local equity market prices, relative performance versus global equities, price to earnings ratios, dividend yields, economic growth, unemployment, retail sales and industrial production growth, inflation, money supply, spot FX performance versus the dollar, policy rate, and ten year local government bond yield interest rates. The report is intended as a tool for both reference and idea generation. It’s clients’ first stop for basic background info on how a given economy is performing, and what issues are driving the narrative for that economy. The dashboard helps you get up to speed on and keep track of the basics for the most important economies around the world, informing starting points for further research and risk management. It’s published weekly every Wednesday at the Bespoke Institutional membership level.
You can access our Global Macro Dashboard by starting a 14-day free trial to Bespoke Institutional now!

Trend Analyzer – 8/21/19 – Nasdaq (QQQ) Back Below Its 50-Day
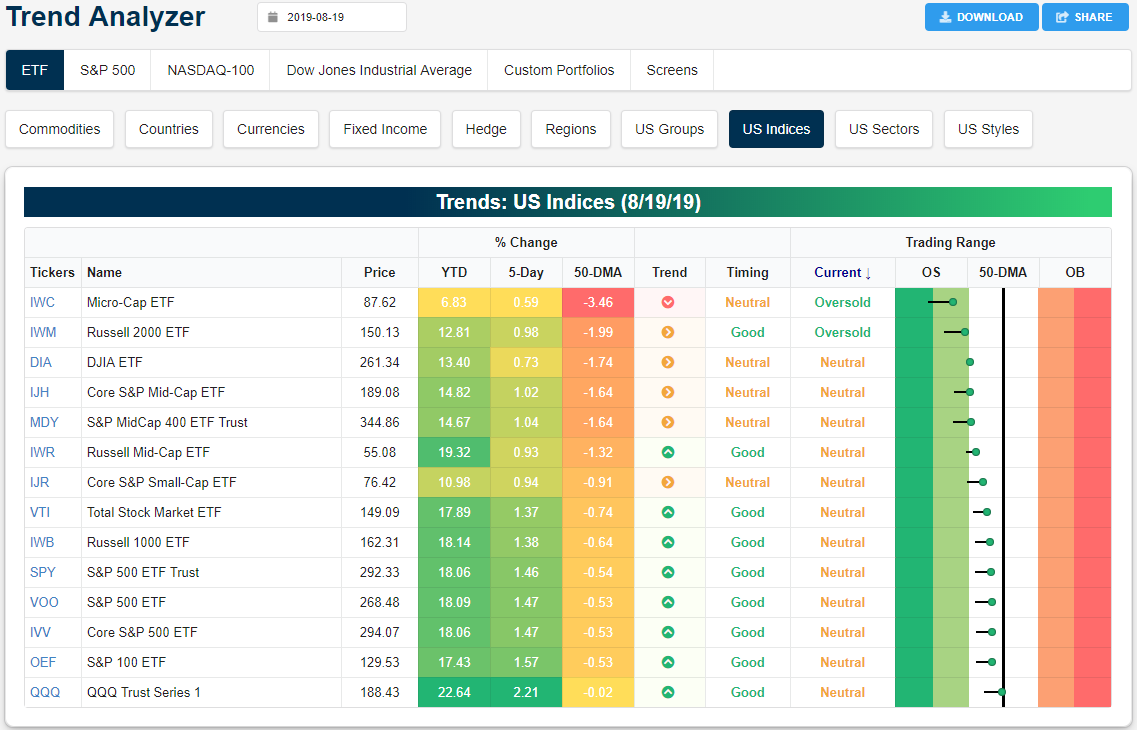
Declines yesterday left the major US index ETFs all below their 50-day moving averages. As shown in our Trend Analyzer snapshot below, about half of them are oversold while the other half are in neutral territory. With equity futures pointed higher this morning, we’ll see if any of these ETFs can regain their 50-day moving averages by the end of the trading day.
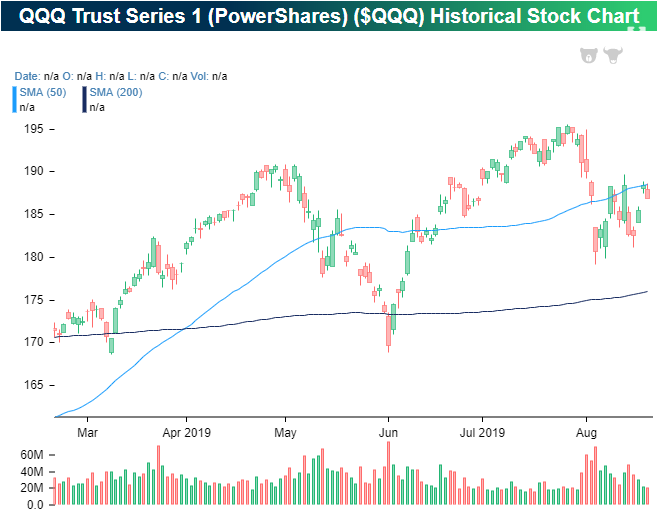
For the Nasdaq (QQQ), yesterday’s move lower marked yet another failed attempt to break and hold above its 50-DMA. Since reaching a low on August 5th, the ETF has made multiple attempts to retake the 50-DMA without any considerable push above these levels. With QQQ trading up 1% ahead of today’s open, we’ll get yet another test of the 50-day shortly. Bulls will be looking for resistance at the 50-day to finally break. Start a two-week free trial to Bespoke Institutional to access our Chart Scanner and much more.
Bespoke’s Morning Lineup — Retail Rocks
See what’s driving market performance around the world in today’s Morning Lineup. Bespoke’s Morning Lineup is the best way to start your trading day. Read it now by starting a two-week free trial to Bespoke Premium. CLICK HERE to learn more and start your free trial.

The Closer – Market Roundup, Canadian Data – 8/20/19
Log-in here if you’re a member with access to the Closer.
Looking for deeper insight on markets? In tonight’s Closer sent to Bespoke Institutional clients, as crude oil fails to break out, we show the ominous head and shoulders pattern in copper futures. We also show how gold’s rally has been consistent with the drop in the 10-year yield. Next, we review the break down in the tracking of bank stocks and preferred securities while the market prices in significant rate cuts over the next two years. Since retail was the only industry group to finish the day higher, we show forward performance following similar instances before finishing with a look at some Canadian economic data.

See today’s post-market Closer and everything else Bespoke publishes by starting a 14-day free trial to Bespoke Institutional today!
Chart of the Day: Refinancing Flush Foments Furnishings?
B.I.G. Tips – Turn in the Seasonal Trend on the Horizon
Our Seasonality tool is a great way for investors and traders to gauge seasonal patterns for both the overall market and individual stocks. In the tool, users can create custom screens for different time periods to see which stocks have performed the best and worst over a given time period. At the top of the tool each day, we include gauges like the one below which shows the S&P 500’s median historical performance over the upcoming week, month, and quarter. When the reading on the gauge is low, it indicates that the upcoming week, month, or quarter ranks near the bottom relative to all other similar periods throughout the year, while higher readings indicate that the performance ranks high relative to all other periods.
As shown in the current one-week gauge, seasonal patterns suggest that the upcoming week isn’t one of the best weeks of the year. Over the last ten years, the S&P 500’s median return of 0.07% ranks in just the 38th percentile relative to all other one week periods. While still a positive return, the performance is nothing to write home about.

While the upcoming week has been a period of ho-hum returns for the market, the upcoming one and three month periods have historically been much closer to extremes relative to all other periods, and in our latest B.I.G. Tips report, we provided a detailed look at market seasonality in the upcoming one and three month periods. In it, we have also included a look at which ETFs have historically followed and bucked the seasonal trend during this period.
For anyone with more than a passing interest in the market’s seasonal patterns, this report is a must-read. To see it, sign up for a monthly Bespoke Premium membership now!
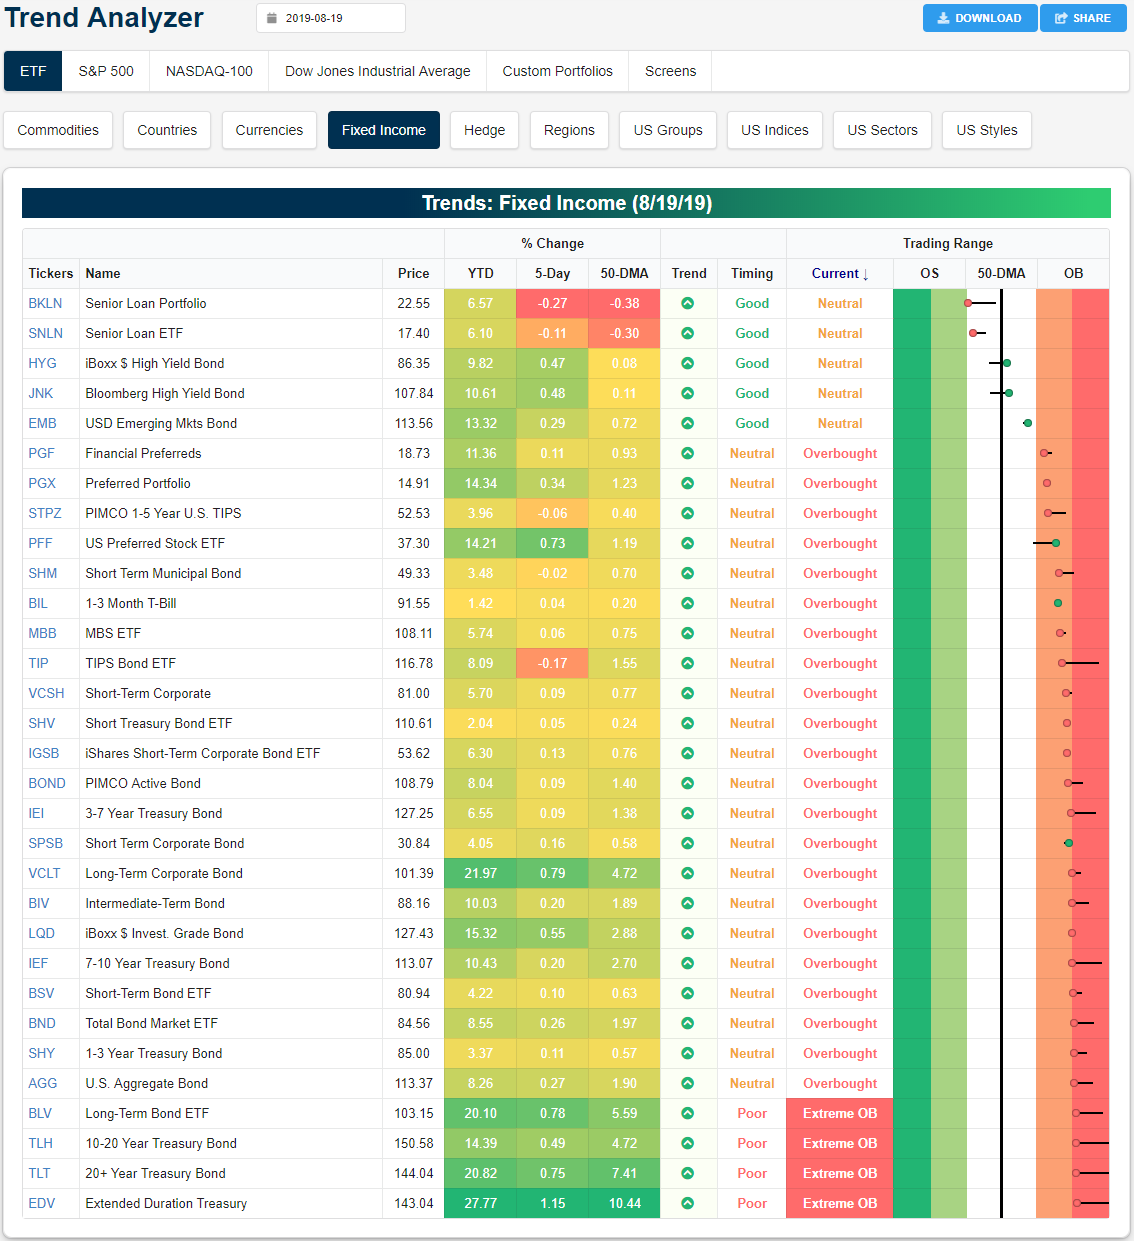
Trend Analyzer – 8/20/19 – Fixed Income Coming Back
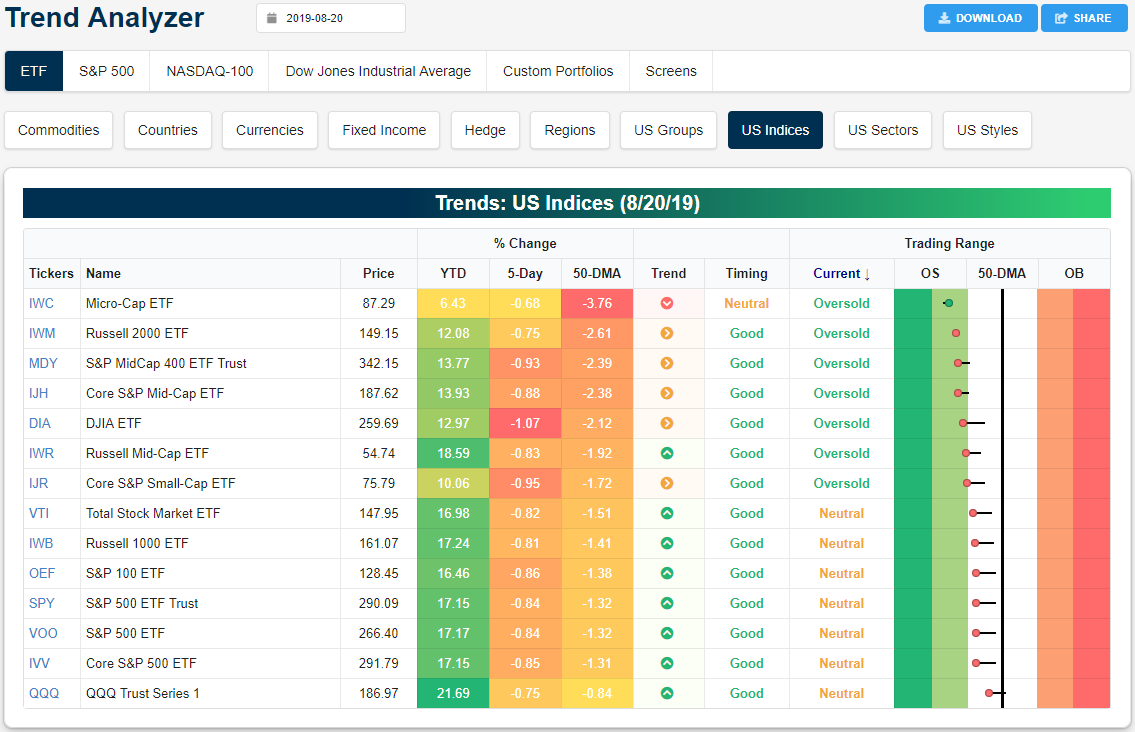
Stocks have managed to continue their move higher which has lifted almost all of the major index ETFs out of their oversold levels. Of the 14 index ETFs in our Trend Analyzer, only the Micro-Cap ETF (IWC) and Russell 2000 (IWM) are still oversold. IWC is also the furthest below its 50-DMA at 3.46% as of yesterday’s close. The Nasdaq 100 (QQQ) has surged 2.21% in the past week which has brought it to within 2bps of its 50-DMA. QQQ has seen the best performance in the past week, but other large-cap indices have also seen solid gains of more than 1%. Small and mid-caps on the other hand, although still positive, are underperforming.
While index ETFs have worked off their oversold readings, fixed income remains broadly overbought, but only a handful are more overbought than they were this time last week. Of the over 30 fixed income ETFs in our Trend Analyzer, only five are in neutral territory while the rest are overbought. Four of these that are overbought—mostly ETFs tracking longer-term bonds—are over 2 standard deviations above the 50-DMA. Despite fixed income largely being overbought, the two senior loan ETFs (BKLN and SNLN) are teetering on oversold levels and are the only two fixed-income ETFs below their 50-DMA. Finally, with investors beginning to come back to riskier assets, iBoxx High Yield (HYG) and Bloomberg High Yield (JNK) have moved back above their 50-DMAs. Start a two-week free trial to Bespoke Institutional to access our interactive trend analyzer and much more.
Bespoke’s Morning Lineup — Yields Back on the Decline
See what’s driving market performance around the world in today’s Morning Lineup. Bespoke’s Morning Lineup is the best way to start your trading day. Read it now by starting a two-week free trial to Bespoke Premium. CLICK HERE to learn more and start your free trial.
The Closer – Market Observations, Recession Odds – 8/19/19
Log-in here if you’re a member with access to the Closer.
Looking for deeper insight on markets? In tonight’s Closer sent to Bespoke Institutional clients, given the movement in rates and the SPY, we begin by showing forward performance following similarly large moves. We also take a look at the break out of the dollar. We finish with an update on our probit regressions based on USTs and economic data which are forecasting two very different outcomes.
See today’s post-market Closer and everything else Bespoke publishes by starting a 14-day free trial to Bespoke Institutional today!