Bespoke’s Brunch Reads: 5/28/23
Welcome to Bespoke Brunch Reads — a linkfest of the favorite things we read over the past week. The links are mostly market related, but there are some other interesting subjects covered as well. We hope you enjoy the food for thought as a supplement to the research we provide you during the week.
While you’re here, join Bespoke Premium with a 30-day trial!
Social (Anti-Social)
How Duolingo Grew Its TikTok to 6.6M Followers (Digital Native)
Duolingo has one of the savviest corporate social presences on TikTok. Here’s a profile of the person who is responsible for it all. [link]
‘Citi Bike Karen’ viral video shows why we shouldn’t rush to judgment (USA Today)
When it comes to viral videos, things aren’t always as they seem. One pregnant woman, who was the victim of a crime, appears to have had her career and reputation tarnished over accusations of racism. [link]
Whistleblower Drops 100 Gigabytes of Tesla Secrets To German News Site: Report (Jalopnik)
“The Tesla files contain more than 2,400 self-acceleration complaints and more than 1,500 braking function problems, including 139 cases of unintentional emergency braking.” For perspective, the files date back to 2015 covering a period where Tesla delivered around 2.6 million vehicles. [link]
Virginia Tech researchers conduct proof-of-concept study on mosquito scent preferences (Virginia Tech)
Just in time for mosquito season, a Virginia Tech study found that the pests are attracted to certain scents of soap. One fragrance they’re not attracted to is coconut. [link]
Economy
Colorado’s cannabis industry has fallen on hard times. What does the future hold? (Denver Post)
Now that marijuana has been legalized in many more states, Colorado is no longer the weed mecca it once was, and the industry there has been falling on hard times. [link]
Nine Rounds of Interviews and No Call Back: It’s Harder Than Ever to Land a White Collar Job (WSJ)
After years of breakneck hiring during the Covid-19 pandemic, white-collar job seekers are feeling whiplash. “Everybody’s being extra-cautious,” she says. “A lot of companies have gotten burned.” [link]
How some people get away with doing nothing at work (VOX)
“I don’t have a problem with being asked to do work; it’s just I’m not really being asked”. This story covers workers who are ‘funemployed’ in that they sit at work all day with little to do. The best part of this article is the url address. Take a look. [link]
Half-Empty a Year Ago, Cruises Are Now Packed Like Sardines (WSJ)
For all the people who said people would never cruise again after COVID, ships are now routinely fully booked to the point where in some cases passengers have to be bumped. Not out at sea we hope! Prices are also higher. The average five-night cruise in an inside cabin is $743 which is up from $551 a year ago. [link]
Retailers Clamp Down on Returns (WSJ)
It costs an average of $26.50 for every hundred dollars worth of goods sold to process a return, which costs retailers millions. Some are fighting back. [link]
Why the Debt-Ceiling Deadline Isn’t Really June 1 (Barron’s)
Not to give politicians any more excuses to delay, this article provides a good explainer for why June 1st may not actually be the X-day that Treasury Secretary Yellen said it would be. [link]
France bans short-haul flights to cut carbon emissions (BBC)
To cut down on greenhouse gases, France will prohibit any flight where the option of a train ride of fewer than 2.5 hours exists. [link]
Fashion
J.N. Shapiro Debuts the First Fully American-Made Watch in Over 50 Years (Robb Report)
The trend of onshoring is even moving into the premium watch industry. J.N. Shapiro is the first watchmaker since 1969 that can say their timepieces are “Made in the USA”. You can get either of the 18-karat gold versions for $85,000. [link]
Science and Technology
JPMorgan is developing a ChatGPT-like A.I. service that gives investment advice (CNBC)
ChatGPT is coming for your financial advisor. The next time you seek out financial advice, it may not be the person that you turn to. [link]
AI Will ‘Exceed Expert Skill Level in Most Domains’ in 10 Years: OpenAI (Decrypt)
ChatGPT has only been around for six months, but some experts believe it will outsmart them and experts in other industries within ten years. [link]
Incredibly Detailed Close-Ups of the Sun From Earth’s Most Powerful Solar Telescope (SciTech Daily)
The National Science Foundation (NSF) released eight new photos of the sun from the Daniel K. Inouye Solar Telescope and they look like molten gold. [link]
Ford EV Customers to Gain Access to 12,000 Tesla Superchargers (Ford)
In a sign that charging protocols for EVs may be starting to standardize, certain Ford EVs will now have access to Tesla Superchargers. Increased adoption of one standard will only accelerate the shift to EVs. [link]
Elon Musk’s Neuralink Says It Has FDA Approval for Study of Brain Implants in Humans (WSJ)
Ever feel like you could use a new brain? Well, those days may not be far off. Elon Musk’s Neuralink has received approval from the FDA to begin testing a brain implant to control computer interfaces and restore vision. [link]
Can multivitamins improve memory? A new study shows ‘intriguing’ results (NPR)
People taking the multivitamin were able to recall about a quarter more words, which translates into remembering just a few more words, compared to the placebo group. “We estimate that the effect of the multivitamin intervention improved memory performance above placebo by the equivalent of 3.1 years of age-related memory change”. [link]
Sports
One of the NFL’s Most Exciting Plays Is Trending Toward Extinction (WSJ)
Baseball isn’t the only league with major rule changes this season. This Fall the NFL will allow kick returners to call fair catch anywhere inside the 25-year line and take the ball at the 25 which will only cut down on the number of kickoff returns even more. [link]
Read Bespoke’s most actionable market research by joining Bespoke Premium today! Get started here.
Have a great weekend!
The Bespoke Report – 5/26/23 – Not Just Mega Cap Tech
This week’s Bespoke Report newsletter is now available for members. (Log in here if you’re already a subscriber.)

Continue reading this week’s Bespoke Report newsletter by starting a one-month trial, or click the image below to view our membership options page.

Tech In Orbit
The S&P 500 has been closing in on new 52-week highs as the index gains another 1.3% headed into the long weekend. Although the index has been moving higher, looking at relative strength lines across the S&P’s eleven sectors, it would be hard to tell. Indicating what has broadly been mediocre breadth at best, the only two sectors with relative strength lines that are currently moving higher are Tech and Communication Services. The former has made a vertical move higher over the past few days in the wake of the surge in NVIDIA (NVDA), while the climb in Communication Services has been more steady. As for the other sectors, relative strength lines have been falling off a cliff for everything except Consumer Discretionary, which has been flat.

Again, Tech has led the way higher with a sharp move this week. The sector is now extremely overbought, trading 3.23 standard deviations above its 50-DMA; the fifth most overbought reading on record. Since 1990, there have only been a handful of times in which the S&P 500 Tech sector has traded at least 3 standard deviations overbought, with the most recent being roughly six years ago. But to find the last time the sector was as extended as it is today, you’d have to go all the way back to early 2004!

Have you tried Bespoke All Access yet?
Bespoke’s All Access research package is quick-hitting, actionable, and easily digestible. Bespoke’s unique data points and analysis help investors better visualize underlying market trends to ultimately make more informed investment decisions.
Our daily research consists of a pre-market note, a post-market note, and our Chart of the Day. These three daily reports are supplemented with additional research pieces covering ETFs and asset allocation trends, global macro analysis, earnings and conference call analysis, market breadth and internals, economic indicator databases, growth and dividend income stock baskets, and unique interactive trading tools.
Click here to sign up for a one-month trial to Bespoke All Access, or you can read even more about Bespoke All Access here.

Bespoke’s Morning Lineup – 5/26/23 – Let the Summer Fridays Begin
See what’s driving market performance around the world in today’s Morning Lineup. Bespoke’s Morning Lineup is the best way to start your trading day. Read it now by starting a two-week trial to Bespoke Premium. CLICK HERE to learn more and start your trial.
“Only two things are infinite, the universe and human stupidity, and I’m not sure about the former.” – Albert Einstein

Below is a snippet of content from today’s Morning Lineup for Bespoke Premium members. Start a two-week trial to Bespoke Premium now to access the full report.
Futures are off their lows of the morning and trading in positive territory on reports that negotiators in Washington are close to a deal on the debt ceiling that could be voted on next week. Throughout this whole saga, there have been several false alarms, so some healthy skepticism is warranted. Ultimately, the debt ceiling will be raised and this whole charade will be out of the headlines until it comes up again in a couple of years. Next up for the markets is dealing with the surge of issuance that will follow in the coming months.
In the near term, Fridays are likely to get a lot quieter in the coming months, but even though we’re heading into a holiday weekend, there’s still a lot of economic data on the calendar with Personal Income, Personal Spending, PCE, Wholesale Inventories, Durable Goods, and Michigan Confidence. Buckle up. Get ready. And enjoy the first weekend of summer.
Regarding the current state of the market, the picture on the surface looks the opposite of what’s going on below the surface. Starting with the S&P 500, after hitting a high for the year last Friday, stocks have experienced a bit of a pullback this week. If it weren’t for NVIDIA (NVDA) on Thursday, the S&P 500 would probably be heading into today on a four-day losing streak. Still, as shown in the chart of SPY below, we’re only a little more than 1% from the high price for the year, so at this point, the pullback looks like nothing more than a scratch.

At the sector level, though, the picture looks nothing like it does at the index level. Just two sectors are up since last Thursday’s close, and the remaining nine sectors are all down over 1% with five of them down over 2.5%. Not only that but six sectors are trading at oversold levels. The fact that most sectors are oversold, and only three sectors are above their 50-day moving average (DMA) isn’t the picture you would think of if someone told you that the S&P 500 was 1% from its high for the year.

Start a two-week trial to Bespoke Premium to read today’s full Morning Lineup.
Chart of the Day – Semis Back on the New High List
Bespoke’s Morning Lineup – 5/25/23 – Nvidia’s Wild Night
See what’s driving market performance around the world in today’s Morning Lineup. Bespoke’s Morning Lineup is the best way to start your trading day. Read it now by starting a two-week trial to Bespoke Premium. CLICK HERE to learn more and start your trial.
“The age of AI is in full throttle.” – Jensen Huang
Below is a snippet of content from today’s Morning Lineup for Bespoke Premium members. Start a two-week trial to Bespoke Premium now to access the full report.
The above quote from NVIDIA (NVDA) CEO Jensen Huang wasn’t from last night’s conference call, but the keynote speech of the company’s GTC conference in 2020 – three years ago. If AI was in full throttle back then, where is it now?
While we’ve been on recession watch for the US economy, this morning, we got news that the German economy has now moved into recession territory as Q1 GDP was revised to a decline of 0.3% following Q4’s contraction of 0.5%. Despite the recession in Europe’s largest economy, ECB policymakers are out this morning calling for more rate hikes to combat rising wages. Equity markets in Europe are lower across the board, but only fractionally.
In the US, the debt standoff continues, and Fitch weighed in this morning by placing the AAA rating of US debt on credit watch for a possible downgrade. It’s been a busy morning for economic data, including GDP, jobless claims, Personal Consumption, and Core PCE, and they all came in higher than expected except for jobless claims which were both lower than expected. All of these reports suggesting stronger-than-expected growth aren’t good if you’re hoping for the Fed to pause, but as of now, futures haven’t reacted much. Dow futures are lower while Nasdaq futures are surging thanks to the surge in NVDA.
The overnight move in NVDA reminds us of the Lenin quote, “There are decades where nothing happens; and there are weeks where decades happen.” Words really can’t describe the move in NVDA overnight. While the company has been public for well over 20 years now, a quarter of its entire market value has come in the last 17 hours!
With the stock trading up over 27% in the pre-market, it isn’t on pace to be the best performer in reaction to earnings this season. However, it would be just one of 18 (out of thousands of stocks that have reported) to rally 25% in reaction to its earnings report. What is remarkable, though, is how NVDA’s market cap compares to the other stocks that have surged 25% in reaction to their earnings reports.
As shown in column four of the table below, NVDA had a market cap of $755.24 billion before reporting earnings yesterday. Of the 17 other stocks that rallied over 25% in reaction to earnings, none has a market cap of even $10 billion, and those market caps include the impact of the 25%+ move. At the opening today, NVDA will have a market cap of closer to a trillion! The combined market cap of the 16 other companies that rallied 25% in reaction to earnings is $27 billion, but this morning alone, NVDA’s market cap will increase by more than 9 times that.

Start a two-week trial to Bespoke Premium to read today’s full Morning Lineup.
Chart of the Day – More Participation Trophies Ahead?
Bespoke’s Morning Lineup – 5/24/23 – European Hangover
See what’s driving market performance around the world in today’s Morning Lineup. Bespoke’s Morning Lineup is the best way to start your trading day. Read it now by starting a two-week trial to Bespoke Premium. CLICK HERE to learn more and start your trial.
“There is no subtler, no surer means of overturning the existing basis of society than to debauch the currency.” – John Maynard Keynes
Below is a snippet of content from today’s Morning Lineup for Bespoke Premium members. Start a two-week trial to Bespoke Premium now to access the full report.
You may be looking at the drop in futures and think that there has been some bad news regarding the debt ceiling. Since there has been no breakthrough agreement on that front, the lack of progress is probably playing a partial role, but the real culprit appears to be the hotter-than-expected inflation reading in the UK. That report has both the FTSE 100 and Europe’s STOXX 600 down sharply and trading below their 50-day moving averages.
Here in the US, investors will continue to watch DC for signs of where negotiations over the debt ceiling are going, but other than the Fed Minutes at 2 PM, there are no significant economic data releases on the calendar, so given that European stocks have been leading things lower, it will be hard for bulls to make any headway while those markets remain open for trading.
Getting back to the UK inflation report, economists were forecasting headline inflation to rise 8.2% which would have been a nearly two-percentage point decline relative to March’s reading of 10.1%. The actual reading, however, came in 0.5 percentage points higher at 8.7%. Outside of the last year when every other reading was higher than April’s, it was the highest y/y reading since May 1982 and came up just shy of falling below the peak of 8.4% from June 1991. If there could ever be a way during a period when high inflation was the market’s major concern that a 52-week low reading in inflation would not be considered a good thing, this was it.

Regarding the UK, we wanted to look at how UK stocks have performed relative to the US over the long term. Even though it’s spring, the first thing that comes to mind is skiing. The chart below shows the relative strength of the MSCI United Kingdom ETF (EWU) versus the S&P 500 SPDR ETF (SPY) over the last ten years. For much of this period, it has been a straight downhill for UK stocks relative to the US. Over the last two years, though, the slope has flattened out, and the two ETFs have essentially performed in line with each other (lower chart). While bulls on international stocks may be hoping the last two years have been the early stages of a base to rally from, more inflation prints like today’s could signal more downhill ahead.

Start a two-week trial to Bespoke Premium to read today’s full Morning Lineup.
Fixed Income Weekly: 5/24/23
Searching for ways to better understand the fixed income space or looking for actionable ideas in this asset class? Bespoke’s Fixed Income Weekly provides an update on rates and credit each week. We start off with a fresh piece of analysis driven by what’s in the headlines or driving the market in a given week. We then provide charts of how US Treasury futures and rates are trading, before moving on to a summary of recent fixed income ETF performance, short-term interest rates including money market funds, and a trade idea. We summarize changes and recent developments for a variety of yield curves (UST, bund, Eurodollar, US breakeven inflation and Bespoke’s Global Yield Curve) before finishing with a review of recent UST yield curve changes, spread changes for major credit products and international bonds, and 1 year return profiles for a cross section of the fixed income world.
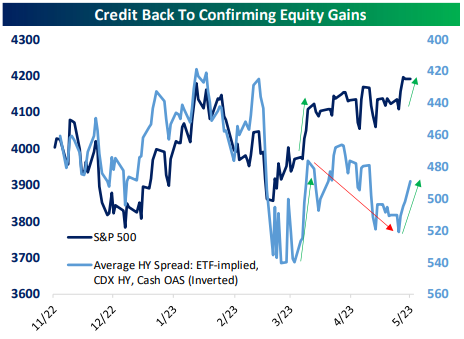
In this week’s report, we discuss the performance of credit in a cross-asset context.
Our Fixed Income Weekly helps investors stay on top of fixed-income markets and gain new perspectives on the developments in interest rates. You can sign up for a Bespoke research trial below to see this week’s report and everything else Bespoke publishes free for the next two weeks!
Click here and start a 14-day free trial to Bespoke Institutional to see our newest Fixed Income Weekly now!