Average ARK Innovation (ARKK) Stock Down 70% From 5-Year High
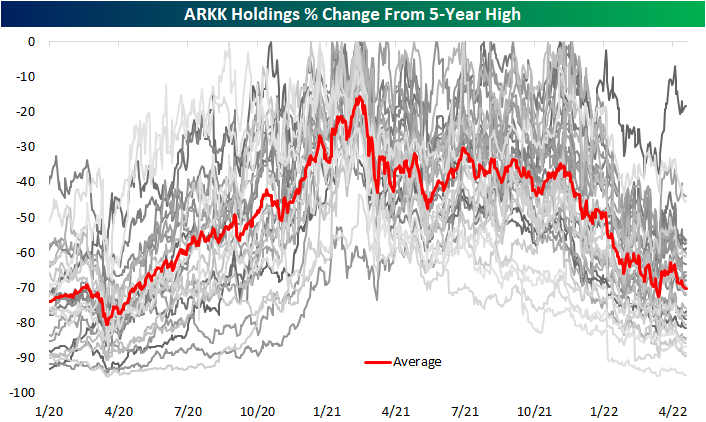
While it is seeing a large bounce today currently up 5% as of this writing, Cathie Wood’s flagship fund, the ARK Innovation ETF (ARK), has had a rough go of it over the past year and change. The ETF peaked in February of last year and has fallen over 60% in the months since then, erasing the entirety of the post-pandemic rally. As for the current holdings making up the ETF, everything has pulled back from post-pandemic highs which were mostly set either in early 2021 or late 2021. To highlight this, in the chart below we show each current holding’s change (in percentage terms) from its respective 5-year high. The average holding is currently down over 70% from its high. (ARKK holdings are released daily at ARK’s website.)
Below is a snapshot of current ARKK holdings and where they’re trading relative to 5-year highs. Year to date, only one stock in the ARKK ETF, Signify Health (SGFY), has managed a positive move as the average YTD decline currently stands at 40.8%. That being said, SGFY is still down over 60% versus its February 2021 high. As previously mentioned, most other holdings similarly peaked in the first quarter of last year while many others peaked more recently last fall. As shown in the table, the average peak date for all ARKK holdings was 3/11/21.
One of the stocks that hit a high last fall is the mega-cap EV giant Tesla (TSLA). Since its November 4th, 2021 high, TSLA has fallen only 18.41%, and it is only down 5% year to date. Even though hardly anyone would wish to see an investment lose nearly a fifth of its value, that is a substantially better result than most other ARKK holdings. For example, Berkley Lights (BLI) down 94% from its 5-year high, while 43% of the ETF’s holdings have fallen by at least 75%. Given that TSLA is by far the largest ARKK holding with a 10.55% weight, its smaller decline relative to the rest of the ETF’s holdings has helped ARKK from falling even more.
With the average ARKK stock down 70% from its 5-year high, it’s going to take a huge rally in the “growth” space to get back to prior levels. As shown at the bottom of the table, the average stock in the ETF now needs to rally 348% to get back to prior highs! Click here to learn more about Bespoke’s premium stock market research service.
Bespoke Investment Group, LLC believes all information contained in this report to be accurate, but we do not guarantee its accuracy. None of the information in this report or any opinions expressed constitutes a solicitation of the purchase or sale of any securities or commodities. This is not personalized advice. Investors should do their own research and/or work with an investment professional when making portfolio decisions. As always, past performance of any investment is not a guarantee of future results. Bespoke representatives or clients may have positions in securities discussed or mentioned in its published content.
Stocks With Strong Earnings Expectations
Trading stocks around earnings results can prove to be a daunting task, as the market’s reaction isn’t always what you’d expect. Nonetheless, today we outline 40 S&P 1500 stocks with market caps above $5 billion that are yet to report earnings where analysts expect strong YoY sales growth and positive earnings growth this quarter. Of these 40 stocks, ten are from the Energy sector, six each are from Consumer Discretionary and Technology, and five each are from the Materials and Industrials sectors. Apart from the Utilities and Communication Services sectors, every major sector is represented on this list. Even though these names are expected to experience significant y/y top and bottom line growth in their upcoming earnings reports, the average stock on this list trades at 18.1 times earnings and 3.6 times sales, with a median price to book multiple of 3.2. Additionally, the median stock on this list is 9.3% off its 52-week highs. As always, this list is meant to be a starting point for further research and is not a recommendation to buy or sell any specific securities. If you are interested in earnings season analysis, check out Bespoke’s Conference Call Recaps to stay on top of key earnings reports.
Below we summarize the reasoning behind the strong earnings expectations for each stock on the list:
Coterra Energy (CTRA) is a beneficiary of higher oil & natural gas prices. In FY 2021, the company had an average selling price of $60.35 when accounting for derivative settlements. With prices per barrel above $100 and robust demand, this company’s y/y revenues are expected to grow over 200%. For the natural gas segment, the company can expect the average price per thousand cubic meters to increase by about 2.5 fold, unless the use of derivatives significantly hampers selling prices. CTRA trades at a discount to the broader energy industry on a P/E basis.
CF Industries (CF) is a beneficiary of Russian sanctions, as the company manufactures and distributes fertilizer-related products across North America. Russia is the leading producer of fertilizer-related products (such as ammonia), so the sanctions from the West will cause other market participants to pick up the slack. The supply-restricted industry conditions could lead to higher average selling prices and higher volumes for US producers such as CF.
Southwest Airlines (LUV) is a major US airline that is set to benefit from improving rates of travel in Q1. Although the y/y growth will likely be substantial, travel volumes will still be below that of Q1 2019 based on Delta’s (DAL) recent report. Travel trends do appear positive for leisure and business alike, but the industry still has room to recover as resembled through TSA throughput volumes. Although TTM EPS is negative, LUV trades at a discount in terms of P/S relative to the industrials sector.
Matador Resources (MTDR) explores, develops and produces oil and natural gas resources within the US. This company benefits from the same tailwinds as CTRA, but tends to hedge the price of oil at a lesser rate, thus leading to increased upside potential in their Q1 earnings report.
Mosaic (MOS) is the largest producer of potash and phosphate fertilizer in the US, so the company is exposed to the same secular tailwinds as CF. MOS trades at a discount to the Materials industry based on the current P/E ratio.
Moderna (MRNA) has become a household name due to their swift development of the COVID vaccine, which generates the vast majority of revenues for the company. The brand recognition achieved from this accomplishment should help the company develop and commercialize vaccines and treatments moving forward, but the sequential growth rate in revenue will likely be hampered in the quarters to come. The stock trades at a steep discount to the broader Health Care sector on a P/E basis, but vaccination rates have declined in the US as COVID becomes endemic and almost everyone that wants a vaccine has already been jabbed.
Devon Energy (DVN) engages in the exploration, production and distribution of natural gas liquids and oil, which gives the company exposure to many of the energy tailwinds outlined previously.
HF Sinclair (DINO) is the fourth energy company on this list, manufacturing products such as gasoline, specialty lubricants and chemicals and modified asphalt. The diversified business model allows for the company to capitalize on higher oil prices as well as increased infrastructure spending. This is the cheapest stock on the list on a P/S basis.
Independence Realty Trust (IRT) operates as a REIT with a particular focus on residential housing. The industry-wide housing shortage allows for the company to capitalize on higher rental prices, as the lack of available homes forces certain individuals to rent instead of purchase. Moving forward, IRT can benefit from a demand reduction in home purchasing, as would-be buyers turn to short-term rentals.
Pool (POOL) is one of the world’s largest distributors of supplies and equipment for swimming pools. With recreational centers reopening and a significant increase in in-ground pools across the US since the beginning of the pandemic, POOL should experience secular tailwinds for the foreseeable future. POOL does trade at a slight P/E discount relative to the broader consumer discretionary space, but the stock is by no means cheap at 15.5 times book value.
Diamondback Energy (FANG) is exposed to the same tailwinds as the other energy names on this list, and trades at a steep discount to the energy sector on a P/E basis. The company has expanded drilling capacity in the last twelve months, so the company should realize strong gains due to both volume increases and favorable pricing.
ConocoPhillips (COP) competes in the energy sector and trades at a narrow P/E discount relative to the industry.
Pfizer (PFE) competes in the healthcare space, with primary exposure to the pharmaceutical and biotechnology industries. Vaccine sales are expected to prop up sales figures, and international sales margins for vaccines are expected to drive a more-than-doubling in EPS. The stock trades at a steep discount to the broader health care space on a P/E basis.
Webster Financial (WBS) is a commercial bank with a regional focus on the Northeast. The company focusses on serving individuals and corporations, delivering banking needs such as loan origination, deposit services and wealth management. Rising rates help expand bottom-line margins, and strong economic activity should lead to strong revenues in the coming quarter.
ICU Medical (ICUI) brings medical technology to market with a particular focus on critical care applications. As COVID becomes endemic, we can expect ER visits and surgical volumes to increase as there is a perceived decrease in risk within this space. The stock trades at a significant premium to the broader health care space in terms of P/E, but the P/S and P/B ratio are not necessarily outlandish.
Tesla (TSLA) is a beneficiary of the secular shift to EVs, an improving supply chain situation and limited vehicle inventories. With gas prices sky rocketing, the attractiveness of EVs increases, and TSLA continues to try and perfect production capacity. TSLA vehicles tend to sell almost as soon as they hit the market, but the stock trades at a significant premium relative to its industry, regardless of how you look at it.
ONEOK (OKE) is yet another energy company with a focus on natural gas. The company has been a beneficiary of the tailwinds outlined earlier and trades at a slight premium to the broader industry.
Chevron (CVX) trades inline with industry averages and the company has a particular focus on oil. The company is more geographically diversified than most energy companies, with a presence in more than 180 countries.
Realty Income (O) operates as a REIT that focuses on single-tenant commercial properties. The company has exposure to the UK, EU and the US. With the global economy having reopened, restrictions lifting, and property values inflating, O can benefit from a variety of secular trends. The stock trades at a slight discount to the real estate industry (on a P/E basis) and is relatively cheap on a P/B basis.
Churchill Downs (CHDN) operates a portfolio of gambling locations, including racetracks, casinos and online gambling. With COVID restrictions lifted and states increasingly accepting online gambling, CHDN stands to benefit, however, a decrease in discretionary spending can hamper revenues.
Advanced Micro Devices (AMD) is one of the innovation leaders within the semiconductor space. With increased gaming and high performance computing demand, AMD is positioned to expand on both the top and bottom line for the foreseeable future. Supply chain constraints have shown signs of easing, which should allow for further expansion.
Watsco (WSO) is one of the largest distributors of refrigeration equipment, air conditioning and heating equipment and supplies. As long as infrastructure spending and real estate demand remains strong, WSO should experience tailwinds.
Analog Devices (ADI) is a semiconductor producer that specializes in data conversion, signal processing and power management. With digitalization occurring across every industry, ADI should benefit from the same secular tailwinds as AMD. The stock does trade at a discount relative to the technology space with a relatively low P/B and P/E ratio.
Parker-Hannifin (PH) focuses on motion and control technology as well as filtration and engineered materials. The company has significant exposure to the aerospace industry, so the passing of the defense budget and increased infrastructure spending should provide a tailwind to revenues.
Vulcan Materials (VMC) is a leading producer of construction aggregates with a focus on crushed stone, gravel, asphalt and concrete. Increased infrastructure spending drives revenues for this stock, which trades at a significant P/E premium relative to the broader materials sector.
SolarEdge (SEDG) competes in the solar energy space, which should experience tailwinds as alternatives (oil & natural gas) appear less attractive due to price increases. Additionally, the push to “net-zero” should accelerate revenues moving forward. The stock trades at a significant valuation premium regardless of how you look at it.
Choice Hotels (CHH) owns a variety of hotel chains, ranging from discount to upscale options. As travel resumes for business and pent-up leisure travel demand hits the market, CHH is positioned to benefit. The stock trades inline with sector averages on a P/E basis, but the P/B multiple is extremely elevated.
Teledyne (TDY) is an industrial conglomerate with a focus on technology that senses, transmits and analyzes information. The end-uses for TDY’s products are endless, and the company benefits from increased infrastructure spending, a wide-scale focus on automation and strong economic activity. The stock trades at a discount to sector averages (on a P/E basis), but the P/B and P/S ratio imply that a solid portion of growth is priced in.
Exxon (XOM) is an energy producer with a primary focus on oil. The stock trades at a slight discount to market averages in terms of the P/E ratio.
Regal Rexnord (RRX) sells motor equipment and products with a primary focus on North America. These parts are used in a variety of end-markets, and the company benefits from increased infrastructure spending, strong economic activity, and an increased focus on automation. The stock trades at a significant discount to the broader industrials space and less than book value.
Murphy USA (MUSA) operates retail gas stations that tend to be located close to Walmart (WMT) stores. This strategic focus essentially guarantees considerable traffic. With high gas prices and relatively steady margins, MUSA should expect top and bottom line expansion. The stock trades at a discount to the energy space on a P/E basis, but the P/B ratio of 7.1 is considerably high.
Lithia Motors (LAD) is a US automotive dealership company that has benefitted from increased automotive prices but has been constrained due to limited inventory levels. As supply chain issues abate, the average selling price will likely decrease but volume should more-than make up for these losses.
US Steel (X) is one of the largest distributors of steel that benefits from increased infrastructure spending and strong economic activity. The pricing of inputs has certainly increased as of late, but the company has been able to pass these costs onto the purchasers. .
S&P Global (SPGI) is a financial company that provides credit ratings, indices and analytics to the investing community. Investing & trading has become increasingly prevalent in younger generations, which may help revenues moving forward. However, decreased trading volumes and poor market performance (particularly in debt markets) can negatively impact results. The stock trades at a premium relative to the financials sector on a P/E basis, and the P/S and P/B ratio appear extremely elevated as well.
Marathon Oil (MRO) competes in the energy sector with a primary focus on oil. The stock trades at a slight discount to sector averages on a P/E front.
Enphase Energy (ENPH) is a leader in the alternative energy space, providing clean energy solutions, software-driven home energy storage equipment, and e-monitoring offerings. As traditional energy sources remain pricey, consumers are increasingly likely to turn to alternatives to maximize efficiency and minimize costs. ENPH trades at aggressive multiples no matter how you look at it.
Carlisle (CSL) is a diversified industrial company that distributes its products globally. The company has a primary focus on construction materials, interconnect technologies and fluid technologies. This stock is exposed to the same secular trends as the other industrial companies on this list, and the stock trades at a premium relative to the industrials sector.
Martin Marietta (MLM) utilizes natural resources to supply aggregates and building materials to the construction industry. With strong housing demand, increased infrastructure spending and strong commercial activity, MLM is poised to benefit from secular trends. The stock trades at a significant premium to the averages of the materials sector, but the specific focus on construction may aid growth for the next few quarters.
Steel Dynamics (STLD) is exposed to the same trends as X, as their business models are quite similar. The stock does trade at a premium relative to X but at a discount relative to the broader materials industry.
Molson Coors (TAP) is a manufacturer and distributor of alcoholic beverages. This company benefits from the global reopening, but is constrained by supply chain woes, rampant inflation, and a shift in consumer preferences. TAP’s exposure to a variety of headwinds without significant tailwinds (relatively speaking) has pushed valuation figures to relatively low levels, trading below average on a P/B, P/E and P/S basis compared to its sector.
The table below summarized the earnings performance of the 40 names outlined above. The median sales beat rate of these names is 50%, whereas the median EPS beat rate is 65%. The overall positivity rate for performance in reaction to earnings is 53% on a median basis, while the performance in reaction to Q1 earnings is only positive 48% of the time (on a median basis).
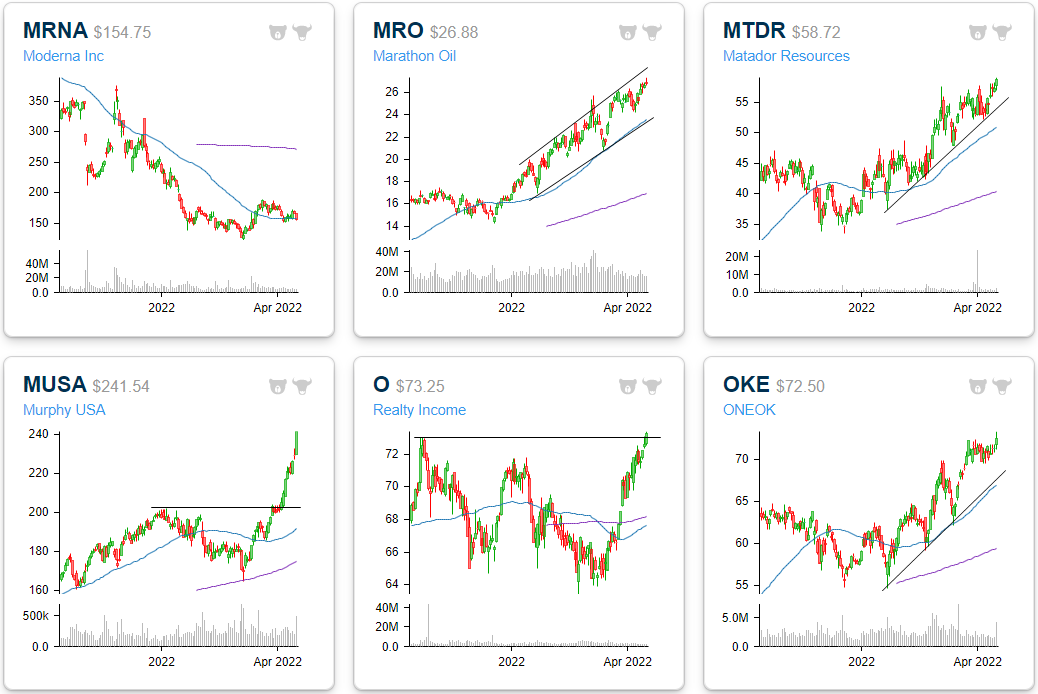
Below we provide six-month price charts of these 40 stocks. Click here to view Bespoke’s premium membership options.
Bespoke Investment Group, LLC believes all information contained in this report to be accurate, but we do not guarantee its accuracy. None of the information in this report or any opinions expressed constitutes a solicitation of the purchase or sale of any securities or commodities. This is not personalized advice. Investors should do their own research and/or work with an investment professional when making portfolio decisions. As always, past performance of any investment is not a guarantee of future results. Bespoke representatives or clients may have positions in securities discussed or mentioned in its published content.
Bespoke’s Morning Lineup – 4/19/22
See what’s driving market performance around the world in today’s Morning Lineup. Bespoke’s Morning Lineup is the best way to start your trading day. Read it now by starting a two-week trial to Bespoke Premium. CLICK HERE to learn more and start your trial.
Bespoke’s Quote of the Day: “When something is important enough, you do it even if the odds are not in your favor.” – Elon Musk
Below is a snippet of content from today’s Morning Lineup for Bespoke Premium members. Start a two-week trial to Bespoke Premium now to access the full report.
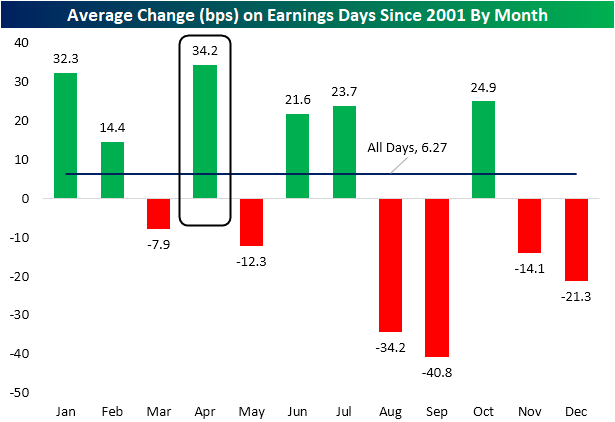
As earnings season ramps up, today we took look at how stocks have historically reacted to earnings reports from a seasonal perspective. The chart below shows the average one-day stock price reaction to earnings reports by month over the last 20 years. This data comes from our Earnings Explorer database that includes one-day share price reactions of more than 150,000 individual quarterly earnings reports dating back to 2001. As shown below, the average company that has reported quarterly earnings in the month of April has gained 34.2 basis points (+0.34%) on its earnings reaction day. That makes April the most bullish month for stocks reporting earnings. Conversely, August and September have been the two worst months to report earnings. Stocks that have historically reported quarterly numbers in August have averaged a one-day decline of 34.2 basis points (-0.34%) on their earnings reaction days. Stocks reporting in September have averaged an even bigger decline on their earnings reaction days (-0.41%). (For companies that report earnings in the morning before the open, its earnings reaction day is that same trading day. For companies that report earnings in the evening after the close, its earnings reaction day is the next trading day.)
Start a two-week trial to Bespoke Premium to read today’s full Morning Lineup.
Western Wobbling in Homebuilder Sentiment
As the national average for a 30-year fixed rate mortgage has risen to and remained above 5%, homebuilder sentiment has been reversing its pandemic gains. The NAHB’s monthly homebuilder sentiment index dropped 2 points in April to 77. That was the fourth decline in a row bringing the headline number to the weakest reading since September of last year. That is also now only one point above the December 2019 pre-pandemic high.
The decline this month was mostly driven by a decrease in traffic. That index dropped 6 points to 66 which is the weakest level and the biggest one-month decline since last August. Meanwhile, present sales dropped 2 points for the second month in a row. On the bright side, future sales actually ticked up 3 points to snap a three-month losing streak. That being said, the current level of this index is much less elevated within its historical range compared to the others.
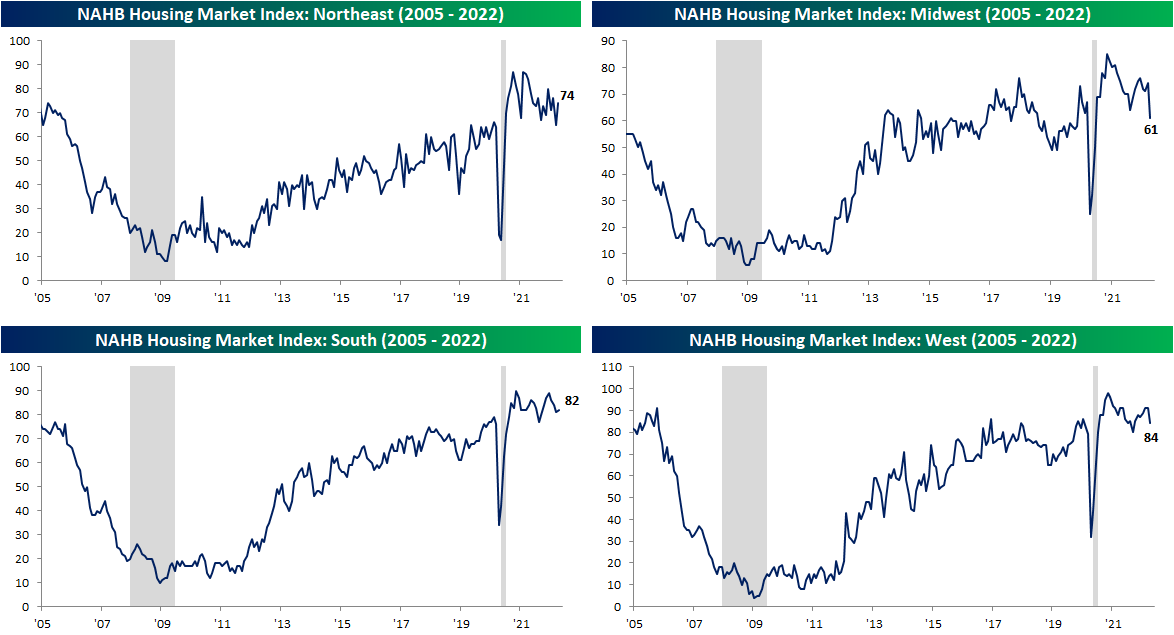
Geographically, there are some large divergences in homebuilder sentiment. For starters, the Northeast showed the most impressive improvement with the index rising 9 points month over month. Whereas last month it was the lowest within its respective historical range, today it is the most elevated. The South also saw an improvement as this region has perhaps been the most stable across the pandemic years. The West and Midwest were other stories entirely in April. The Midwest experienced its second-largest decline on record behind the 42 point drop in April 2020 and is now at the lowest level since June 2020. Meanwhile, the West fell 7 points. That also was the biggest drop in two years though the index saw an even lower reading as recently as last September.
As homebuilder sentiment drops, so too have homebuilder stocks. The iShares US Home Construction ETF (ITB) — which tracks the space — has been falling sharply since peaking around the turn of the year. Click here to view Bespoke’s premium membership options.
Chart of the Day: Nasdaq Down YoY
A Good Friday From the Empire Fed
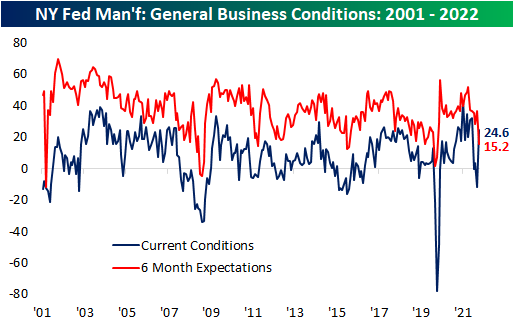
Even though markets were shuttered on Friday for the Good Friday holiday, the New York Federal Reserve branch released the latest update on their monthly manufacturing report with astounding results. Heading into the release, the March reading had shown a significant decline back into negative territory indicating the region’s manufacturers reported contractionary overall activity. In April, activity rebounded substantially with the headline number rising 36.4 points all the way up to 24.6. That set the second-largest month-over-month increase on record behind the 48.3-point jump back in June 2020. In terms of the level of the index, it brought it from a lower decile reading to levels just shy of the upper decile of its historical range going back to the start of the survey in the early 2000s.
Although current conditions were impressive, we would caution that expectations soured in an equally dramatic fashion. The six-month expectation index dropped 21.4 points to 15.2. That was only 0.3 points shy of the second-largest decline on record (21.7 point decline in March 2020) but was far better than the 61 point drop after 9/11 in the early days of the survey.
The move higher in General Business Conditions was thanks to big turnarounds in New Orders and Shipments but breadth elsewhere in the report was not as positive. Of the seven other categories, four declined month over month with three of those declines ranking in the bottom decile of each one’s respective histories. Again, expectations were much more worrisome with large declines across categories and readings in the bottom few percentiles for things like New Orders, Shipments, and Unfilled Orders. Overall, the report showed solid improvements in conditions but how sustainable those improvements will be in the coming months could come into question.
The biggest contributors to the increase in the headline reading were improvements in New Orders and Shipments. Each one crossed back into the top decile of their historical ranges on some of the biggest month-over-month increases on record outside of the spring of 2020. Unfilled Orders were also higher, though, unlike New Orders or Shipments, the index is coming off of already elevated levels. Given the strength in demand and shipments, inventories grew at a slower rate. Expectations were much less optimistic as across all four of these categories there were near-record declines. Unfilled Orders and Inventories even fell into contraction. That means that although New York area firms witnessed solid improvement in business conditions in April, the positive changes are not expected to keep pace or continue in the months ahead.
One likely reason for the big improvements this month was the easing of supply chain stress. The index of Delivery Times fell back down to the low end of its elevated pandemic range in April (higher readings indicate products are taking longer to reach their destination).
Those improvements in current conditions did not filter through to employment. While the region’s firms are on net still increasing hiring, the index for Number of Employees fell to the lowest level since October 2020 after two months of the largest MoM declines since the onset of the pandemic. As hiring decelerates, the average workweek did tick up solidly. That index rose 6.5 points to 10. Click here to view Bespoke’s premium membership options.
Bespoke’s Morning Lineup – Tax Day – 4/18/22
See what’s driving market performance around the world in today’s Morning Lineup. Bespoke’s Morning Lineup is the best way to start your trading day. Read it now by starting a two-week trial to Bespoke Premium. CLICK HERE to learn more and start your trial.
Bespoke’s Quote of the Day: “The difference between death and taxes is death doesn’t get worse every time Congress meets.” – Will Rogers
Below is a snippet of content from today’s Morning Lineup for Bespoke Premium members. Start a two-week trial to Bespoke Premium now to access the full report.
Below is a table we highlight each year showing the S&P 500’s performance in the weeks leading up to and the weeks immediately following Tax Day. As shown, over the last 20+ years, the weeks before Tax Day have been much weaker for the market than the weeks after. This year has been no different thus far with the S&P falling more than 3% in the two weeks leading up to Tax Day. Now we just need the trend of gains in the two weeks following Tax Day to hold as well!
Start a two-week trial to Bespoke Premium to read today’s full Morning Lineup.
Bespoke Brunch Reads: 4/17/22
Welcome to Bespoke Brunch Reads — a linkfest of the favorite things we read over the past week. The links are mostly market related, but there are some other interesting subjects covered as well. We hope you enjoy the food for thought as a supplement to the research we provide you during the week.
While you’re here, join Bespoke Premium with a 30-day free trial!
Real Estate
What Happened to the Gilded Age Mansions of New York City? by Candace Taylor (WSJ)
The history of the midtown mansions which used to be a defining feature of life in Manhattan; they’ve long since disappeared under soaring buildings which now dominate the city. [Link; paywall]
Redfin Reports Demand Slips, Pushing More Sellers to Drop Asking Prices (Redfin/Business Wire)
A summary of leading indicators for home buying demand that have started to slow. Fewer searches, fewer tours, fewer mortgage applications, and higher rates are all illustrating a looming cooldown in the housing market. [Link]
How Remote Work is Shifting Population Growth Across the U.S. by Adam Ozimek (Economic Innovation Group)
An analysis of Census data that suggests remote work is driving population outflows from high-cost dense metros and towards suburbs, exurbs, and rural areas around the country. [Link]
Work
Sure, Work Makes Us Want to Swear. But Should You? by Rachel Feintzeig (WSJ)
It’s one thing to let fly with profanity at home, but returns to the office have meant habits developed during the pandemic may require a bit of adjustment now that there are coworkers in ear shot again. [Link; paywall]
Everything Costs More, and That’s Disrupting Retirement for Many by Harriet Torry (WSJ)
Inflation appears to be playing a role solving a problem that was much fretted over last year: workers are returning to the labor force to augment retirement income amidst high rising prices. [Link; paywall]
Starbucks is weighing better benefits for employees but says they could exclude union workers by Amelia Lucas (CNBC)
Already facing one complaint from the NLRB for union-busting, Starbucks is trying to fight further unionization by denying benefits to union shops and may run further afoul of labor regulations in the process. [Link]
Innovation
A McDonald’s distribution partner in Canada is testing an electric Volvo truck — take a closer look at the big rig EV by Brittany Chang and Mary Meisenzahl (Business Insider)
EV trucks are starting to hit the road in Canada as part of a test for Volvo’s new offerings. McDonalds is testing the trucks as part of its distribution network. [Link]
World’s Biggest Particle Collider to Restart in Bid to Extend Frontiers of Physics by Aylin Woodward and Janet Babin (WSJ)
The massive particle accelerator along the Swiss-French border has been shut down for three years, but new collisions will resume soon after a series of upgrades. [Link; paywall]
Emerging Markets
Unsafe at any price by Jay Newman (FTAV)
Concerns are mounting over the shift away from protective covenants are especially grave among the highly-indebted sovereign borrowers from emerging markets, where legal enforcement against sovereign actors is always more complicated than in the private sector. [Link; registration required]
U.S. and Chinese Bond Yields Converge, Reversing a Decadelong Pattern by Rebecca Feng (WSJ)
The once-large yield advantage for Chinese government bonds relative to those in the US has been erased, with a slowing Chinese economy and tightening Fed policy leading to a convergence between the two large markets. [Link; paywall]
Supply Chains
Building Resilient Supply Chains (Council of Economic Advisors)
A detailed report on the general nature of supply chains and steps that could be taken to make them more resilient, part of the CEA’s annual Economic Report of the President. [Link; 42 page PDF]
France
First round of 2022 French election in charts by Eir Nolsoe, Ella Hollowood, and Oli Elliot (FT)
A series of charts explaining the geographic, material, and educational differences between voters that supported Marine Le Pen and Emmanuelle Macron in France’s first round elections. [Link; soft paywall]
Read Bespoke’s most actionable market research by joining Bespoke Premium today! Get started here.
Have a great weekend!
Bespoke’s Crypto Report — 4/15/22
Bespoke’s Crypto Report contains numerous technical, momentum, and sentiment charts for bitcoin, ethereum, and other key cryptos. Page 1 of the report includes our weekly commentary on the space and attempts to identify any new trends that are emerging. The remaining pages include important overbought/oversold levels to watch, charts on historical drawdowns and rallies, seasonality trends, futures positioning data, Google search trend shifts, and more. Our weekly Crypto Report is produced so that followers of the space can more easily stay on top of price action, technicals, seasonality, and sentiment.
Sign up for a monthly or annual subscription to Bespoke Crypto to receive our weekly Crypto Report and anything else we publish related to cryptos. Note: If you’re currently a Bespoke Premium, Bespoke Newsletter, or Bespoke Institutional subscriber, you’ll need to subscribe to Bespoke Crypto as an add-on to receive access. The weekly Crypto Report and any additional crypto analysis is not included with our Premium, Newsletter, or Institutional memberships. You can sign up for Bespoke Crypto and receive our Crypto Report in your inbox weekly using the monthly or annual checkout links below. If you sign up for the annual plan, the first year of access is 50% off!
Bespoke Crypto Access — Monthly Payment Plan ($49/mth)
Bespoke Crypto Access — Annual Payment Plan ($247.50 for the first 12 months, then $495/year in year 2 and beyond)
Bespoke Investment Group, LLC believes all information contained in this service to be accurate, but we do not guarantee its accuracy. None of the information in this service or any opinions expressed constitutes a solicitation of the purchase or sale of any securities, commodities, or cryptocurrencies. This service contains no buy or sell recommendations. This is not personalized advice. Investors should do their own research and/or work with an investment professional when making portfolio decisions. As always, past performance of any investment is not a guarantee of future results. Bespoke representatives or clients may have positions in securities discussed or mentioned in its published content.
The Bespoke Report – 4/14/22 – Churn! Churn! Churn!
This week’s Bespoke Report newsletter is now available for members.
We can’t get the Byrds song “Turn! Turn! Turn!” out of our minds lately, but in our heads, we’re singing Churn! Churn! Churn!. Stocks can’t seem to find any direction these days, and that’s being somewhat generous. If anything, the trend has been lower, but with the weekend approaching, let’s be generous in order to keep up the mood. The 200-day moving average is typically considered a major trendline for the S&P 500 with breaks above considered bullish, while moves below suggest a bearish outlook. If that’s the case, what are we to make of the fact that the S&P 500 has crossed above its 200-DMA more than five times this year and crossed below it six times? As we’ve all said to our kids all too often, “Make up your mind already!”
While we had a holiday-shortened week, it was still plenty busy with the kick-off of earnings season and a bunch of economic data. We cover it all in this week’s Bespoke Report along with the big drop in bullish sentiment, some whipsaw moves in the treasury market, a look at seasonality around tax day, and lastly a checkup on the semiconductors.
To read this week’s full Bespoke Report newsletter and access everything else Bespoke’s research platform has to offer, start a two-week trial to one of our three membership levels.
