Seasonal Mid Point
Today marks the midpoint of spring, so from here on, we can say that we’re closer to summer than winter. Summer isn’t typically thought of as a positive time for equities, but as highlighted in the “Seasonality” section of our Morning Lineup today, the next three months, which is the period straddling the back half of spring and the first half of summer, has been relatively strong in the last ten years. The table and charts below summarize the performance of the S&P 500 ETF (SPY) and each sector-tracking ETF from the close on May 5th through August 5th. The S&P 500’s median performance during this period over the last ten years has been a gain of 5% with positive returns 90% of the time. Leading the way higher, Health Care (XLV), Real Estate (XLRE), and Technology (XLK) have all experienced median gains of over 5% with positive returns 85% of the time or more. In addition to XLV and XLK, Consumer Discretionary (XLY) and Consumer Staples (XLP) have also been up during this period in nine of the last ten years. On the downside, the only sector that has had a negative return on a median basis has been Energy (XLE). Ironically, even last year when the sector outperformed the broader market by a significant degree, it not only declined (-8.3%), but it also underperformed the S&P 500 by a wide margin during this three-month stretch.
Looking at the last ten years, in every year since 2013, there have only been two years that the majority of sectors in the S&P 500 declined during this period (XLRE price data doesn’t begin until 2016 while XLC didn’t start trading until June 2018). Last year, six of eleven sectors traded lower even as the S&P 500 had a marginal gain, while in 2019, eight of eleven sectors declined as the S&P 500 fell 3%.

Have you tried Bespoke All Access yet?
Bespoke’s All Access research package is quick-hitting, actionable, and easily digestible. Bespoke’s unique data points and analysis help investors better visualize underlying market trends to ultimately make more informed investment decisions.
Our daily research consists of a pre-market note, a post-market note, and our Chart of the Day. These three daily reports are supplemented with additional research pieces covering ETFs and asset allocation trends, global macro analysis, earnings and conference call analysis, market breadth and internals, economic indicator databases, growth and dividend income stock baskets, and unique interactive trading tools.
Click here to sign up for a one-month trial to Bespoke All Access, or you can read even more about Bespoke All Access here.

Bespoke’s Morning Lineup – 5/5/23 – Unlucky Thirteen?
See what’s driving market performance around the world in today’s Morning Lineup. Bespoke’s Morning Lineup is the best way to start your trading day. Read it now by starting a two-week trial to Bespoke Premium. CLICK HERE to learn more and start your trial.
“Employment is nature’s physician and is essential to human happiness.” – Galen

Below is a snippet of content from today’s Morning Lineup for Bespoke Premium members. Start a two-week trial to Bespoke Premium now to access the full report.
You’ve likely seen a few headlines this morning discussing the ‘rebound’ and ‘surge’ in regional bank stocks led by shares of PacWest (PACW) which are trading up 26% in pre-market trading. Any staunching of the bleed in these stocks is welcome, but when PACW is only back to levels where it was trading at in the final hour of trading yesterday and still down over 60% on the week, it’s hard to call it a surge.
With bank stocks showing some stabilization, equity futures are taking the opportunity to rebound. European stocks are all firmly higher this morning, and that comes despite what has been mostly a round of weaker-than-expected economic data as European Retail Sales, German Factory Orders, and Industrial Production in France all came in significantly weaker than expected.
With the Fed on Wednesday and Apple (AAPL) earnings after the close yesterday, you may have forgotten about today’s April Non-Farm Payrolls, but those numbers were just released. Economists were expecting the total change in Non-Farm Payrolls to come in at 185K with the Unemployment Rate increasing to 3.6% from 3.5%. The actual readings came in stronger than expected with payrolls increasing by 253K and the Unemployment Rate falling to 3.4%. Average hourly earnings were also two-tenths stronger than expected at 0.5% m/m. One caveat to the stronger headline print, though, was that prior month readings were revised lower by about 150K.
The monthly payrolls report has been important because, in its quest to bring down inflation, the Federal Reserve has been on a mission to crush employment. Because of that, the chart below continues to give members of the committee nightmares. While other areas of the economy have clearly shown signs of rolling over, up until recently, employment has been humming along. Recently, we have started to see some signs of cooling as jobless claims (after a major revision) have been trending higher while JOLTS has been rolling over, but the Non-Farm Payrolls report has been another story. With this month’s stronger-than-expected print, we have now seen a record 13 straight months where the headline change in Non-Farm Payrolls was better than expected.

Start a two-week trial to Bespoke Premium to read today’s full Morning Lineup.
Bespoke’s Consumer Pulse Report — May 2023
Bespoke’s Consumer Pulse Report is an analysis of a huge consumer survey that we run each month. Our goal with this survey is to track trends across the economic and financial landscape in the US. Using the results from our proprietary monthly survey, we dissect and analyze all of the data and publish the Consumer Pulse Report, which we sell access to on a subscription basis. Sign up for a 30-day free trial to our Bespoke Consumer Pulse subscription service. With a trial, you’ll get coverage of consumer electronics, social media, streaming media, retail, autos, and much more. The report also has numerous proprietary US economic data points that are extremely timely and useful for investors.
We’ve just released our most recent monthly report to Pulse subscribers, and it’s definitely worth the read if you’re curious about the health of the consumer in the current market environment. Start a 30-day free trial for a full breakdown of all of our proprietary Pulse economic indicators.

Initial and Continuing Claims in Opposite Directions
The latest reading on initial jobless claims disappointed coming in at 242K versus expectations of 240K. That is up from last week’s downward revision to 229K. As shown in the inlaid chart below, claims have moved up to some of the highest levels in a over a year with the past several weeks marking relatively range bound readings. This week’s increase to 240K marks a move to the high end of that recent range.

Before seasonal adjustment, claims came in at 219K. That is roughly in line with the readings of the comparable week off the year for the past few years excluding 2020 and 2021 when claims were more elevated due to the pandemic. Claims are also generally following seasonal trends with the current week having consistently seen declines week over week historically. With that said, claims have yet to make a new low on the year.

Whereas initial claims were a slight disappointment, continuing claims surprised with an improvement this week. Rather than the increase to 1.865 million that was expected, they dropped all the way down to 1.805 million, the lowest reading in three weeks. Albeit improved in the near term, the uptrend in continuing claims remains in place as claims are around the highest levels since early 2022.

Have you tried Bespoke All Access yet?
Bespoke’s All Access research package is quick-hitting, actionable, and easily digestible. Bespoke’s unique data points and analysis help investors better visualize underlying market trends to ultimately make more informed investment decisions.
Our daily research consists of a pre-market note, a post-market note, and our Chart of the Day. These three daily reports are supplemented with additional research pieces covering ETFs and asset allocation trends, global macro analysis, earnings and conference call analysis, market breadth and internals, economic indicator databases, growth and dividend income stock baskets, and unique interactive trading tools.
Click here to sign up for a one-month trial to Bespoke All Access, or you can read even more about Bespoke All Access here.
Sentiment Slouches
The S&P 500 has firmly turned lower in the past few days and is nearing the lows from last Wednesday. In spite of that turn lower, bullish sentiment was unchanged at 24.1% per the latest AAII sentiment survey. Although less than a quarter of respondents reported as bullish, that reading is only in the middle of the past year’s range of readings as bullish sentiment has consistently been hard to come by.

With no change to bullish sentiment, all of the moves occurred for neutral and bearish sentiment. Neutral sentiment has declined for three weeks in a row, coming in at a six week low of 31% this week.

All of those declines to neutral sentiment were picked up by bears as that reading rose 6.4 percentage points to 44.9%. That is the highest reading since the end of March and right in line with the average reading of bearish sentiment since the beginning of 2022.

With bearish sentiment moving higher, the bull-bear spread moved more firmly into negative territory. This week, bears outnumbered bulls by 20.8 percentage points; the widest spread in five weeks. That indicates the predominant share of respondents continue to expect the S&P 500 to head lower over the next six months.

That negative outlook by individual investors is nothing new. Following the record streak of 44 straight weeks of a negative bull-bear spread that ended in February, the spread has resumed another lengthy streak of negative readings. This week marked the eleventh straight negative reading in the bull-bear spread. Even in the more recent context of the aforementioned record streak and another double-digit streak in the first quarter of last year, the AAII survey has seldom seen bears outnumber bulls on such a consistent basis.

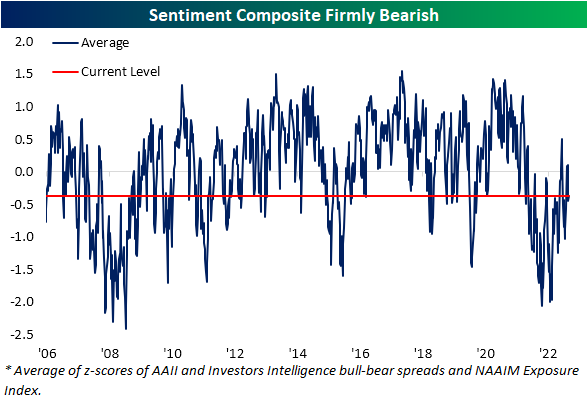
Factoring in other sentiment surveys like those from Investors Intelligence and NAAIM reaffirms the bearish tones of sentiment. With all three surveys combined, our sentiment composite remains firmly negative meaning sentiment is more bearish than average. We would also note that due to the timing of the collection of these surveys, they would have mostly missed any reaction to the FOMC’s rate decision and market response yesterday. As such, next week’s surveys will be the first to fully reflect the latest 25 bps hike and subsequent market declines.
Have you tried Bespoke All Access yet?
Bespoke’s All Access research package is quick-hitting, actionable, and easily digestible. Bespoke’s unique data points and analysis help investors better visualize underlying market trends to ultimately make more informed investment decisions.
Our daily research consists of a pre-market note, a post-market note, and our Chart of the Day. These three daily reports are supplemented with additional research pieces covering ETFs and asset allocation trends, global macro analysis, earnings and conference call analysis, market breadth and internals, economic indicator databases, growth and dividend income stock baskets, and unique interactive trading tools.
Click here to sign up for a one-month trial to Bespoke All Access, or you can read even more about Bespoke All Access here.
Chart of the Day: Earnings Shaping Up Positively
Bespoke’s Morning Lineup – 5/4/23 – Inequality in Commodities
See what’s driving market performance around the world in today’s Morning Lineup. Bespoke’s Morning Lineup is the best way to start your trading day. Read it now by starting a two-week trial to Bespoke Premium. CLICK HERE to learn more and start your trial.
“When you blow away the foam, you get down to the real stuff.” – T. Boone Pickens
Below is a snippet of content from today’s Morning Lineup for Bespoke Premium members. Start a two-week trial to Bespoke Premium now to access the full report.
After a relatively hawkish tone from Fed Chair Powell where he reiterated his view that the regional banking system is doing fine, reports surfaced that PacWest (PACW) is mulling strategic options for its business. Shares of PACW and other regional banks immediately plunged on the idea that things really aren’t fine, and that pulled futures for the broader market lower as well. In earnings news, shares of Qualcomm (QCOM) are down over 7% after the company reported weaker-than-expected EPS and lowered guidance. QCOM’s weak earnings report suggests that sales of handsets have been weak, and on that news, Apple (AAPL) is also trading lower heading into its earnings report after the close.
On the economic calendar today, jobless claims are the primary focus, but we also got updates on Non-Farm Productivity and Unit Labor Costs. Initial claims were slightly higher than expected (242K vs 240K) while Continuing Claims were significantly lower than expected (1.805 million vs 1.865 million). Non-Farm Productivity fell 2.7% versus forecasts for a decline of 2.0%, and Unit Labor Costs rose 6.3% compared to estimates of 5.6%.
All the headlines surrounding the troubles in the banking sector have weighed on sentiment in the last week as the AAII sentiment survey showed that bulls were unchanged at 24.1%, but bullish sentiment jumped from 38.5% up to 44.9%.
When it comes to trends within individual asset classes, the typical pattern is one of a tide lifting or sinking all boats. While it hasn’t necessarily been the case over the last two years, when the stock market rallies, most individual stocks rally and vice versa. Similarly, when bonds rally rates usually fall, even if the move lower is to varying degrees. One area of financial markets where we have been seeing a wide degree of disparity within the asset class is commodities.
The snapshot from our Trend Analyzer below shows where various commodity-related ETS currently stand relative to their trading ranges. At the top of the list and all trading in overbought territory are ETFs related to precious metals like gold and silver. Most of them are also up by double-digit percentages YTD. While these ETFs have performed well both recently and on a YTD basis, most other ETFs in the sector are down sharply YTD and trading at oversold levels. Crude oil ETFs like USO and DBO are down 7% over the last week while Natural Gas is sitting on a 55% YTD decline after falling an ominous 6.66% over the last five trading days. Is it getting hot in here?

Start a two-week trial to Bespoke Premium to read today’s full Morning Lineup.
Chart of the Day – The “Powell Fade” Comes Right on Cue
The Triple Play Report — 5/3/23
An earnings triple play is a stock that reports earnings and manages to 1) beat analyst EPS estimates, 2) beat analyst sales estimates, and 3) raise forward guidance. You can read more about “triple plays” at Investopedia.com where they’ve given Bespoke credit for popularizing the term. We like triple plays as an indication that a company’s business is firing on all cylinders, with above-expectations results and an improving outlook. A triple play is indicative of positive “fundamental momentum” instead of pure fundamentals, and there are always plenty of names with both high and low valuations on our quarterly list.
Bespoke’s Triple Play Report highlights companies that have recently reported earnings triple plays, and it features commentary from management on triple-play conference calls, company descriptions and analysis, and price charts. Bespoke’s Triple Play Report is available at the Bespoke Institutional level only. You can sign up for Bespoke Institutional now and receive a 14-day trial to read this week’s Triple Play Report, which features seven stocks. To sign up, choose either the monthly or annual checkout link below:
Bespoke Institutional – Monthly Payment Plan
Bespoke Institutional – Annual Payment Plan

Fixed Income Weekly: 5/3/23
Searching for ways to better understand the fixed income space or looking for actionable ideas in this asset class? Bespoke’s Fixed Income Weekly provides an update on rates and credit every Wednesday. We start off with a fresh piece of analysis driven by what’s in the headlines or driving the market in a given week. We then provide charts of how US Treasury futures and rates are trading, before moving on to a summary of recent fixed income ETF performance, short-term interest rates including money market funds, and a trade idea. We summarize changes and recent developments for a variety of yield curves (UST, bund, Eurodollar, US breakeven inflation and Bespoke’s Global Yield Curve) before finishing with a review of recent UST yield curve changes, spread changes for major credit products and international bonds, and 1 year return profiles for a cross section of the fixed income world.
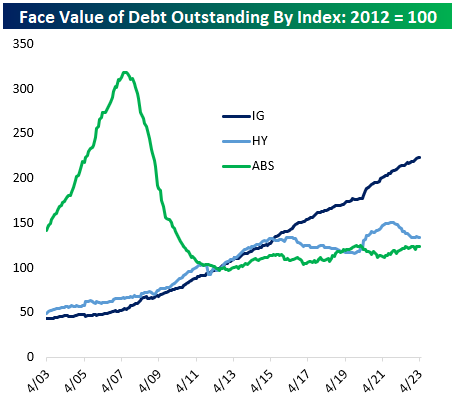
In this week’s report, we track investment grade corporate bond issuance.
Our Fixed Income Weekly helps investors stay on top of fixed-income markets and gain new perspectives on the developments in interest rates. You can sign up for a Bespoke research trial below to see this week’s report and everything else Bespoke publishes free for the next two weeks!
Click here and start a 14-day free trial to Bespoke Institutional to see our newest Fixed Income Weekly now!