Brunch Reads – 3/29/26
Welcome to Bespoke Brunch Reads — a linkfest of some of our favorite articles over the past week. The links are mostly market-related, but there are some other interesting subjects covered as well. We hope you enjoy the food for thought as a supplement to the research we provide you during the week.
Terracotta Tombkeepers: On March 29, 1974, a group of farmers digging a well in the countryside outside Xi’an struck fragments of clay that seemed ordinary at first but soon revealed pieces of life-sized human figures. Local authorities were notified, and archaeologists quickly determined the site was connected to the tomb complex of Qin Shi Huang, the ruler who unified China more than two thousand years earlier in 221 BC.
As excavation began, the scale of the find became shocking. Thousands of intricately detailed terracotta soldiers, along with horses and chariots, were arranged in battle formation across multiple pits, each figure unique in facial expression and posture. During the Warring States period, China was defined by constant conflict among rival kingdoms, where survival depended on military strength, innovation, and centralized control. When Qin Shi Huang emerged victorious, he imposed sweeping standardization across currency, writing, and infrastructure, while ruling with an iron grip. At the end of his life, rather than relying on symbolic burial items, he commissioned a full-scale army to guard him in the afterlife, a testament to the immense power of his rule and the extraordinary craftsmanship of the Qin dynasty.

Energy
The 2,000-Year-Old Cement Battery That Could Reduce Our Reliance on Fossil Fuel (WSJ)
A new “cement battery” uses a reversible chemical reaction to store heat from electricity, offering a simple and potentially cheap way to replace natural gas for industrial heating and buildings. If it scales, the technology could turn excess renewable energy into stored heat that can be used anytime, helping smooth out energy supply while reducing reliance on fossil fuels. [Link]
Continue reading our weekly Brunch Reads linkfest by logging in if you’re already a member or signing up for a trial to one of our two membership levels shown below! You can cancel at any time.

The Bespoke Report – Equity Market Pros and Cons – Q2 2026
This week’s Bespoke Report is an updated version of our “Pros and Cons” edition for Q2 2026.
With this report, you’re able to get a complete picture of the bull and bear case for US stocks right now. It’s heavy on graphics and light on text, but we let the charts and tables do the talking.
On page three of the report, you’ll see a full list of the pros and cons that we lay out. Slides for each topic are then provided on page four and beyond.
To read this report and access everything else Bespoke’s research platform has to offer, start a trial to any of our three membership levels today!

Bespoke’s Morning Lineup – 3/27/26 – More Losses
See what’s driving market performance around the world in today’s Morning Lineup. Bespoke’s Morning Lineup is the best way to start your trading day. Read it now by starting a two-week trial to Bespoke Premium. CLICK HERE to learn more and start your trial.
“If my answers frighten you then you should cease asking scary questions.” – Quentin Tarantino

Below is a snippet of commentary from today’s Morning Lineup. Start a two-week trial to Bespoke Premium to view the full report.
It’s another one of those days where futures drift lower throughout the morning as traders follow the new daily routine of getting up, brushing their teeth, and clicking “Sell”. At 5 AM on the East Coast, when most of us were still asleep, futures were flat to marginally higher, but they have steadily lost steam all morning, and the S&P 500 is on pace to gap down 0.4%, while the Nasdaq is down 0.6%. Barring a major reversal during the trading day, the Nasdaq is poised for its 10th down week in the last 11. That consistency to the downside has only been seen in a handful of other periods throughout the index’s history.
Treasury yields are higher, with the 10-year yield up 4 bps to 4.46%, and WTI crude oil is up another 2.5% to just under $97 per barrel. That increase comes after President Trump said he would extend the deadline for Iran to open the Strait of Hormuz by 10-days because talks were “going very well”. While that looks bullish on the surface, it’s been taken as either a sign that the President is just buying more time to launch a ground invasion, or that talks are not going anywhere and the President is just stalling. The reality is that only a handful of people really do know, so investors are using the uncertainty as an excuse to sit things out.
On a more positive note, it looks like the government shutdown will end today, which should alleviate some of the pressure at US airports. Isn’t it ironic that after more than 40 days without paying TSA employees and subjecting people across the country to airport delays, Congress finally reached an agreement just in time for their two-week vacation? The idea that members of Congress are ‘public servants’ is starting to feel like the ultimate oxymoron; unless, of course, the public they’re serving is just each other.
In Asia overnight, most major equity benchmarks were lower on the session, although Hong Kong and China managed fractional gains. Outside of Australia, though, every other equity market was down for the week. In Europe, it’s much weaker with the STOXX 600 down 1.4%, putting it into the red for the week, and most individual country indices are down at least 1% on the day.
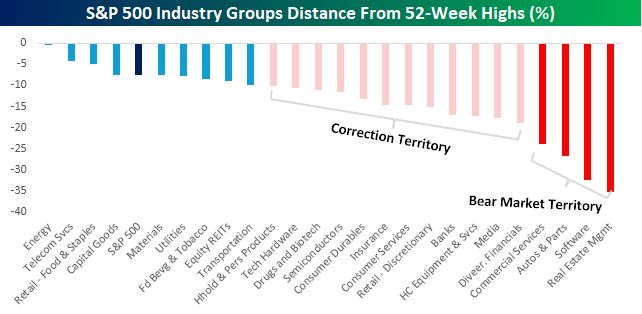
With yesterday’s decline, the S&P 500 is now down 7.5% from its intraday high earlier this year, putting it increasingly closer to correction territory. Of the 25 industry groups within the index, 16 closed at least 10% below their respective 52-week highs (on an intraday basis), and four of those are down at least 20%, putting them in bear market territory based on the 20% definition. Leading the way down, Real Estate Management has lost more than 35% of its value, but the most painful of the declines, given its weighting in the index, is Software, which is down by nearly a third.
On the positive, or less negative side, three groups closed within 5% of their respective highs yesterday, with the most obvious being Energy.
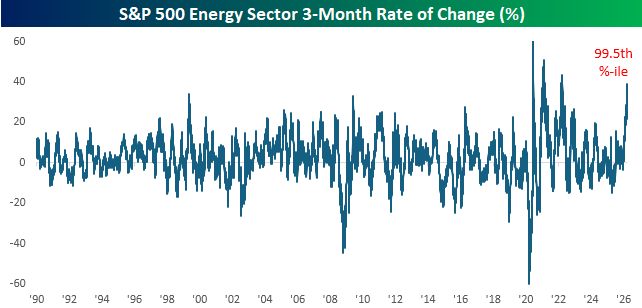
The rally in the Energy sector has reached historic proportions in the last few weeks. Over the last three months, the sector has rallied more than 38%, which ranks in the 99.5th percentile compared to all other periods since 1990. As shown in the chart below, the only times it experienced a larger rally were coming out of Covid and early in the Russia-Ukraine war.
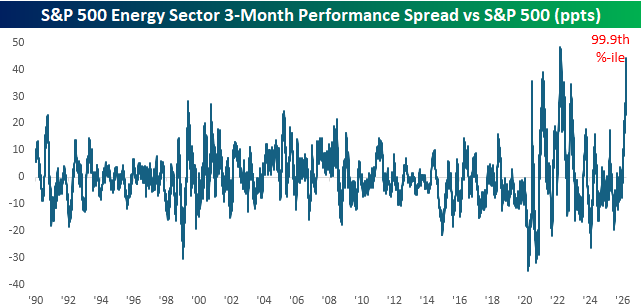
What’s even more impressive about the sector’s rally is that it came as the overall market declined. With the S&P 500 down over 6% in the last three months, the 44.4 percentage point performance spread between the two has only been wider for a brief period in March 2022. Outperformance of this magnitude on the part of the Energy sector is nearly unprecedented.
The Bespoke 50 Growth Stocks – 3/26/26
The “Bespoke 50” is a basket of noteworthy growth stocks in the Russell 3,000. To make the list, a stock must have strong earnings growth prospects along with an attractive price chart based on Bespoke’s analysis. There was one change to the list this week.
The Bespoke 50 is available with a Bespoke Premium subscription or a Bespoke Institutional subscription. With Bespoke Premium, you’ll receive a number of daily market updates from us along with our weekly newsletter and a portion of our investor tools. With Bespoke Institutional, you’ll receive everything that’s included with Premium plus additional daily macro analysis and more stock-specific research.
To see all 50 stocks that currently make up the Bespoke 50, simply start a two-week trial to Bespoke Premium or Bespoke Institutional.
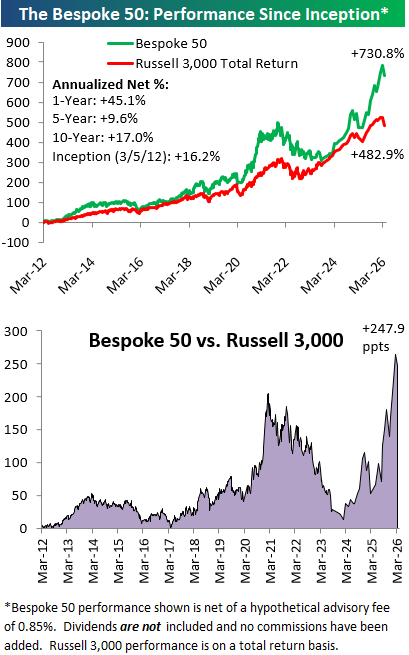
The Bespoke 50 performance chart shown does not represent actual investment results. The Bespoke 50 is updated monthly on Thursdays unless otherwise noted. Performance is based on equally weighting each of the 50 stocks (2% each) and is calculated using each stock’s opening price as of Friday morning after publication. Entry prices and exit prices used for stocks that are added or removed from the Bespoke 50 are based on Friday’s opening price. Any potential commissions, brokerage fees, or dividends are not included in the Bespoke 50 performance calculation, but the performance shown is net of a hypothetical annual advisory fee of 0.85%. Performance tracking for the Bespoke 50 and the Russell 3,000 total return index begins on March 5th, 2012 when the Bespoke 50 was first published. Past performance is not a guarantee of future results. The Bespoke 50 is meant to be an idea generator for investors and not a recommendation to buy or sell any specific securities. It is not personalized advice because it in no way takes into account an investor’s individual needs. As always, investors should conduct their own research when buying or selling individual securities. Click here to read our full disclosure on hypothetical performance tracking. Bespoke representatives or wealth management clients may have positions in securities discussed or mentioned in its published content.
The Closer – Chart Check, 50-DMA Stops, S&P Streaks – 3/26/26
Log-in here if you’re a member with access to the Closer.
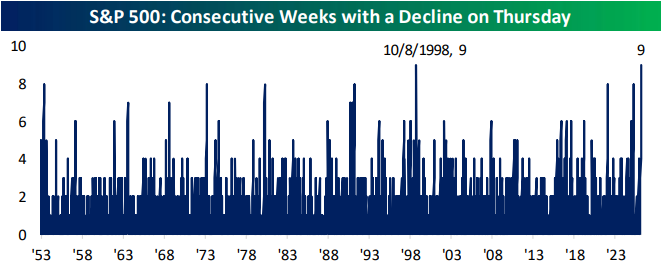
- Thursdays have been the weakest day of the week for the S&P 500 over the past decade, and 2026 has no exception with nine consecutive weeks of Thursday declines.
- Over the past 50 trading days, the Energy sector has seen some of the highest consistency of daily gains on record.
- A hypothetical strategy of only owning the S&P 500 when it has been above its 50-DMA has underperformed a simple buy and hold strategy for decades.
See today’s full post-market Closer and everything else Bespoke publishes by starting a 14-day trial to Bespoke Institutional today!
Q1 2026 Earnings Conference Call Recaps: Cintas (CTAS)
Bespoke’s Conference Call Recaps use AI to summarize lengthy earnings calls. The commentary below is AI-generated and then edited by Bespoke for quality control. As always, none of these summaries should be construed as recommendations to buy or sell any securities, and investors should do their own research and/or consult with a financial professional before making any investment decisions.
Our latest recap available to Bespoke subscribers covers Cintas’ (CTAS) Q3 2026 earnings call.
![]()
Cintas (CTAS) provides outsourced uniforms, workplace safety products, facility services, and fire protection solutions to over a million businesses, helping them manage essentials like employee apparel, compliance, and cleanliness. The company delivered another strong quarter with revenue up 8.9% to $2.84B (8.2% organic) and record gross margins across all route-based segments. Demand remains steady despite a “complex” macro backdrop, with resilience across healthcare, hospitality, and government customers. Growth continues to be fueled by new customer wins (two-thirds from “no-program” users, meaning customers previously handling everything themselves) and cross-selling into existing accounts. Management emphasized ongoing investment in SAP, route capacity, and sales resources to sustain above-GDP growth. Input costs like fuel and tariffs are manageable (about 1.7% of revenue), with no reliance on surcharges. The pending UniFirst acquisition adds scale, with closing expected in the second half of 2026. Guidance was raised, signaling confidence in continued momentum. The stock was down a modest 0.72% on 3/25…
Continue reading our Conference Call Recap for CTAS by becoming a Bespoke Institutional subscriber. You can sign up for Bespoke Institutional now and receive a 14-day trial to read our newest Conference Call Recap. To sign up, choose either the monthly or annual checkout link below:
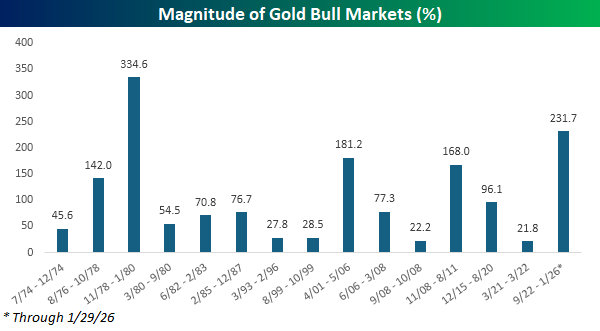
Tarnished Gold
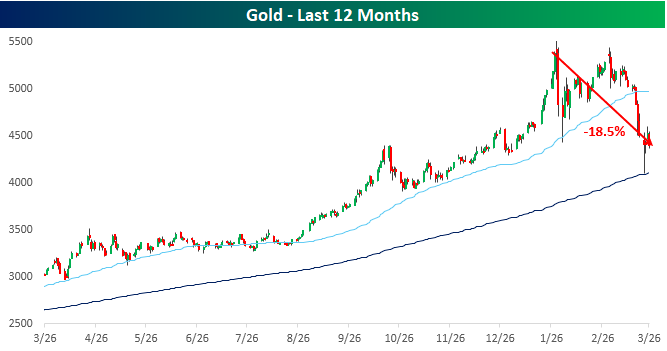
After bouncing yesterday, gold prices are declining again today, on pace for a one-day drop of over 3%. While today’s decline is not nearly enough for new lows on an intraday basis (it got down to the 200-DMA Monday), if gold closes at these levels, it will mark a new closing low for the current drawdown. That would take the peak-to-trough decline to 18.5% and very close to bear market levels (20%+ decline from a closing high without a 20%+ rally in between).
Bear markets haven’t been common for gold lately, as the current bull market began exactly three and a half years ago on 9/26/22. From that low through the closing high on 1/29/26, gold prices rallied 231.7%. In terms of magnitude, that would rank at the third longest since at least 1974, trailing only the 1,865-calendar-day bull market ending in May 2006 and the 1,694-day run ending in August 2020. For all 15 bull markets, the average length was 716 days, making the current one, if it turns out to have ended in January, 71% longer than average.
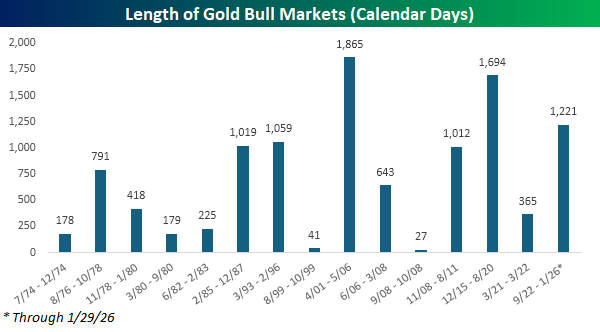
In terms of magnitude, the most recent bull market also ranks as one of the strongest. For all 15 bull markets since 1974, the average gain was 105%, or less than half of the gain during the current bull. In fact, the only bull market that experienced a larger gain was the 418-day bull market that ended in January 1980. In that 14-month rally, gold prices tripled from $191 up to $834 per ounce. Ironically, the level gold traded at when that bull market started is about the same as the amount by which gold prices are trading lower today!
Like this analysis? Join our premium members by starting a trial today! Click below for details on how to sign up:

Chart of the Day: Permanently Private
Bespoke’s Morning Lineup – 3/26/26 – No Joy in Marketville
See what’s driving market performance around the world in today’s Morning Lineup. Bespoke’s Morning Lineup is the best way to start your trading day. Read it now by starting a two-week trial to Bespoke Premium. CLICK HERE to learn more and start your trial.
“When we have computers that can do more and more jobs, it’s going to change how we think about work. There’s no way around that. You can’t wish it away.” – Larry Page
Below is a snippet of commentary from today’s Morning Lineup. Start a two-week trial to Bespoke Premium to view the full report.
There’s no joy in Marketville this morning as investors step up to the place for the opening bell. Nasdaq futures are down nearly 1% while the S&P 500 faces a gap down of 0.75% at the open. Treasury yields are higher across the curve, WTO and Brent crude oil are both up over 4%, gold is down 2.5%, and Bitcoin is down over 2%. Fun morning for the bulls!
With the five-day deadline imposed by the President, Monday fast approaching, and no signs of a diplomatic breakthrough, investors have no incentive to make a stand, and that doesn’t even take into account the government shutdown snarling air traffic. Maybe the only good news is jobless claims. Initial claims came in right inline with expectations, while continuing claims were well below forecasts, falling to a nearly two-year low.
In Asia, stocks reflected the pessimism as the Nikkei fell 0.3%, China declined 1.1%, and South Korea dropped the most, falling 3.2%. European stocks are doing no better. The STOXX 600 is down 1.0% halfway into the session, led lower by Germany and the UK, which are both down over 1.25%. ECB council member and Bundesbank President Joachim Nagel even noted that a rate hike in April is “certainly an option”.
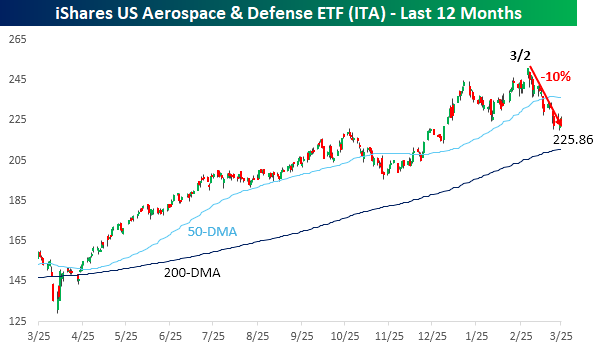
We’re now a month into the war in Iran, where every day’s news has shown images of precise strikes against the Iranian military. With all those weapons, it must be great for the defense contractors, right? Ironically, while aerospace and defense stocks performed well over the last year, they’ve seen a sell-the-news reaction since the war started. As shown in the chart of the iShares Aerospace & Defense ETF (ITA) below, the sector peaked on the first trading day after the first missiles were launched and has declined 10% since. That’s worse than the S&P 500!
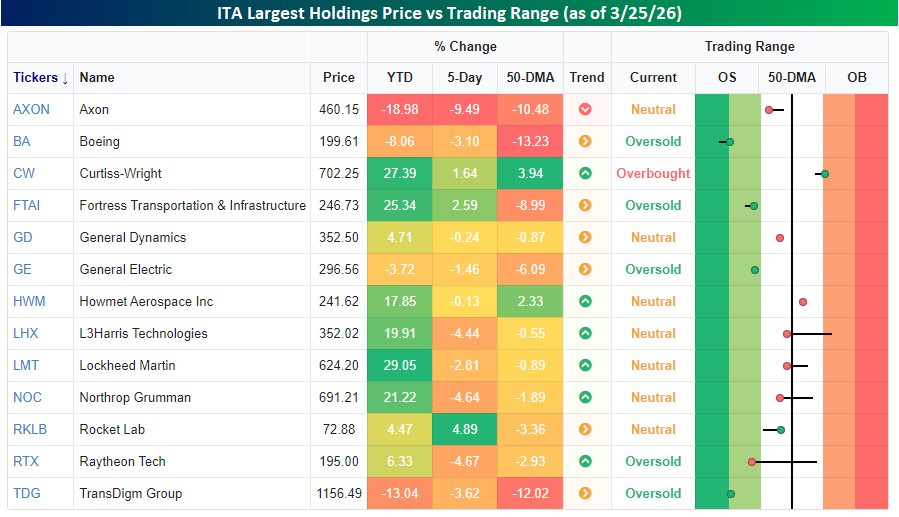
Looking through a list of ITA’s 13 largest holdings (all greater than 2% weighting), performance this year has mostly been positive. Nine of the thirteen stocks are up YTD, with an average YTD gain of just under 9%. Like the ETF, though, most of the largest holdings are below their 50-DMAs. In total, their average 50-DMA spread is -4.2%, and they’re down an average of 2% in the last five trading days.
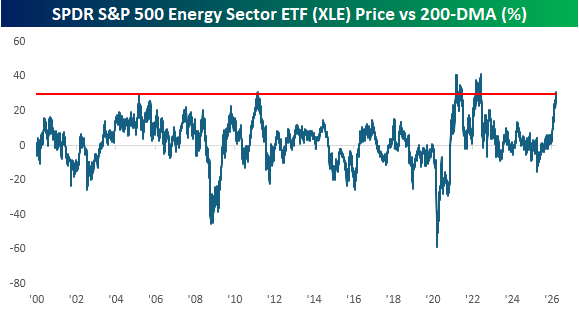
While defense stocks have struggled this month, Energy stocks have been on fire. The SPDR S&P 500 ETF (XLE) started to go parabolic at the turn of the calendar and hasn’t looked back since.
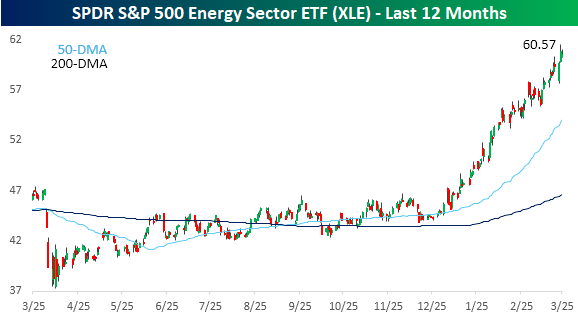
The rally in the sector has been so strong that the spread between XLE’s price and 200-DMA exceeded 30% this week. Since the ETF’s inception in 1999, there have only been a few other periods where the spread exceeded 30%. The most recent was early in the Russia-Ukraine war, and before that, the only other occurrences were in the first half of 2021 as the economy reopened from Covid and then briefly in early 2011 when oil prices spiked due to the Arab Spring and a civil war in Libya.
The Closer – Tech Valuations, Rotation, Trade Prices – 3/25/26
Log-in here if you’re a member with access to the Closer.
- Over the past six months the decline in the P/E ratio of Tech versus the S&P 500 has fallen by the largest amount since 2002.
- Performance this week has appeared to be largely rotational as the best performers were also those that were the worst performers month-to-date through Friday.
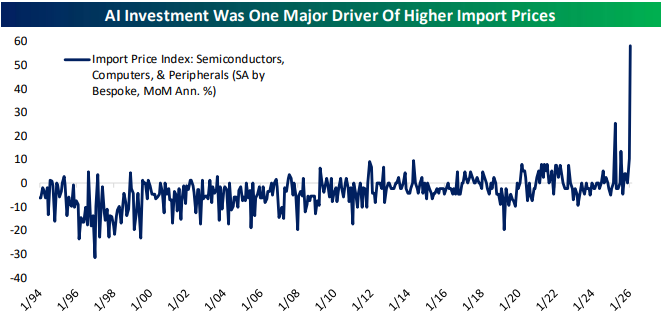
- After seasonal adjustment February saw the third-largest increase in ex petroleum import prices since monthly data begins at the end of the 1980s.
See today’s full post-market Closer and everything else Bespoke publishes by starting a 14-day trial to Bespoke Institutional today!