Get Invested: Ignore the Noise
Our “Get Invested” series is a simple yet powerful resource designed to help anyone understand why investing in stocks for the long term is one of the best financial decisions they can make. The slide below from our Get Invested piece is titled “Ignore the Noise.”
It’s hard to avoid monitoring the day-to-day action of the market when your hard-earned money is at stake, but for money that’s invested for the long-term, it’s best to try and ignore the noise.
The left chart below shows daily closing prices for the S&P 500 since the start of 2023. The right chart shows the S&P 500’s average daily closing price over the prior 200 trading days over the same time frame. Ignoring the daily ups and downs of the market and focusing on the longer-term trend is a helpful way to reduce unforced anxiety and potential disruptions to a buy and hold strategy.

If you have any questions about our Get Invested resource, please email us or give us a call at 914-315-1248. You can view the full piece by becoming a Bespoke client.

Click here to learn more about Bespoke’s wealth management services.
The Bespoke Report – 2/28/25 – Uncertainty Reigns
To read our weekly Bespoke Report newsletter and access everything else Bespoke’s research platform offers, start a two-week trial to Bespoke Premium. In this week’s report, we look at the rising tide of uncertainty reported by factories and consumers, the outlook for growth in the rest of the first quarter, the message companies are sending in earnings this season, recent cross-asset price trends, and much more! Don’t miss it.

When the Weekend Was a Good Thing
Through yesterday’s close, the S&P 500’s average daily performance during the second Trump administration has been a decline of 0.8%. The magnitude of the declines hasn’t been spread out evenly across each of those days. The chart below shows the S&P 500’s daily performance on every trading day since the inauguration, and we have also highlighted Mondays and Fridays in red. The days surrounding the weekend have been notably weak. Of the nine Friday and Monday sessions since 1/21, the S&P 500 has traded lower eight times for a median decline of 0.5%. These are some pretty weak numbers, but in the early days of this administration, we have seen no shortage of Friday afternoon and weekend headlines that the market has been forced to adjust to.

It’s still extremely early in this administration, so the extreme weakness of the market on Fridays and Mondays could easily shift, but we found it interesting how much these numbers differ from average weekday performance under President Biden. During his four years in office, Friday and Monday were easily the best days of the trading week, with average gains of 9.8 bps and 8.5 bps, respectively. Just like in life, for the markets, no news is sometimes good news, and unlike the first few weeks of the second Trump Administration, weekends during the Biden Administration tended ot be quiet from Friday afternoons through early Monday.


Bespoke’s Morning Lineup – 2/28/25 – Not Another Weekend!
See what’s driving market performance around the world in today’s Morning Lineup. Bespoke’s Morning Lineup is the best way to start your trading day. Read it now by starting a two-week trial to Bespoke Premium. CLICK HERE to learn more and start your trial.
“Everybody deserves a fresh start every once in a while.” – Bugsy Siegel

Below is a snippet of commentary from today’s Morning Lineup. Start a two-week trial to Bespoke Premium to view the full report.
It’s been a rough few days for the equity market since last Wednesday’s record closing high, but at least futures are trading modestly higher. Maybe the market is getting a fresh start! After these last six trading days, if positive futures still make you optimistic, what market have you been watching? On five of those six days, the S&P 500’s intraday high came in the first ten minutes of the trading day, and there has been a reliable pattern of afternoon selling the entire time. Just look at the chart below of the S&P 500 ETF (SPY); since last Wednesday’s record high, there have been six straight days where SPY finished the day below where it opened. Is it too much to ask for just one day when Lucy doesn’t pull the football away from Charlie Brown?
We just got a bunch of economic data hitting the tape, and it was mixed. Personal Income increased more than expected, but Personal Spending was weaker than expected. More importantly, though, PCE data, which the market was most focused on, came in right in line with expectations. The immediate reaction in equity futures has been positive, but we’ll see how that plays out as the market digests the numbers.

While you may be thinking TGIF, that hasn’t been the case in the early days of the second Trump Administration. The chart below shows the S&P 500’s performance on every trading day since President Trump was inaugurated, with Fridays and Mondays highlighted in red. Of the nine trading sessions that have occurred on Friday or Monday during this time, the S&P 500 has only been up once (2/10, +0.67%), and the median performance has been a decline of 0.50%.
Get Invested: Don’t Sleep on Dividends
Our “Get Invested” series is a simple yet powerful resource designed to help anyone understand why investing in stocks for the long term is one of the best financial decisions they can make. The slide below from our Get Invested piece is titled “Don’t Sleep on Dividends.”
Owning the “market” through a “buy and hold” strategy of an ETF like SPY (that tracks the S&P 500) means you’ll capture the dividend yield of the market as well. Over time, those dividends really add up. Since 1993 when the first S&P 500 ETF (SPY) began trading, nearly half of the index’s 2,390% total return has come from capturing and reinvesting quarterly dividend payouts.

If you have any questions about our Get Invested resource, please email us or give us a call at 914-315-1248. You can view the full piece by becoming a Bespoke client.
Click here to learn more about Bespoke’s wealth management services.
The Closer – Uncertainty, Implementation Implodes, KISS – 2/27/25
Log-in here if you’re a member with access to the Closer.
Looking for deeper insight into markets? In tonight’s Closer sent to Bespoke Institutional clients, we begin with a look at the enormous number of mentions on tariffs on conference calls and what that means for uncertainty (page 1). We then review the latest GDP data (page 2) and earnings reports released after the bell (page 3). Next, we review the sharp drop in AI names (page 4) followed by an update of our KISS basket (page 5).

See today’s full post-market Closer and everything else Bespoke publishes by starting a 14-day trial to Bespoke Institutional today!
Q4 2024 Earnings Conference Call Recaps: eBay (EBAY)
Bespoke’s Conference Call Recaps use AI to summarize lengthy earnings calls. The commentary below is AI-generated and then edited by Bespoke for quality control. As always, none of these summaries should be construed as recommendations to buy or sell any securities, and investors should do their own research and/or consult with a financial professional before making any investment decisions.
Our latest recap available to Bespoke subscribers covers eBay’s (EBAY) Q4 2024 earnings call.
![]()
eBay (EBAY) operates one of the world’s largest online marketplaces, connecting buyers and sellers across categories, from collectibles and fashion to electronics and auto parts. Unlike traditional e-commerce giants, eBay specializes in consumer-to-consumer (C2C) and enthusiast-driven commerce, offering a platform for secondhand and unique inventory. The company’s deep AI investments include proprietary large language models, enhanced search, pricing, and listing optimization, while its global partnerships, including integrations with OpenAI and Meta, expand its reach. EBAY delivered 2% GMV growth to $19.3B, led by Trading Cards (double-digit growth) and Motors Parts & Accessories. AI-powered features propelled seller adoption, with over 10 million using Gen AI tools. Advertising revenue climbed 12% to $445M, countering take rate pressures. Consumer demand held steady in the US but remained weak in the UK/Germany, with macro concerns around tariffs and de minimis rule changes ahead. Despite challenges, eBay sees low single-digit GMV growth for 2025, prioritizing AI, category expansion, and seller monetization. Despite beating estimates, EBAY fell as much as 10% on 2/27 on light guidance…
Continue reading our Conference Call Recap for EBAY by becoming a Bespoke Institutional subscriber. You can sign up for Bespoke Institutional now and receive a 14-day trial to read our newest Conference Call Recap. To sign up, choose either the monthly or annual checkout link below:
Claims in the Capital
It was a big day for scheduled Thursday releases. For starters, weekly sentiment data showed a huge spike in bearish sentiment (which we covered in today’s Chart of the Day and Morning Lineup), and among the economic data releases, jobless claims experienced a notable spike. For seasonally adjusted initial claims through the week of 2/22, claims totaled 242K, up 22K from the previous week’s upward revision of 220K. As shown below, at those levels, claims have returned to the upper end of the past few years’ range with this marking the largest single-week increase since a 35K surge in October.

Before seasonal adjustment, claims totaled 220.5K. That is up versus the comparable week of the past two years and is more in line with levels from February 2022, meaning that claims are up relative to recent years but not extraordinarily high. On the bright side, claims are moving in line with seasonally normal patterns, as shown in the second chart below. Claims will likely continue to have these seasonal tailwinds out through the spring.

Nationally, claims are higher, but it is hard to classify it as too much of a concern- yet. Additionally, state-level data offers some insight into the uptick. Among many changes, thanks to the new administration taking office, the federal government has been getting a shake-up from audits from the Department of Government Efficiency (DOGE). There have already been job losses as a result of these attempts to curtail government spending, which is showing up through DC area claims. We first noted the increase in claims in the Washington DC metro area in last Thursday’s Closer, and the updated data one week later has reaffirmed more jobs have been lost. As shown below, claims from the capital have risen above 2,000 for the first time since Q1 2023, which was around the time of a looming debt ceiling standoff. Before that, the only other spikes of similar size or larger were the COVID period and the 2018-2019 government shutdown.

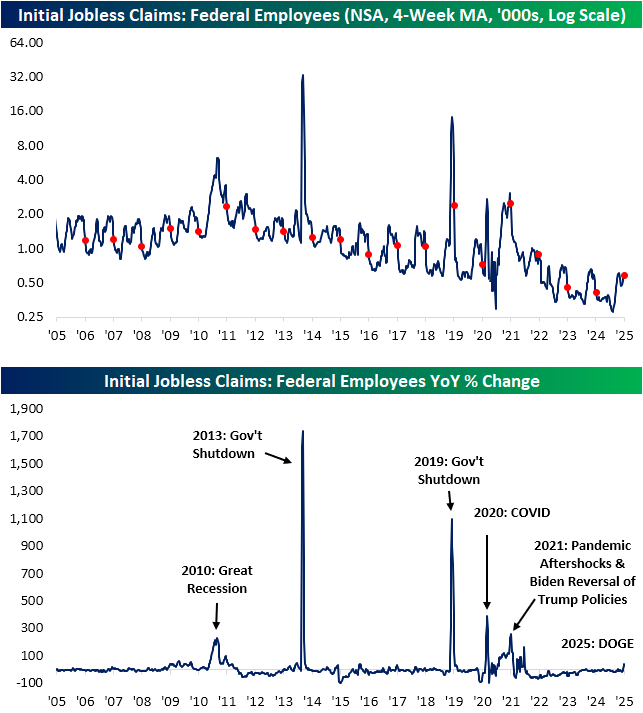
Of course, looking at claims in the DC area is only one proxy for the loss in government jobs. The Department of Labor also offers a look at claims filed in federal programs. These, of course, are a more direct look at government job loss. As shown in the first chart below, federal employee claims have generally trended lower over the past 15 or so years, having been near record lows (at the time of seasonal annual lows) in the past several years. This time of year usually sees an unwinding of a seasonal spike in claims, but this year, the opposite has been playing out, with claims continuing to move higher in the past couple of weeks.
In fact, the four-week moving average for federal employee claims has risen over 40% on a year-over-year basis. As shown in the second chart below, that spike hardly registers when put up against things like government shutdowns and recessions. One comparable spike worth mentioning, though, is from early 2021, shortly after Biden took office. That was another period with a notable spike in federal claims thanks to hiring freezes and employment reductions due to policy shifts moving from one administration to another. In other words, the recent DOGE job cuts have some very recent parallels.
Obviously, it’s still early in the game. It’s only been a little more than a month since President Trump’s inauguration, so it wouldn’t be surprising to see government-related claims continue rising as DOGE continues its auditing. With that in mind, federal employee continuing claims are right about where they were for this time last year. Additionally, like initial claims, those levels are at a seasonal inflection point and are considerably lower than what they have been in past decades.

Q4 2024 Earnings Conference Call Recaps: NVIDIA (NVDA)
Bespoke’s Conference Call Recaps use AI to summarize lengthy earnings calls. The commentary below is AI-generated and then edited by Bespoke for quality control. As always, none of these summaries should be construed as recommendations to buy or sell any securities, and investors should do their own research and/or consult with a financial professional before making any investment decisions.
Our latest recap available to Bespoke subscribers covers NVIDIA’s (NVDA) Q4 2025 earnings call.
![]()
NVIDIA (NVDA) is the dominant force in AI computing, designing high-performance GPUs and data center solutions that power everything from gaming to deep learning. Its cutting-edge chips are at the heart of AI models, self-driving cars, and high-performance computing, making it an essential player in the AI revolution. NVDA reported another record quarter, with Q4 revenue hitting $39.3 billion, up 78% YoY, driven by soaring AI demand. The Blackwell GPU architecture ramped faster than any prior product, with $11 billion in Q4 sales, as hyperscalers race to build AI factories. Inference demand is growing quickly, with reasoning models like OpenAI’s GPT and DeepSeek-R1 requiring 100x more compute per task than traditional inference. Enterprise AI adoption doubled YoY, with industries from healthcare to finance leveraging NVIDIA’s stack. Networking revenue dipped 3% sequentially, but the transition to NVLink 72 and Spectrum-X is a major long-term growth vector. China sales stabilized at half pre-export control levels, while US demand climbed. NVDA expects Q1 revenue of $43 billion, with Blackwell accelerating further. On the triple play, the stock opened 2.7% higher on 2/27, but dipped negative intraday…
Continue reading our Conference Call Recap for NVDA by becoming a Bespoke Institutional subscriber. You can sign up for Bespoke Institutional now and receive a 14-day trial to read our newest Conference Call Recap. To sign up, choose either the monthly or annual checkout link below: